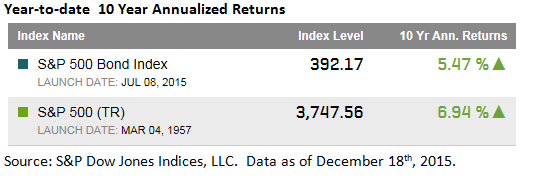
Stocks and bonds behave differently in most market environments and the resulting low historical correlation between the two has been an important factor in many investment strategies. With the launch of the S&P 500 Bond Index we can now compare the performance of stocks and bonds of the same ‘blue chip’ entities in the iconic S&P 500 Index.
Highlights (total returns used for comparability):
- The energy and materials sectors have been significant drags on both the stock and bond markets.
- The utilities sector has been a drag on the equity sector but less so for the bond market.
- The consumer discretionary, consumer staples, health care and I.T. sectors have been contributing to the equity markets returns while bond market returns for these sectors have been muted by the low rate environment seen throughout 2015.
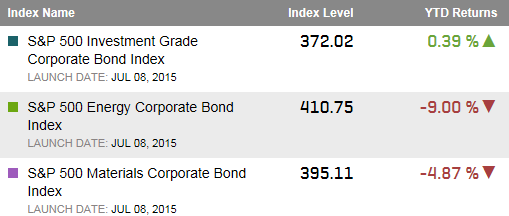
- The S&P 500 Energy Index is down over 19.3% year-to-date while the S&P 500 Energy Corporate Bond Index is down over 8.8% year-to-date.
- The S&P 500 Materials Index is down over 6.9% while it’s bond counterpart is down over 4.9%.
Chart 1: Selected S&P 500 Sector Indices for both stocks and bonds
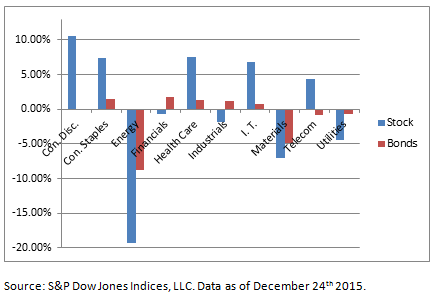
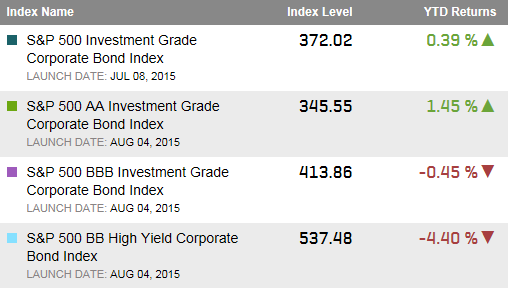
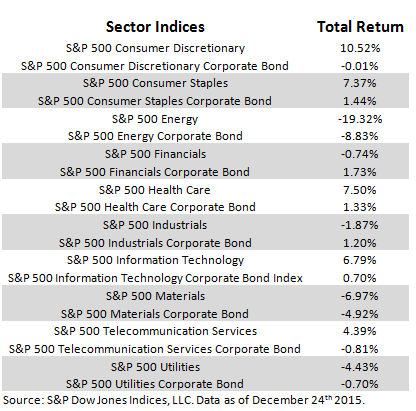
Table 1: Selected S&P 500 Sector Indices for both stocks and bonds (Year-to-date Total Returns through December 24th 2015)
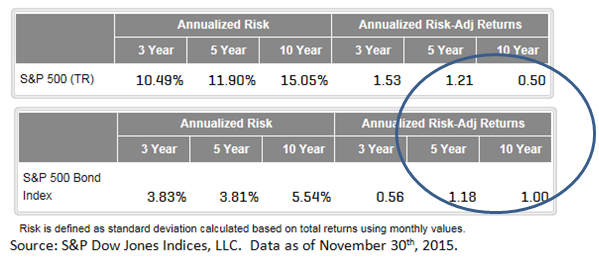
When a full year of data is available it will be important to consider the impact of volatility in each asset class by comparing the Risk Adjusted Returns within each sector.
The posts on this blog are opinions, not advice. Please read our Disclaimers.