The Reserve Bank of India recently surprised the market by reducing the repo rate by 25 bps in January 2015, and market experts are expecting further reduction. While the equity markets were in euphoria, with the S&P BSE SENSEX returning 6.15% in January 2015, the bond market told a different story.
The Indian bond market has the second-highest representation by outstanding par amount in the S&P Pan Asia Bond Index, with nearly 12.8% as of Jan. 30, 2015 (see Exhibit 1).
Exhibit 1: Percentage of Outstanding Par Amount in the S&P Pan Asia Bond Index
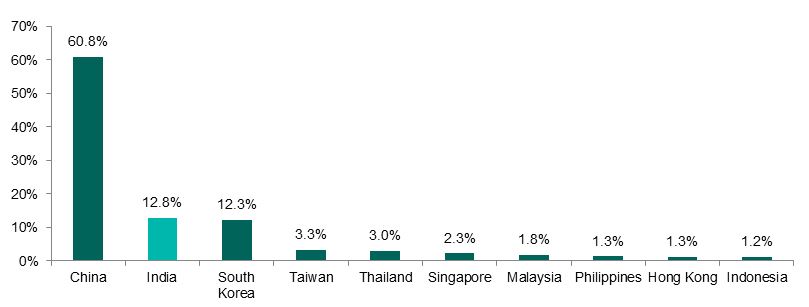 Source: S&P Dow Jones Indices LLC. Data as of Jan. 30, 2015. Past performance is no guarantee of future results. Charts and tables are provided for illustrative purposes only.
Different countries have different thresholds for outstanding par amount to be included in the S&P Pan Asia Bond Index. For India, the threshold for sovereign bonds and government bills is INR 30 billion, agency bonds and provincial bonds is INR 15 billion and corporate bonds is INR 3 billion. This ensures fair representation of Indian bonds in the S&P Pan Asia Bond Index.
All Indian securities in the S&P Pan Asia Bond Index are combined to form the S&P India Bond Index, which is further divided into the S&P India Government Bond Index and the S&P India Corporate Bond Index, and in which government bonds represent nearly 88.5% of the outstanding par amount as of Jan. 30, 2015.
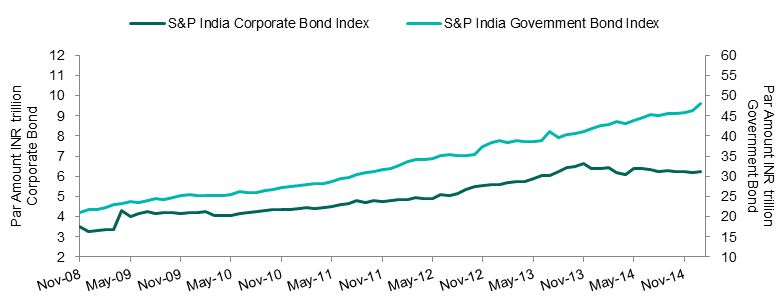
Exhibit 2: Historical Outstanding Par Amount in S&P India Government Bond Index and S&P India Corporate Bond Index.
 Source: S&P Dow Jones Indices LLC. Past performance is no guarantee of future results. Charts and tables are provided for illustrative purposes only.
Exhibit 2 shows the historical outstanding par amounts in the respective indices, showing an increase to INR 48 trillion from INR 21 trillion for government bonds and to INR 6 trillion from INR 4 trillion for corporate bonds from November 2008 to Jan. 1, 2015.
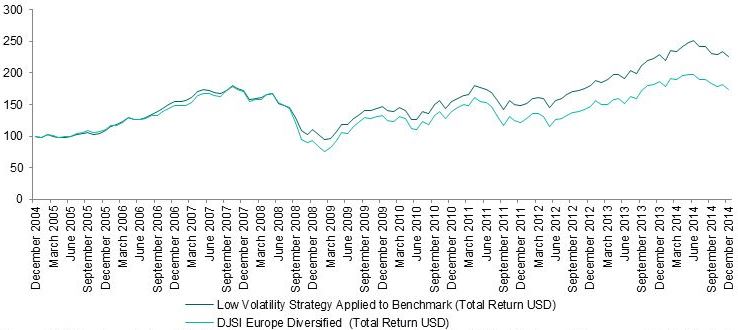
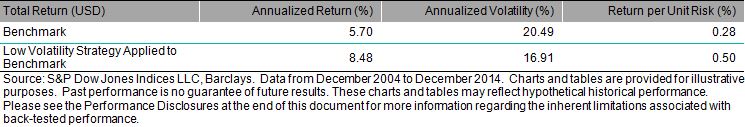
During January 2015, the S&P India Government Bond Index returned 1.89%, which was 0.47% greater than the return of the S&P India Corporate Bond Index over the same period. The reduction in key rates also affected the yields of the bonds, and the effect can be seen in the yield to worst (YTW) graph in Exhibit 3.
The correlation of the repossession rate with the YTW of the S&P India Government Bond Index was almost 82%, while the same correlation measure for the S&P India Corporate Bond Index was 69% for the six-year period ending Jan. 30, 2015. Over the same period, the annualized return for the S&P India Government Bond Index was 7.66% and that of the S&P India Corporate Bond Index was 9.75%. The YTW spread between the two indices has also decreased from 245 bps to 67 bps between Nov. 28, 2008, and Jan. 30, 2015.
Exhibit 3: YTW and Total Returns for the S&P India Government Bond Index and S&P India Corporate Bond Index
 Source: S&P Dow Jones Indices LLC. RBI Repo Rate Source: Reserve Bank of India. Past performance is no guarantee of future results. Charts and tables are provided for illustrative purposes. YTW spread is between the YTW of the S&P India Government Bond Index and S&P India Corporate Bond Index.
To summarize, though the Indian bond market has grown, it is still dominated by government securities and monetary policy therefore plays a crucial role.
The posts on this blog are opinions, not advice. Please read our Disclaimers.