Get Indexology® Blog updates via email.

In This List

Freezing Temperatures, Hot Bonds

No Alchemy Needed

Home Price Bricks in Your Portfolio

Leverage Loan Redemptions = Record Trading Volume + Market Depth?

The Rieger Report: Should Municipal Bonds be "Core"?

Freezing Temperatures, Hot Bonds

Contributor Image
Kevin Horan

Former Director, Fixed Income Indices

S&P Dow Jones Indices

The current cold snap that has descended upon the east coast of the U.S. has winter temperatures on par with its neighboring country to the north.  In addition to the weather, the Canadian bond market has seen its share of interest, as on Jan. 21, 2015, the Bank of Canada (BOC) cut rates by 25 bps to an overnight lending level of 0.75%.  The need for the BOC to act was created by sliding inflation, weaker crude prices (which threaten domestic sand oil production), and lagging employment growth.

After the news, Canadian sovereign bonds, as measured by the S&P Canada Sovereign Bond Index, rallied by 0.45%, and this continued into Jan. 23, 2015, with a 0.30% daily total return.  The index closed the month of January at 3.77%, and it has returned 3.86% YTD as of Feb. 2, 2015.  In comparison, the  S&P/BGCantor US Treasury Bond Index has returned 2.00% YTD as of Feb. 2, 2015.

Along with sovereigns, performance of additional segments of the Canadian fixed income market has been just as impressive.  Exhibit 1 shows that over the course of the last year, investment-grade corporates (as measured by the S&P Canada Investment Grade Corporate Bond Index) have tracked sovereigns tightly and recently began to underperform sovereigns.  As of Feb. 2, 2015, the S&P Canada Investment Grade Corporate Bond Index has returned 3.01% YTD.  Since the beginning of the year, the performance for all components of the S&P Canada Aggregate Bond Index has been strong.  The leader of the pack (including sovereigns, provincials and municipals, corporates, and collateralized bonds) has been the S&P Canada Provincial & Municipal Bond Index.  After returning 10.48% in 2014, this segment of the Canadian market has returned 5.83% YTD (as of Feb. 2, 2015).  The combination of yield and a government guarantee has led to significant 2015 performance for securities in this index, with issuers such as Canada Mortgage and Housing, the Province of Quebec, Saskatchewan, British Columbia, and Ontario being some of the top performers.

The laggard of the group is the S&P Canada Collateralized Bond Index, which has returned 1.54% YTD as of Feb. 2, 2015, but the index represents less than 1% of the S&P Canada Aggregate Bond Index.

Exhibit 1: Total Returns of Canadian Bond Indices
Total Returns of Canadian Bond Indices

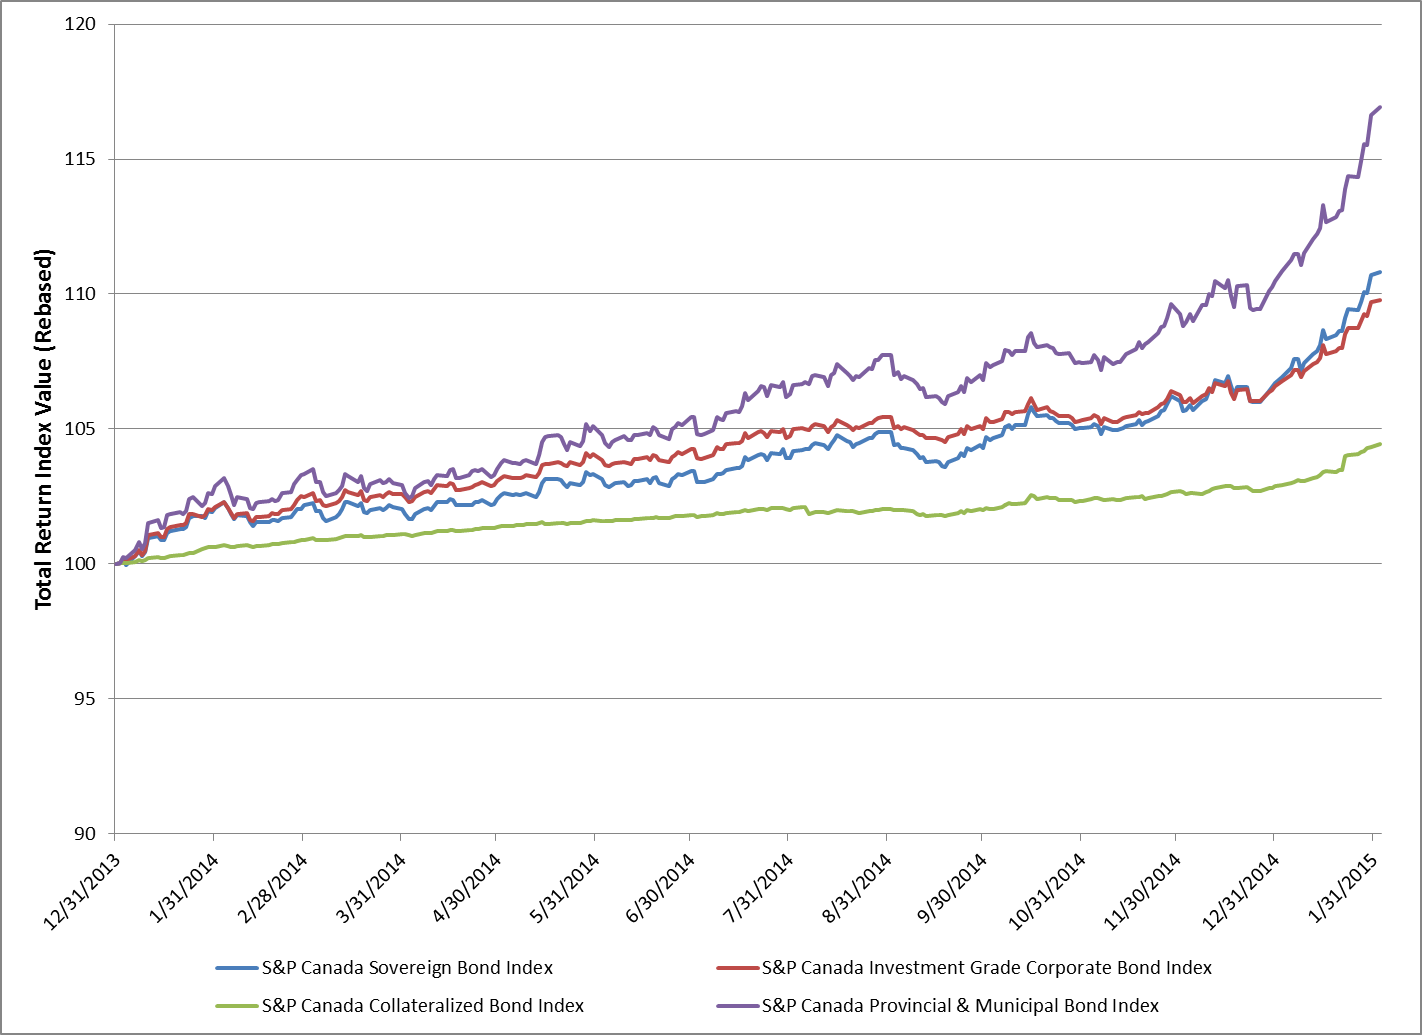
Source: S&P Dow Jones Indices LLC.  Data as of Feb. 2, 2015.  Charts and tables are provided for illustrative purposes.  Past performance is no guarantee of future results.

The posts on this blog are opinions, not advice. Please read our Disclaimers.

No Alchemy Needed

Contributor Image
Craig Lazzara

Former Managing Director, Index Investment Strategy

S&P Dow Jones Indices

In January 2015, the total return of the S&P 500 Index was -3.0%.  We published this number last Friday evening, after January trading ended, and of course it’s been widely reported since then.  It may therefore surprise you to learn that some investors in the S&P 500 reaped a total return of +4.0% in January.

In this case, there’s no magic needed to turn dross into gold; all the work is done by currency translation.  European investors in the U.S. may have suffered the index’s -3.0% decline, but by holding assets in U.S. dollars rather than in Euros, they avoided the Euro’s -7.0% fall against the dollar.  Translated back to their home currency, they therefore made 4.0% in January.  Similarly, European investors in the S&P TOPIX 150 earned a total return of 9.8% — perhaps surprising their Japanese counterparts, who thought their local market was up by barely 0.2%.  The same effect applies to any pair of relatively strong and relatively weak currencies.  (Last month Canadian investors earned 0.6% in the S&P TSX 60.  Americans who ventured north lost -8.1% as the greenback gained against the loonie.)

Other things equal, if the Euro continues to weaken relative to the dollar, European investors will be more attracted to U.S. investments than they would be otherwise, and similarly U.S. investors will have an incentive not to direct funds to Europe.  Some have therefore argued that “the strong dollar will act like a magnet for global capital.”

Continued currency movements could have that effect.  It’s important to remember, though, that to make this alchemy work, it’s not enough that the dollar be strong.  The dollar must strengthen; changes in exchange rates (and other financial variables) are far more important than the level of those variables.  That said, if the dollar continues to rise, American investors’ home bias will continue to be rewarded, and the U.S. will look increasingly attractive to their European and Canadian counterparts.

The posts on this blog are opinions, not advice. Please read our Disclaimers.

Home Price Bricks in Your Portfolio

Contributor Image
Marya Alsati

Former Product Manager, Commodities, Home Prices, and Real Assets

S&P Dow Jones Indices

In this post, we look at whether adding a home price index, as part of a multi-asset bundle, to a hypothetical portfolio could potentially improve its attributes. We created two portfolios, one comprised of equities and bonds (portfolio A), and a second that contained the elements of portfolio A plus commodities, home prices and infrastructure (portfolio B). We found that the undiversified portfolio A performed better, while the diversified portfolio B had a lower risk attribute during shorter time periods. The two portfolios converged over the long run.

Exhibit 1 shows the weight distribution of the indices in each hypothetical portfolio.

Diversification_Exhibit1

In the short run, the performance of portfolio A outperformed portfolio B. In fact, during the 12-year period, on a monthly basis, portfolio A outperformed portfolio B 56% of the time. Interestingly, the two portfolios had similar maximum gains and declines, and they also showed similar average returns, as shown in Exhibit 2.

Diversification_Exhibit2

It can be seen from Exhibit 3 that in the long run, the two portfolios converged in terms of risk and returns. However, in the short run, higher returns could be obtained using the undiversified portfolio and lower risk in the diversified portfolio. Note that these results would vary if the weighting scheme and indices used change.

Diversification_Exhibit3

The posts on this blog are opinions, not advice. Please read our Disclaimers.

Leverage Loan Redemptions = Record Trading Volume + Market Depth?

Contributor Image
Tyler Cling

Senior Manager, Fixed Income Indices

S&P Dow Jones Indices

With the majority of the fixed income world taking sides on prize fights like Greece, the European Central Bank (ECB), inflation, and energy-related debt, you may have missed the beating leveraged loans have been receiving in the media.

The Financial Industry Regulatory Authority (FINRA) cited senior loan liquidity concerns in their January letter, stating “…these loans could face liquidity challenges if a significant number of investors make redemption requests at the same time.” Forbes published an article last week observing outflows in the bank loan market 39 of the last 40 weeks, totaling USD 25.9 billion in redemptions from the asset class. How did loans fair in the redemption ring?

Leverage_Loan_Redemptions_Figure1

The Loan Syndications & Trading Association (LSTA) saw bank loan trading volumes increase 21.5% in 2014, to a record $628 billion, from the previous year (Exhibit 1). The LSTA also observed record market depth in the fourth quarter of 2014. In Q4 2014, over 54% of the 1,750 loan facilities traded, traded 20 times or more (see Exhibit 2).

Leverage_Loan_Redemptions_Figure2

While we all know past performance is not indicative of future performance, in times of record redemptions, why is the dialogue focused on liquidity concerns versus liquidity metrics? It is also worth noting that during the final nine months of 2014, bank loan mutual funds were able to meet over USD 28 billion redemption requests in every single case.

The S&P/LSTA Leveraged Loan 100 Index, which seeks to track the largest loan facilities, has been less volatile than the S&P U.S. Issued High Yield Corporate Bond Index over the past five years and it has achieved comparable risk-adjusted returns. Yields are also higher for the S&P U.S. Issued High Yield Corporate Bond Index than for the S&P/LSTA Leveraged Loan 100 Index (6.5% versus 5.05%, respectively), implying that market participants are willing to hold bank loans for less of an interest return than high-yield corporate debt.

Leverage_Loan_Redemptions_Figure3

With all credit, liquidity concerns for bank loans are real, but they should be viewed relative to the fixed income marketplace. The leverage loan bout might just be back-page news because it is lacking the glass jaw worthy of the K.O. headlines monopolizing page one.

Leverage_Loan_Redemptions_Figure4

The posts on this blog are opinions, not advice. Please read our Disclaimers.

The Rieger Report: Should Municipal Bonds be "Core"?

Contributor Image
J.R. Rieger

Former Head of Fixed Income Indices

S&P Dow Jones Indices

The often misunderstood municipal bond market is not considered a ‘core’ asset class by many investors and institutions offering financial products to investors.  Certainly investment grade municipal bonds have some qualifications to be ‘core’ and the proposed Qualified Public Infrastructure Bond (QPIB) might help change the way we think about this important asset class.

Some things for us to consider:

  • High quality.  The average rating (Moody’s, S&P and or Fitch) of bonds in the S&P National AMT-Free Municipal Bond Index is higher than the average rating of bonds in the S&P U.S. Issued Investment Grade Corporate Bond Index.
  • Low default rate.  According to our research (Rieger & Cling: 2015), the 2014 12 month trailing default rate for municipal bonds was 0.17% (by number of defaults vs. # of bond deals outstanding).  I would be hard pressed to find another U.S. bond asset class beyond U.S. Treasuries that had a lower a default rate.
  • Duration.  It is a common assumption that municipal bonds are longer in duration than corporate bonds.  Currently the duration of the S&P National AMT-Free Municipal Bond Index (tracking only investment grade bonds) is 2 years shorter in duration than the duration of the S&P U.S. Issued Investment Grade Corporate Bond Index.  All else being equal, shorter duration means lower price movement up and down when rates rise and fall.
  • Yield.  The nominal yield of tax-exempt municipal bonds is indeed lower than corporate bonds.  However, when looked at from the perspective of how much return an investor actually keeps after taxes the story is different.  The taxable equivalent yield of municipal bonds is very competitive to taxable bonds.
  • Not only for the wealthy.  In the current high tax environment we are in tax-exempt municipal bonds can be considered an option for many investors and not just the wealthy or the top 1%.
  • Liquidity.  U.S. municipal bonds are indeed less liquid than their corporate bond counterparts.  Most municipal bonds are smaller in par amount than corporate bonds and there are many more municipal bonds brought to market. However, investment grade municipal bonds are far from illiquid.  During the 12 month period ending November 2014 an average of 68% of the over 9,500 bonds in the S&P National AMT-Free Municipal Bond Index traded each month!  The average trade size during that period of time:  over $265,000.
  • Public good.  U.S. municipal bonds serve as an important infrastructure funding source.  Roads, highways, bridges, tunnels, airports, ports, schools and so much more are built and maintained because they are funded by bonds.
  • QPIB. The recent proposal by President Obama to create a new type of bond called a Qualified Public Infrastructure Bond (QPIB) is intended to bolster the issuance of bonds to help maintain U.S. infrastructure.  This proposal must pass a republican congress and it is not the administrations first attempt at funding infrastructure development.  However, we all can see the degradation of our infrastructure.  Considering investment grade municipal bonds as a ‘core’ asset class might help this program and the use of other municipal bond issues make a difference.

References cited:

Rieger, James & Cling T.  January 2015 Fixed Income Update: The U.S. Municipal Bond Default Rate Hits 3-Year High in 2014: 0.17%

The posts on this blog are opinions, not advice. Please read our Disclaimers.