Homeowners choose the time to sell their home for various personal and socioeconomic reasons but also for financial considerations such as mortgage rates, tax consequences, current property values, and the holding period. The holding period is the time frame between the day the residential property was purchased to the day it was sold. The general belief is that the longer the holding period the larger the gains and the smaller the losses.
In this post, we will analyze this assumption using the S&P/Case-Shiller Home Price Indices. The indices use the repeat sales method for index calculation. The repeat sales method analyzes data on single family properties that have two or more recorded sales transactions. This arm’s length view can be used to capture the holding period.
The analysis was performed on the S&P/Case-Shiller 10-City Composite Home Price Index, which measures the change in the value of residential real estate in 10 metropolitan areas of the U.S.
The left axis in the chart below depicts rolling returns of the 10-City Composite Index on 1-year, 3-year, 5-year, 7-year, and 10-year holding period durations. The rolling returns refer to the mathematical process of comparing one year of data to the previous period’s data. For example, the 10 year holding period returns compares January 2010 with January 2000, February 2010 with February 2000 and so on. The right axis of the chart depicts index levels of the composite index.
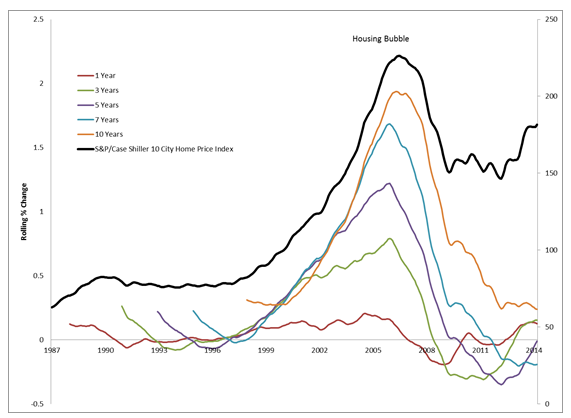
It can be seen from the graph above that the 10-year holding period yields larger gains and smaller declines than the shorter periods.
The table below shows summary statistics on different holding periods for the 1987-2014 timeframe. The 20-year and 10-year holding periods have the largest gains and smallest declines and the 10-year and 7-year holding periods have the largest deviation from the mean. This means there is a large variance in the highest and lowest returns one can earn during the holding period.
The table below shows summary statistics on different holding periods for the 1987-2014 timeframe. The 20-year and 10-year holding periods have the largest gains and smallest declines and the 10-year and 7-year holding periods have the largest deviation from the mean. This means there is a large variance in the highest and lowest returns one can earn during the holding period.

The table below portrays the gains and losses earned if the holding period began during the 2006 peak.
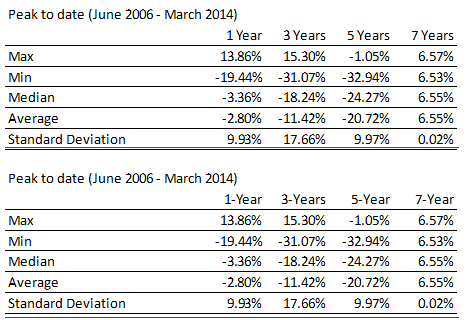
While the longer 7-year holding period fared better than the shorter duration periods, the 3-year period performed better that the 5-year period during that time frame, likely due to the trough being in 2012.
By comparing the 3-year, 5-year, and 7-year holding periods across the two holding periods, it can be seen that a long holding period results in larger gains and smaller declines. This, however, is dependent on when the holding period actually starts. For example, the average gain or loss for a 5-year holding period that spans the entire length of the data is 30.67%, and is however -20.72% for the peak to present holding period. It can be concluded that longer holding periods do yield better results, but depending on when the holding period begins one might have to have and to hold their property a little longer.
The posts on this blog are opinions, not advice. Please read our Disclaimers.