Get Indexology® Blog updates via email.

In This List

Leveraged Loans: Not so obscure anymore

Weighted earnings: they don't add up... and you may get burned

Focus on long term planning

Getting there - China Municipal Bond Market

What is VEQTOR?

Leveraged Loans: Not so obscure anymore

Contributor Image
Vishal Arora

Former Director and Global Head, Fixed Income Product Development

S&P Dow Jones Indices

Leveraged loans or Senior Loans once an obscure area in Fixed Income space has seen real growth in assets inflow in last couple of years. Lipper reported a 95 week of net inflows in loan funds that ended in April of this year. What are senior loans and what makes them so attractive in this market.

Senior secured loans: Leveraged Loans or senior loans are on top of a company’s capital structure so they are the first to be repaid before other debt obligations and equity holders.

Higher yields: Most of the debt issued under this category is below investment-grade, thus the securities have higher than comparable investment grade instruments.

Floating rate: Coupon is floating rate, generally pegged to 3 month LIBOR resetting quarterly or on a preset frequency with 0.25 duration, thus the interest rate risk is minimum.

Diversification: Since the instruments are floating rate and get reset as the interest rates rise, it provides a good diversification for a traditional fixed income portfolio.

Recognizing the importance of this asset class, S&P Dow Jones Indices developed the S&P Indices Versus Active (SPIVA) Scorecard dedicated to Senior Loans. SPIVA Scorecard measures the performance of actively managed floating-rate loan funds vs. their benchmark, the S&P/LSTA U.S. Leveraged Loan 100 Index. Here are some of the stats:

  • Active funds fared well over the 12-month period ending Dec. 31, 2013, with the majority of active funds (60%) outperforming the benchmark.
  • However, when viewed over medium- to long-term, three- and five-year horizons, 61.54% and 90.48% of the active loan participation funds underperformed the benchmark, respectively.
  • Over the past five years, the number of loan participation funds has nearly doubled, from 21 to 40, which is a testament to the growing popularity of the asset class.

The posts on this blog are opinions, not advice. Please read our Disclaimers.

Weighted earnings: they don't add up... and you may get burned

Contributor Image
Philip Murphy

Former Managing Director, Global Head of Index Governance

S&P Dow Jones Indices

This post looks at why index earnings are derived by summing earnings of index constituents without first weighting the earnings by index weight (cap-weight or otherwise). While earnings are probably the most widely followed fundamental item, this explanation is applicable to a data point of one’s choice – operating earnings, cash flow, etc. An easy way to understand this kind of fundamental index data is to think of an index, such as the S&P 500, as a hypothetical portfolio.

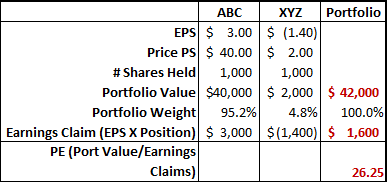
Consider a theoretical example in which we hold 1,000 shares in each of two stocks, ABC and XYZ. ABC is quite profitable, while XYZ is operating at a loss.

 Table A

Despite the fact that 95% of the portfolio is invested in a stock with a PE of 13.3 ($40/$3), the portfolio as a whole has a claim to $1,600 in total earnings. We can’t ignore the losses generated by XYZ simply because we wish to – we hold 1,000 shares and each one is losing $1.40.

Dividing portfolio value by portfolio earnings claims gives a ratio of 26.25 – the price to earnings ratio (PE) of the portfolio. PE, calculated on this basis, has the useful property of indicating how long it takes to “earn” back our investment under current conditions – in this case, 26 ¼ years.

Conversely, if we were to weigh earnings claims by portfolio weights we would get the following:

 Table B

It’s clear to see that one could easily be lead astray by the $2,790 earnings figure, which is the sum of weighted earnings claims. The most significant observation is that the portfolio does not, in fact, hold claim on $2,790 in earnings. This figure exaggerates our legitimate claim of $1,600 by $1,190! Obviously, if one were to calculate a PE ratio on this basis, it would be unrealistically low. Our two-stock example shows that a cumulative dollar, whether earned or lost, is equivalent in the aggregate of a portfolio whether it is derived from a large holding or a small one.

Similarly, index earnings represent the aggregate earnings of all companies in the index, and on this basis the index PE provides valuable information. A high index PE may imply a small, or nonexistent, margin of safety – the central investment concept articulated by Ben Graham, who described it as “the secret of sound investment…” and “always dependent on the price paid…”[1]

For more on the ins and outs of index earnings, see David Blitzer’s post from earlier in the year.

[1] Benjamin Graham, The Intelligent Investor, Revised Ed, pages 512, 517. (New York: HarperCollins, 2003)

The posts on this blog are opinions, not advice. Please read our Disclaimers.

Focus on long term planning

Contributor Image
Anil Ghelani

Business Head & Chief Investment Officer

DSP BlackRock Pension Fund Managers

Many political analysts wrote about coalition politics in India with a deep rooted perception that it is here to stay forever. A stable central government with a single party majority is now a reality!! This has rightly been referred to as the beginning of a new era for India with a significant shift from complicated coalition politics.

During the first few days of living in this new era, I have been interacting with students, business community, CXOs of different industries, young professionals in early years of career and retired elders in the society – the common point of discussion was the election outcome, moving on then to different areas of expectations from the new government under the dynamic leadership of Mr. Narendra Modi.

The excitement, euphoria and now expectations can be seen and felt everywhere. There will be no magic wand which can make changes overnight.

One of the tailwinds for the new government would be India’s current demographic profile and its potential to supplement our transition as a global economic leader. However with increased longevity, the large young workforce of today will live longer and need much more support in the future which could pose some severe socio-economic challenges in the years ahead. India currently does not have a universal social security system similar to some of the developed nations and hence it is important to have a personal long term plan to ensure old-age financial security in the future.

Pension schemes which are structured keeping in mind the retail individual and one of the lowest cost pension products in the world.It starts with a one-time process followed by regular investments with the option of taking a part of the corpus as lump sum amount and the balance in form of monthly income at retirement. It is often said that “Financial Planning in India = Tax Planning” . Some specific pension schemes meet this criteria by offering a special tax deduction for salaried employees over and above the usual deduction for investments of Rs. 100,000, for an amount up to 10% of Basic Salary without any monetary cap.

Monthly contributions ensure discipline of systematic investing. With the auto-choice option, allocation can be made amongst equity, corporate bonds and government bonds dynamically based on age profile.

Overview

Whether it is personal financial planning or strategic navigation of the government, the key is to have a steady focus on achieving long term goals. Making this point about long term focus, Mr. Modi said in his first speech at BJP’s Parliamentary Party meeting after elections that “…when we meet in 2019, I will give you and my countrymen a report card…”. A long term focus may, perhaps, augur well for many when it comes to taking stock of their future financial security.


The posts on this blog are opinions, not advice. Please read our Disclaimers.

Getting there - China Municipal Bond Market

Contributor Image
Michele Leung

Former Director, Fixed Income Indices

S&P Dow Jones Indices

China has recently announced some potential changes in its municipal bond market, which will allow the local governments to sell bond on their own credits, as opposed to the majority of local government bonds that are currently issued by the Ministry of Finance. The coverage is targeted to expand to Beijing, Jiangxi, Ningxie and Qingdao, in addition to the six local governments that were approved in last three years. As highlighted by the author in the article, China Needs Municipal Bond Rethink, raising transparency is definitely the objective to this disclosure-based system. The author also expected more participation from the retail investors in the municipal bond market following the change.

This suggested development in the municipal bond market is perceived as a positive sign, which encourages further growth in the China onshore bond market. It would also help the local governments to meet the financing needs while also to strengthen their debt profile. Echoing an important point raised by the NPC Law Committee member, the local governments’ debt raising should be further regulated so that the process can become more legalized and transparent.

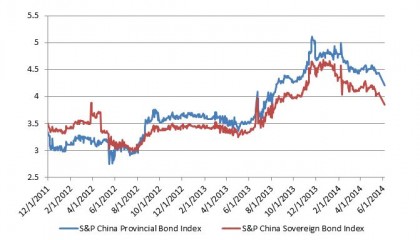
The S&P China Provincial Bond Index measures the performance of the China provincial and municipal bonds; its total return rose 6.84% since is first value date of Nov 20, 2011. The market value tracked by the index is around CNY 118 billion, which is relatively small if you compare with the total China government bond market size of  CNY 15.5 trillion, as tracked by the S&P China Government Bond Index. Noted from the historical yield performance in the chart below, the S&P China Provincial Bond Index traded tighter than S&P China Sovereign Bond Index prior to August 2012, which may implied the yields were artificially compressed as to minimize the financing cost for the municipals. Since then, the S&P China Provincial Bond Index has been trading at an average spread of 25bps wider than the S&P China Sovereign Bond Index.

 Historical Yield Performance (%)

Source: S&P Dow Jones Indices.  Data as of Jun 6, 2014.  Charts are provided for illustrative purposes.  This chart may reflect hypothetical historical performance.  Please see the Performance Disclosures at the end of this document for more information regarding the inherent limitations associated with back-tested performance.  Past performance is no guarantee of future results

Source: S&P Dow Jones Indices. Data as of Jun 6, 2014. Charts are provided for illustrative purposes. This chart may reflect hypothetical historical performance. Please see the Performance Disclosures at the end of this document for more information regarding the inherent limitations associated with back-tested performance. Past performance is no guarantee of future results

The posts on this blog are opinions, not advice. Please read our Disclaimers.

What is VEQTOR?

Contributor Image
Berlinda Liu

Former Director, Multi-Asset Indices

S&P Dow Jones Indices

Recently, we have seen quite a bit of discussion on the S&P VEQTOR Indices. Most of the discussion focuses on its use of VIX futures, complicated allocation process, short back test history, and performance drag. This post is meant to to clarify a couple of the unique characteristics of this index.

Initially it is worth noting that the purpose of this index is to simulate an allocation algorithm that has low correlation with the equity market and provides efficient hedge in black swan events. This is main reason why for a majority of the time, VEQTOR allocates 10% to VIX and generally has a performance drag. The index is not supposed to be an alternative to the S&P 500. I think of it as similar to why I pay for health insurance and adjust my insurance plan every year according to my expectation of next year’s health care expense. As a young professional, more often than not I would have saved money if I simply went uninsured. However, this extra expenditure makes me sleep better. And that’s exactly why some market participants choose to allocate a portion of their assets to VEQTOR, despite its performance drag.

While it is true that VIX spot and futures are related, it is also true that they are quite different. But VIX future’s hedging property is undeniable, especially in black swan events. In a strong bear market, the VIX futures curve tends to flip from contango to backwardation, and the roll process tend to generate extra yield.  Refer to the following two papers for a discussion of VIX spot and futures: “Identifying the Differences Between VIX Spot and Futures” and “Access to Volatility Via Listed Futures.”

VEQTOR acknowledges the roll cost of the VIX futures and attempts to dynamically adjust its allocation between VIX and equity by monitoring market signals. Complicated at the first glace, its allocation process actually only uses two quantitative signals: realized volatility and implied volatility trend. They essentially tell you what has happened and what could happen in the market. The cutoff points (10%, 20%, 35% and 45%) of the realized volatility are driven by the long term performance of the S&P 500. Since the index is designed to address equity market tail risk, we picked the numbers close to the 20th-, 80th-, 95th– and 98th-percentile of monthly realized volatility. To establish the trend of implied volatility, we compared VIX weekly average with its monthly average. A week is roughly 5 trading days (Happy Memorial Day! We work one day less this week!), and a month is roughly 20 trading days. And VEQTOR monitors them for 2 weeks to determine whether the trend is substantial. Why 5? Why 20, not 21 or 22? Why 10? Honestly, a slight change in those numbers (give or take one or two days) would not change the essence of the VEQTOR framework or significantly impact its allocation results.

If you are interested in VEQTOR allocation process, please refer to its methodology and our white paper, “Dynamically Hedging Equity Market Tail Risk Using VEQTOR” from May 2014.


The posts on this blog are opinions, not advice. Please read our Disclaimers.