Get Indexology® Blog updates via email.

In This List

After May Showers, CDS Markets Are Feeling Sunny About Summer

Building the Indian Skyline

The 10-Year Treasury Yield Hits Levels Not Seen Since Last June

Another Double-digit Pay Raise (it's not just executives)

Today’s Economic Indicators not moving the dial on yields.

After May Showers, CDS Markets Are Feeling Sunny About Summer

Contributor Image
Tyler Cling

Senior Manager, Fixed Income Indices

S&P Dow Jones Indices

Over the course of a month when Mother Nature could not decide which season it was in New York City, credit market swap (CDS) market participants as a whole decided credit default insurance was too high. CDS benchmark indices like the S&P/ISDA U.S. 150 Credit Spread Index tightened 4.9%. Every sector spread that compiles the S&P/ISDA 100 CDS Index (-4.9%) was down in May, except for the U.S. S&P/ISDA CDS U.S. Consumer Staples Select 100 Index (up 1.0%). Market indicators suggest that investors believe the relative risk of insuring the underlying credits in nearly every sector has dropped, or that these underlying credits are willing to take on more risk at a lower yield.

tylerchart1

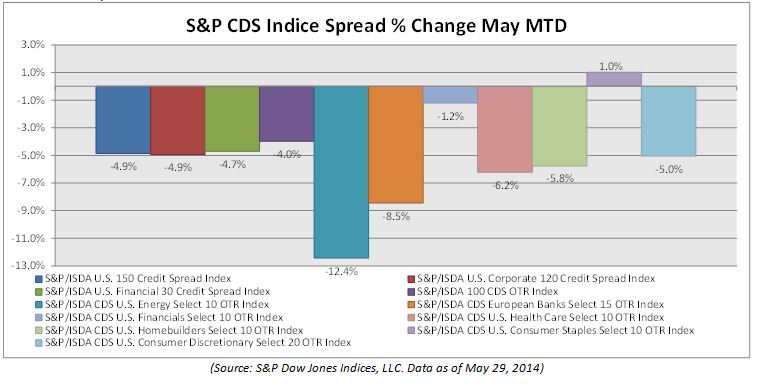
A warmer outlook and a sunny forecast often come hand in hand, however it is important to remember they are independent events. The S&P/ISDA CDS U.S. Energy Select 10 which saw the biggest drop in spreads this month, is still trading above 140 basis points (bps) on notional credit (i.e. default protection on a loan of $1 million would cost $14,000). Last week, I commented on the dichotomy of trends within the sectors the market views as riskier, as determined by default spreads.

tylerchart2

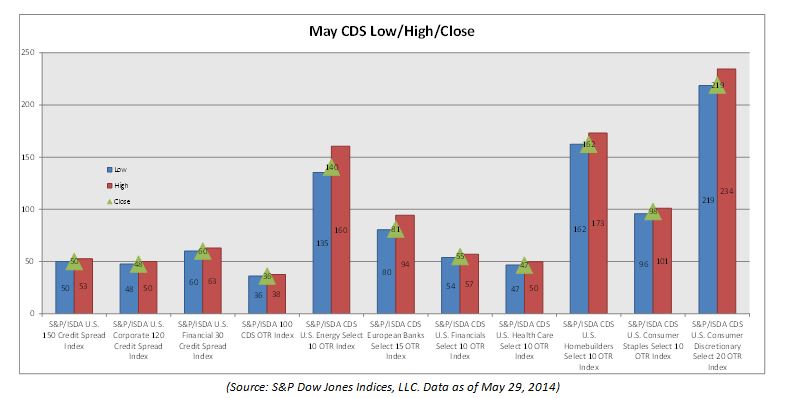
The S&P/ISDA CDS U.S. Homebuilders Select 10 Index (-9.92 bps) and S&P/ISDA CDS U.S. Consumer Discretionary Select 20 Index (-11.64 bps) sectors, tightened in May, yet continue to be priced as premium risk sectors against their cheaper peers. The health care and European banks sectors saw greater relative spread declines, at -3.09 bps and -7.5 bps, respectively; S&P/ISDA CDS U.S. Health Care Select 10 OTR Index & S&P/ISDA CDS European Banks Select 15 Index. They are trading significantly cheaper than the homebuilders and consumer discretionary sectors.

To summarize, CDS markets show that market participants are feeling warmer about the idea that underlying assets won’t default across the board than in May, but are keeping a coat nearby for certain sectors

The posts on this blog are opinions, not advice. Please read our Disclaimers.

Building the Indian Skyline

Contributor Image
Utkarsh Agrawal

Associate Director, Global Research & Design

S&P Dow Jones Indices

Since the global recession in 2008, India has been witnessing a slower real growth. Despite being a labor surplus country, India lacks adequate infrastructure to sustain the growth of labor-intensive industries which provide employment to the unskilled to semi-skilled workforce. The Global Competitiveness Index published by World Economic Forum placed India on the 3rd position for the Market size and on the 85th position for the Infrastructure in its Global Competitiveness Report 2013-2014. It also mentioned that the most problematic factor for doing business among others is the inadequate supply of infrastructure.

The development of infrastructure in a growing economy like India is very important to increase and maintain the sustainable growth rate in its real GDP which was approximately 4.35% in 2013 according to the World Economic Outlook Database April, 2014 published by the International Monetary Fund. Though investment in infrastructure as a percentage of GDP has been increasing over the years, the actual investment for the 10th plan was 5.15% of GDP and the projection for the 11th plan was 7.55% of GDP. It has been projected to be 9.95% of GDP for the 12th plan.

In the coming years, development of infrastructure should be a priority. Traditionally major share in the infrastructure development was contributed by the public sector. More and more participation of the private sector under the Public-Private Partnership is desirable to satisfy the growing needs.

The S&P BSE Infrastructure Index is an effort to measure the progress of the listed infrastructure in India. It has a targeted count of 30 stocks. The index aims to create a diversified exposure with five distinct clusters: Utilities, Energy, Transportation, Telecommunications and the Non-Banking Financial Institutions which are categorized by the Reserve Bank of India (RBI) as an ‘Infrastructure Finance Company’ or derive major business revenue from Infrastructure Finance. The clusters are based on a combination of GICS sectors. It has given an annualized return of 5.11% as on April 30, 2014 since April 28, 2006.

Disclaimer: This data is provided for illustrative purposes. Past performance does not guarantee future results.

The posts on this blog are opinions, not advice. Please read our Disclaimers.

The 10-Year Treasury Yield Hits Levels Not Seen Since Last June

Contributor Image
Kevin Horan

Former Director, Fixed Income Indices

S&P Dow Jones Indices

The last time the yield of the S&P/BGCantor Current 10 Year U.S. Treasury Bond Index was in the neighborhood of 2.4% was back in June 2013. The days of a 1% handle on rates are behind us, but the current lower rates harken back before this year. The beginning of 2014 saw yields as high as 3%. Back then, the market worried over issues such as the start and speed of Fed tapering, discussions of the timing of a rate increase, and an improving jobless claims number.  Jobless claims were at 7% and the Fed was targeting 6.5%. Yields did come lower as a crisis in Ukraine erupted and a flight to safety trade resulted. Though it first appeared to pit the superpowers of Russia and the U.S. against each other, the Ukraine crisis has been downgraded to somewhat of a skirmish as varying counties has taken diplomatic approaches to dealing with the crisis.

Some focus has always been on the speed and timing of an economic recovery. Economic releases had been slow to indicate the speed of the recovery though recent numbers have shown a growing strength in their measures. The improving economic picture was knocked for a loop when a surprise rise in Germany’s unemployment to 24,000 from the expected 15,000 became cause for concern. Such a number before the June 5 European Central Bank interest rate announcement led investors to question economic strength and the possibility of an additional rate cut in Europe.

Since then, global sovereign bonds have moved down in yield. The S&P/BGCantor Current 10 Year U.S. Treasury Bond Index closed 7 basis points lower on the day of the Germany release (May 28). The change in pace of the expected global recovery has caused traders to cover shorts put on in expectation of higher rates, thus moving price higher and yields lower. Also, benchmark investors’ have been purchasing bonds to match their index’s duration extension for the May month-end rebalancing. Though reduced from prior levels, the Fed still purchases treasury bonds and mortgage bonds as part of the ongoing stimulus.

S&P/BGCantor Current 10 Year U.S. Treasury Bond Index- Yield-to-Worst


The posts on this blog are opinions, not advice. Please read our Disclaimers.

Another Double-digit Pay Raise (it's not just executives)

Contributor Image
Howard Silverblatt

Senior Index Analyst, Product Management

S&P Dow Jones Indices

S&P 500 DIVIDENDS ON TRACK FOR DOUBLE-DIGIT INCREASE IN CASH PAYMENTS IN 2014: PAID 5 MO MAY,’14 + CURRENT DECLARED RATE FOR THE NEXT 7 MO = 10.5% INCREASE OVER 2013

Absent quick dividend cuts, it would appear we are past the point of not posting a double-digit gain in actual cash dividends payments for the S&P 500 (although I would never underestimate the ability of congress).

IF there are no changes in the S&P 500 membership, weights or dividend rates for the rest of the year (not going to happen), using the actual declared payments, and the current dividend rate of the issues over the next seven months would result in a double-digit gain in the actual cash dividend payments for 2014. Since I look at dividends as a paycheck, how many of you can claim a back-to-back double digit annual increase in your pay, with both years setting a new high?

Based on the paid and declared rates to date, 353 issues in the S&P will pay more in cash dividends in 2014 than in 2013 (again, they could cut).

There are now 421 issues paying a cash dividend in the S&P 500, the most since 423 in September 1998 (S&P 500 closed Sep,’98 at 1017).
(it was 473 when I started at S&P in 1977, when Berkshire Hathaway broke $100 – yes the one that now sells for $191,415 and last paid a dividend in 1962 of $0.10)

The posts on this blog are opinions, not advice. Please read our Disclaimers.

Today’s Economic Indicators not moving the dial on yields.

Contributor Image
Kevin Horan

Former Director, Fixed Income Indices

S&P Dow Jones Indices

The yield on the S&P/BGCantor Current 10 Year U.S. Treasury Index since its step down on May 13th as a result of Retail Sales has remained in a range of 2.48% to 2.58%.  There are a number of economic releases scheduled to follow the U.S. Memorial Day Holiday.  Today’s reporting of Durable Goods Orders (0.8% versus -0.7% expected), Consumer Confidence (83 as expected), Richmond (7 vs. 8 exp.) and Dallas (8 vs. 9.5 exp.) Fed Manufacturing, along with the S&P/Case-Shiller Home Price Indices has not moved the dial on yields as the 10-year is within the range at a 2.52%.

The rest of the week contains MBA Mortgage Applications (0.9% prior), GDP (-0.5% exp.), Initial Jobless Claims (317k, exp.), Personal Spending (0.2% exp.) and Chicago Purchasing Managers (61 exp.) coupled with the University of Michigan Confidence numbers (82.5 exp.) on Friday.  All releases have the possibility to potentially move the benchmark Treasury yield.

In addition to the economic releases, the U.S. Treasury will be auctioning both fixed and floating rate coupon 2-years, along with 5-year and 7-year notes.  News centering on the auctions and how the market receives the total issuance of $108 billion can be a factor.

The next reopening of the 30-year TIPS is scheduled for a June 19th auction and can’t come soon enough.  Investor demand has increased, as seen by the performance of the S&P U.S. TIPS Index which has returned 4.84% year-to-date.  As the Fed continues its promise to keep short rate low, the risk that inflation could increase in the long term will have investors paying closer attention to upcoming CPI releases.

Last week the S&P U.S. Preferred Stock Index (TR) topped out at a year-to-date return of 9.87% before coming off the high and closing the week having returned 9.61%.  The downward days of the 21st to the 23rd for preferreds coincided with an upward movement of 1.5% in total return for the S&P 500.  Month-to-date the preferred index is returning 0.63%.

Activity in the new issue investment grade market continued its fast pace as household names such as Amgen, Credit Suisse, Deutsche Bank, Kimberly-Clark and Time Warner came to market.  A number of the fixed rate deals should find their way into the S&P U.S. Issued Investment Grade Corporate Bond Index.  The index has returned 0.85% month-to-date and 4.96% on the year.

The S&P U.S. Issued High Yield Corporate Bond Index and the S&P/LSTA U.S. Leveraged Loan 100 Index on the month continued to perform in lockstep as both indices have returned 0.63%.  The S&P/LSTA U.S. Leveraged Loan 100 Index is yielding 4.27% in comparison the 4.98% yield of high yield, but the leverage loan index is a much shorter instrument as it rebalances weekly in comparison to the 4 year duration of high yield.  Leverage loan’s market issuance slowed as arrangers focused on deals in the works rather than new issue business ahead of the U.S. Memorial Day Holiday.  On the other hand, High Yield’s primary market issuance was highly active as issuers rushed to lock in low rates before the long holiday weekend.  24 Hour Fitness, Cimarex Energy, CSC Holdings, DriveTime Automotive, Empresas ICA., Energy Transfer Equity, Inmarsat Finance, Live Nation Entertainment, Post Holdings, RBS, Rosetta Resources, Sanmina Corporation, Scientific Games International, Telecom Italia, and TransDigm Inc. are a number of the high yield names that came to market this week.  Year-to-date the S&P U.S. Issued High Yield Corporate Bond Index has returned 4.31%.

Source: S&P Dow Jones Indices, Data as of 5/23/2014, Leveraged Loan data as of 5/26/2014.


The posts on this blog are opinions, not advice. Please read our Disclaimers.