We’re all familiar with that old adage. The theory says that trading slows during the summer months, markets can be a bit more turbulent and you’re better off closing out your positions, getting to the beach and enjoying your Pimm’s Cup in relative peace.
But as my colleague Craig Lazzara pointed in his recent post, investors that bailed out this May would’ve missed a decent July. Further, we know that the adage isn’t an absolute. Historically, it may be true that the 6 months from May to October underperform those from November to April, but that doesn’t mean there is no absolute performance to be gleaned. Our cousin colleague Sam Stovall, chief equity strategist at S&P Capital IQ, says when stocks start the year off strongly there are often gains to be had during summer vacation (from his report “Sell in May and go…where?”, April 22, 2103). And this year clearly did have a strong start, with the DJIA up 19.95% YTD through July.
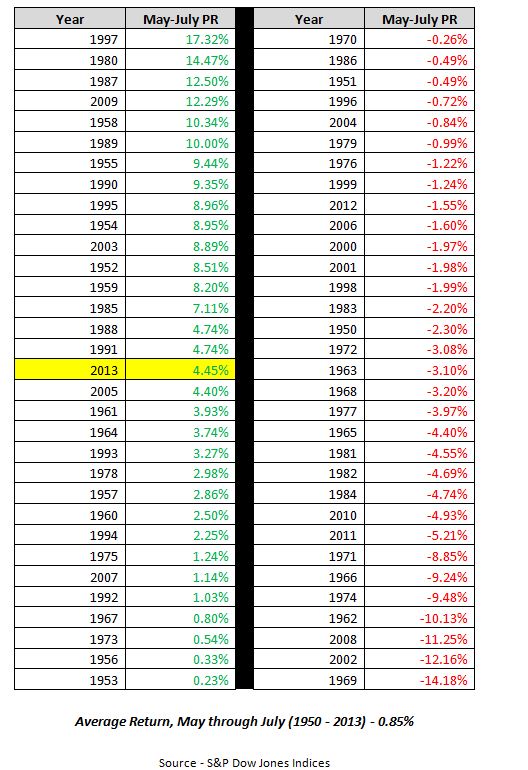
So, how has this period performed in recent decades? To compare this year to years past, we looked at the average price return of the Dow Jones Industrial Average from May to July. This year’s performance of 4.45% compares very favorably to the average of .85% from 1950 to 2013 and is the best May to July period since 2003 when the DJIA was up 8.89%. Over those 64 years, the split of positive vs. negative periods is exactly 50/50 – positive periods average a 5.98% gain and the negative average a 4.28% loss.
As always, investors are best served by not accepting the conventional wisdom at face value.