Get Indexology® Blog updates via email.

In This List

CPI Rises in May: How much inflation protection have commodities provided?

S&P GSCI Precious Metals Hits Lowest Since October 2010

Fed Meeting Report due tomorrow, Hints Bernanke will step down in January 2014

Indices Rebalance Friday

Show Me The Money (again)

CPI Rises in May: How much inflation protection have commodities provided?

Contributor Image
Jodie Gunzberg

Former Managing Director, Head of U.S. Equities

S&P Dow Jones Indices

After two months of deflation, headline CPI (Consumer Price Index) gained 0.1% in May, marking its second positive reading in at least the past seven months. Over the past 12 months, CPI inflation is up 1.4%, accelerating from April’s 1.1% reading. http://www.bls.gov/news.release/cpi.nr0.htm

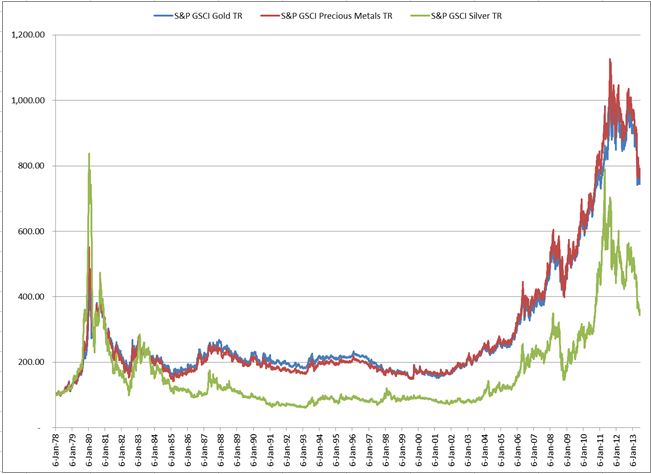
Historically, commodities as an asset class have had positive correlation to inflation. In the past 10 years, using yoy% (year-over-year) monthly return data from 1/2003-12/2012, the DJ-UBS CI has had correlation of 0.64 to CPI yoy Index and the S&P GSCI has had correlation of 0.74 to CPI yoy Index. This is because commodity indices reflect our changing expectation of future prices by including futures contracts as constituents. Further, since food and energy are major components of the CPI and are among the most volatile of inflation, they are the key drivers of the indices.

CPI vs Commodity Indices

HOW MUCH INFLATION PROTECTION HAVE COMMODITIES PROVIDED?

Commodity index investments may provide a levered response to inflation.  In other words, one dollar of commodities may hedge more than one dollar of the portfolio from inflation. This concept is called inflation beta. Historically from 1992-2012 for every 1% increase in CPI, the S&P GSCI has had a 16.0% increase and the DJ-UBS CI has had a 10.2% increase. (It is like stock beta, where if stock XXX increased 2% if for every 1% increase S&P 500, then the beta would be 2.)

Inflation Beta

Last, please click here to watch a special video on commodities and inflation from our Index Matters Series with Bob Greer of PIMCO and Boris Shrayer from Morgan Stanley. 

The posts on this blog are opinions, not advice. Please read our Disclaimers.

S&P GSCI Precious Metals Hits Lowest Since October 2010

Contributor Image
Jodie Gunzberg

Former Managing Director, Head of U.S. Equities

S&P Dow Jones Indices

On April 15, 2013 the S&P GSCI Precious Metals dropped 9.6% in one day, entering a bear market from the 2013 high occurring on January 23Since then, the index has fallen further to hit its lowest level of 1733.52 since October 1, 2010 when it was at 1717.53.  The precious metals index is down 20.1% YTD, and is off  21.3% from its 2013 peak of 2202.41.

Uncertainty ahead of the Federal Reserve meeting may be causing gold investors to fear whether the Fed will signal the end or a reduction to the quantitative easing.

The S&P GSCI Precious Metals Hits the Lowest Since Oct 1, 2010 Source: S&P Dow Jones Indices. Daily data from 1/6/78 - 6/18/12. Charts and graphs are provided for illustrative purposes only.  Indices are unmanaged statistical composites and their returns do not include payment of any sales charges or fees an investor would pay to purchase the securities the index represents.  Such costs would lower performance.  It is not possible to invest directly in an index.  Past performance is not an indication of future results. The inception date for the S&P GSCI was May 1, 1991, at the market close.  All information presented prior to the index inception date is back-tested.  Source: S&P Dow Jones Indices. Daily data from 1/6/78 – 6/18/12. Charts and graphs are provided for illustrative purposes only. Indices are unmanaged statistical composites and their returns do not include payment of any sales charges or fees an investor would pay to purchase the securities the index represents. Such costs would lower performance. It is not possible to invest directly in an index. Past performance is not an indication of future results. The inception date for the S&P GSCI was May 1, 1991, at the market close. All information presented prior to the index inception date is back-tested.


The posts on this blog are opinions, not advice. Please read our Disclaimers.

Fed Meeting Report due tomorrow, Hints Bernanke will step down in January 2014

Contributor Image
David Blitzer

Former Managing Director and Chairman of the Index Committee

S&P Dow Jones Indices

The Federal Open Market Committee — the Fed’s policy making unit — meets today and tomorrow.  Recent reports show the economy expanding, but not accelerating. Housing starts and consumer prices both slightly weaker than expected in today’s reports.  Given this and recent misplaced fears that the Fed was about to end QE3, most analysts look for little change in Fed policy combined with some comments meant to end worries about a quick end to current policy.

Separately, President Obama made remarks in an interview reported by Bloomberg and by the Wall Street Journal suggesting that Fed Chairman Bernanke will step down at the end of his current term in January 2014.  Almost every economist who has served in the Obama administration or worked at the Fed in the last few years is being mentioned as a replacement — in other words, no one knows who might be chosen. However, given the current soft economic recovery and Bernanke’s success at the Fed, a new Fed chairperson is not likely to make a dramatic shift in policy.


The posts on this blog are opinions, not advice. Please read our Disclaimers.

Indices Rebalance Friday

Contributor Image
David Blitzer

Former Managing Director and Chairman of the Index Committee

S&P Dow Jones Indices

Index funds could experience slightly more trading than usual on Friday.  Company’s shares outstanding change from time to time due to buy-backs, issuance for employee options or other events. The percentage of shares in float — not closely held — also change from time to time.  In theory S&P Dow Jones could update data on the number of shares outstanding for companies in its indices daily; but most of these changes are small and dealing with numerous tiny changes would be costly for index fund managers.  As a result, changes of less than 5% of the number of shares outstanding are done once a quarter on the third Friday of the last month of the quarter — next Friday, June 21st.  This is the same day that futures and options contracts expire, so there is plenty of liquidity in the market.  These are all small adjustments since large share changes related to mergers are done when the merger closes.  Aside from slightly more trading than typical for Friday in summer, there isn’t likely to be any impact. The indices affected include the S&P 500, S&P MidCap 400 and the S&P Small Cap 600, among others. The Dow Jones Industrial Average is price-weighted: stock prices, but not share outstanding, matter for the calculation so there is no rebalance for the Dow.

The posts on this blog are opinions, not advice. Please read our Disclaimers.

Show Me The Money (again)

Contributor Image
Howard Silverblatt

Senior Index Analyst, Product Management

S&P Dow Jones Indices


Cash has set another record – now there is something new, they’ve set new record high in 18 of the past 20 quarters (got cash)

The posts on this blog are opinions, not advice. Please read our Disclaimers.