Categories
Equities S&P 500 & DJIA Strategy Uncategorized

The Road Less Traveled

It is a truth universally acknowledged that liquidity is critical to market health; typically when liquidity falls, volatility rises.  The Financial Times recently cited claims that the increased use of passive investment vehicles had caused trading volumes in individual S&P 500 constituents to decline.  Should we be alarmed?

In reality, the notion that single-stock traders only add liquidity, while passive vehicles only diminish it, is wrong.  There are a great many active users of “passive” products, and any market-wide conclusions about liquidity require analysis not only of single stocks, but also of the ETFs and futures that track them.  A wider perspective is required because the volume of trading in ETFs, futures, and other index-based exchange-traded products is substantial.  Our research shows that there was an equivalent of around $127 trillion traded in products tracking the S&P 500 over the 12 months ending June 2019, while the implied average holding period across all S&P DJI index-linked exchanged traded products included in the report was 11 days.

To offer just one example that might broaden our perspective, consider how volumes in sector and industry-based products have grown over the past few years.  The assets, open interest, and trading volume in futures and ETFs tracking S&P DJI’s U.S. based sector and industry products has more than doubled.
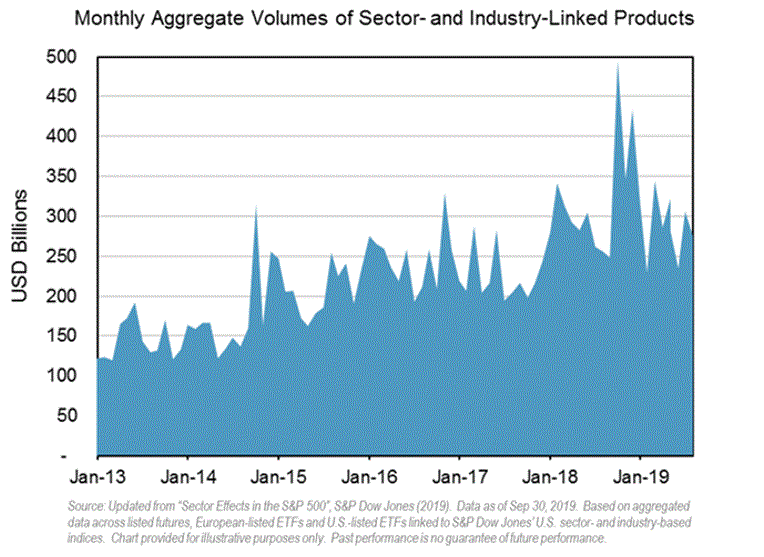
In part, this may be a simple reflection of the recently increasing importance of sectoral drivers to stocks in the S&P 500.   At any rate, sectors have a long-term importance to stock returns.  Around half of all the daily variations in S&P 500 single stock returns over the past 15 years may be attributed to risks shared with their sectoral peers.
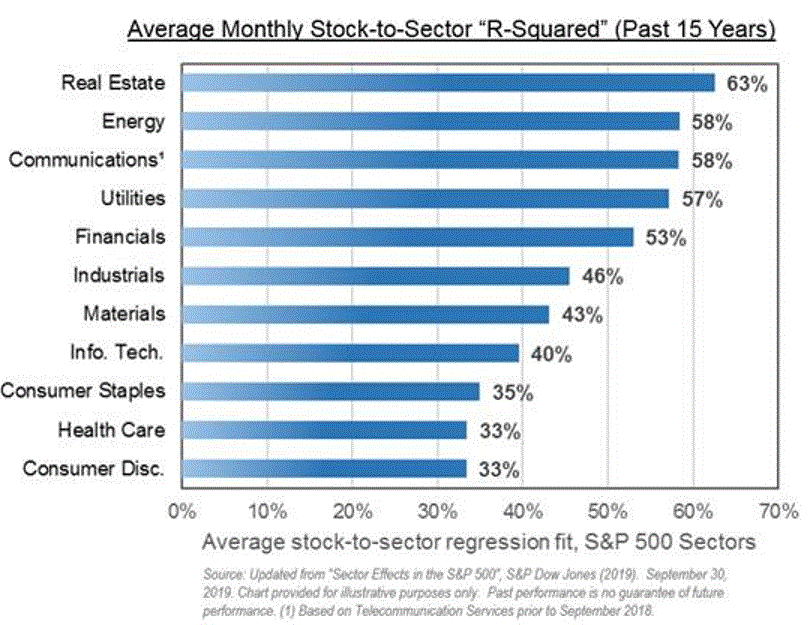
Because of their current liquidity and importance to returns, sector products can be, and often are, used to make active bets in place of individual stocks.  Individual stock volumes tell only part of the story, as investors may be choosing to use different vehicles to express their views.   An active manager who over- or under-weights a sector makes no less a contribution to price discovery and market efficiency than a manager who over- or under-weights the sector’s components.    Individual securities may currently be the road less traveled, but markets can arrive at accurate valuations from a different road.
Categories
Commodities

WTI Reclaims No.1 Spot As The Benchmark Oil In 2016

S&P Dow Jones Indices today announced the composition and weights for the 2016 S&P GSCI and Dow Jones Commodity Index. The two indices have the same constituents by definition but the weighting methodologies are different. The DJCI is equally weighted with 1/3 of its weight to each sector – energy, metals, and agriculture and livestock, then the constituents inside are liquidity weighted by the 5-year average of the total dollar value traded. The more interesting weighting of the two flagships happens in the world-production weight of the S&P GSCI. This is because the world production is a reflection of the relative significance of each of the constituent commodities to the world economy.

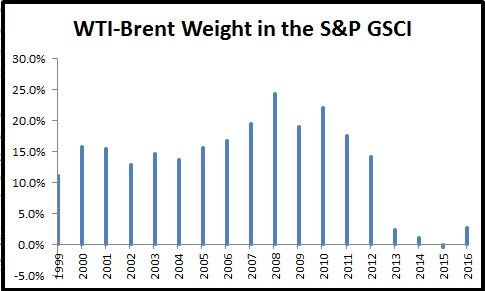
2015 was a historically significant year for oil in indexing since it was the first time Brent overtook WTI as the biggest commodity in the S&P GSCI since Brent Crude was added in 1999. Please see the graph below for the historical weight difference between WTI Crude Oil and Brent Crude in the S&P GSCI:

Source: S&P Dow Jones Indices. All weights prior to 2015 are actual index weights after the rebalance that may differ from the target weights due to price fluctuations.

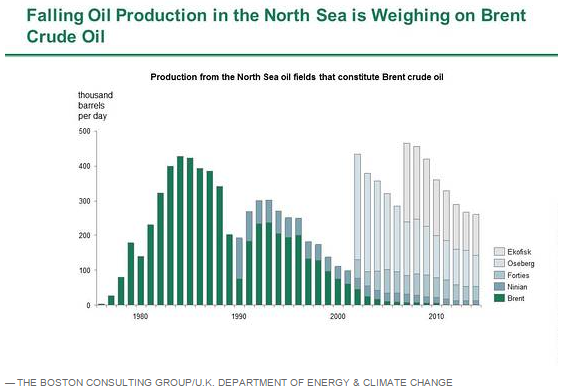
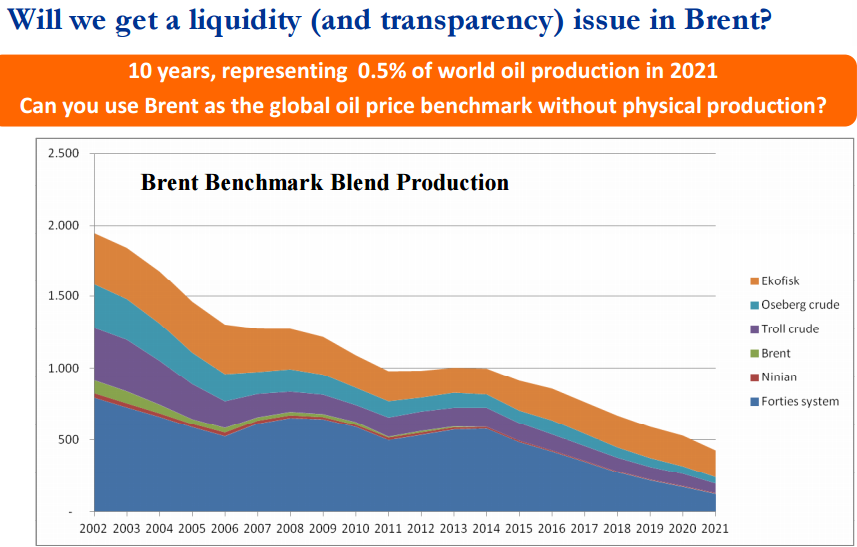
Notice the Brent significantly caught up to WTI in 2013, but now WTI is set to outweigh Brent in 2016 by even more than in 2013, putting into question Brent’s ability to hold as a real oil benchmark. Although the brent field only produces about 1,000 of 94 million barrels per day, volumes of the contract have more than doubled since 2009 to more than a million contracts per day. It is this volume (in addition to price) that catapulted brent to compete with WTI as the global heavyweight in the S&P GSCI. The index uses a world production for the entire petroleum component (WTI, Brent, Gasoil, heating Oil and Unleaded Gasoline) then adjusts the individual constituents by a 12 month average of total dollar value traded based on price and volume from the current year’s August through the prior year’s September. Based on this, the index is now reflecting what the rest of the world already suspects – that is brent is drying up too quickly to remain a global oil benchmark. For example, below is a chart from our commodity conference in 2012 questioning the viability of Brent.

Source: Wood Mackenzie, Aug 2012. Presented at S&P Dow Jones Commodity Conference. Sept, 2012. Jan-Hein Jesse, JOSCO Energy Finance & Strategy Consultancy.

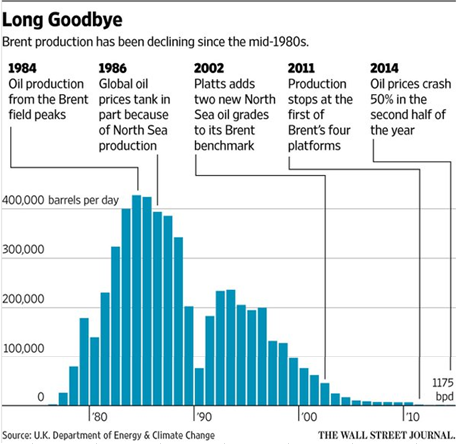
A bigger question for benchmark pricing and index weight is how the composition of the brent contract may change to stay competitive. The brent field’s output used to be 100% of the brent contract but is now only at 0.1%. Please see the chart below of the decline from a WSJ blog:

BCG Falling Brent

Further, the WSJ reports in this article that changes may need to happen sooner rather than later by adding oil into the benchmark from West Africa, Central Asia or possibly from Brazil. This is because the there is a huge market based on the benchmark pricing where businesses, such as refineries, price the crude they process into gasoline and diesel, influencing prices at the pump. It has a great potential impact.

Brent decline WSJ

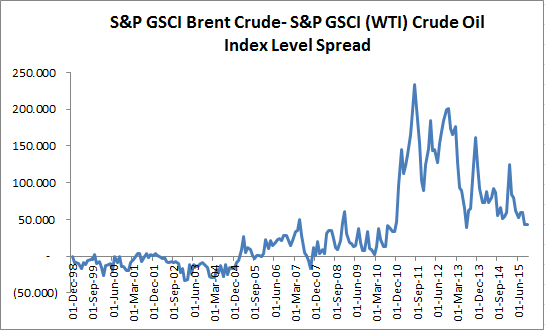
Finally, notice how the spread of WTI to Brent has narrowed. It is hard to argue there is an unfair value. Even if production is rising, the relative volume decline of brent to WTI is the prevailing force of brent’s futility.

Source: S&P Dow Jones Indices