Value investing, made famous by Benjamin Graham in his book Intelligent Investor nearly 70 years ago, is possibly the most well-known investment strategy. Although the strategy may appear simple at first glance—buying securities with prices that are trading at discount multiples than their fundamental values—it can be tricky to implement. For example, value can be captured via different metrics including, but not limited to, book-to-price ratio, earnings yield, dividend yield, and cash flow-to-price ratio.[1] Market participants must decide which value metrics closely align with their investment view. In addition, returns from value strategies can differ meaningfully, depending on the stock selection process and portfolio construction.
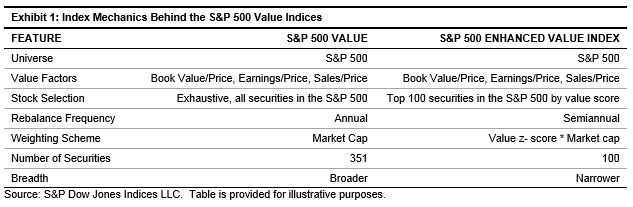
We can highlight the last point using two value indices formed from the same underlying domestic large-cap universe, the S&P 500 Value and S&P 500 Enhanced Value Index. The index mechanics of both indices are outlined in Exhibit 1. Also important to note is the weighting mechanism employed by the two indices. The S&P 500 Value simply weights securities by market cap, whereas the selection process and the weighting scheme of the S&P 500 Enhanced Value Index assigns higher weights to those securities with bigger value attributes.
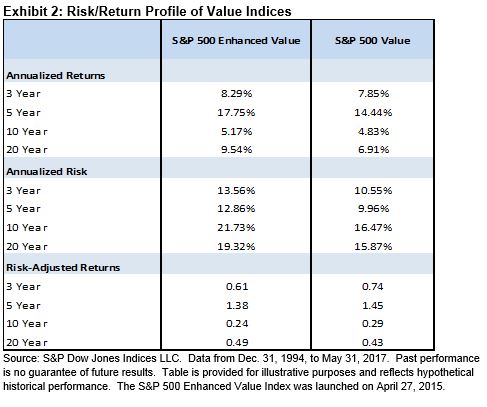
Since the metrics used to capture value premium are identical for both indices, our analysis evaluates the impact of security selection and weighting mechanism. In Exhibit 2, we show the annualized risk/return profiles of the two value strategies since Dec. 31, 1994. In this period, the S&P 500 Enhanced Value Index delivered higher returns but with higher volatility than its broader, market-cap-weighted counterpart.
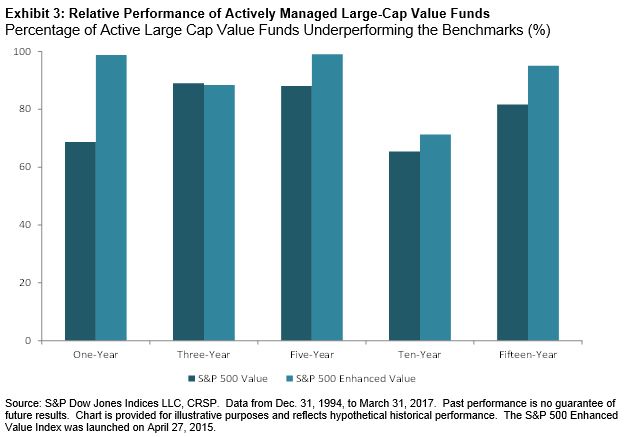
Based on the index construction and the risk/return profiles, we can conclude that the two value indices serve different purposes for the investment community. The S&P 500 Value can be viewed as a broad-based value benchmark, representing an entire opportunity set and returns of value style investing. On the other hand, the S&P 500 Enhanced Value Index is more representative of a high conviction, more concentrated value strategy. In that light, it is worthwhile to compare the returns of the value indices to those of actively managed large-cap value managers. Exhibit 3 compares the returns of actively managed large-cap value mutual funds to the two value indices.[1]
Across all measurement horizons, more than half of the active large-cap value funds have trailed the two value indices. It comes as no surprise that the percentage of active value funds underperforming the S&P 500 Enhanced Value Index tends to exceed those underperforming the broad-based S&P 500 Value across all time periods,[2] given that the former has outperformed the latter across all measurement periods.
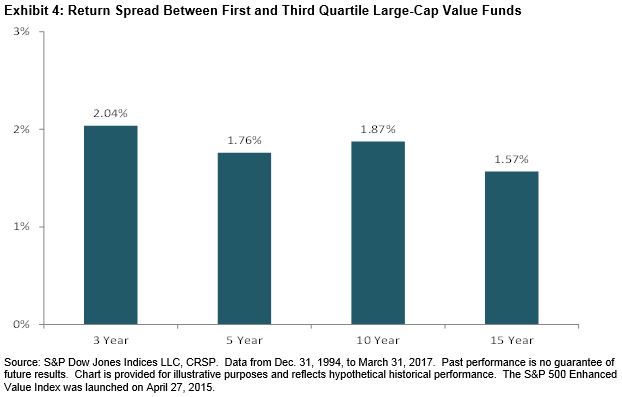
Exhibit 4 highlights the return dispersion among large-cap value managers from year-end 1994 through May 2017. Returns among active value strategies vary quite meaningfully, reflecting the differences in managers’ approaches to value definition, stock selection, and portfolio construction. For example, the return spread per year on an annualized basis over the 15-year period amounted to 1.57%.
Value investing, although considered a timeless investment strategy, may not be as straightforward as it seems. Market participants aiming to implement the strategy should carefully consider the metrics used to capture the factor, constituent selection process, and strategy construction.
[1] We use the Center for Research and Security Prices (CSRP) mutual fund database as the underlying data source for actively managed large-cap value managers’ returns.
[2] The three-year figure is the only exception but the difference in the percentage of managers underperforming the benchmark amounts to only 0.63%.
[1] Depending on the type of metrics used, value portfolios can potentially have different performance.
The posts on this blog are opinions, not advice. Please read our Disclaimers.