Get Indexology® Blog updates via email.

In This List

The Next Phase of Volatility Control in Indexed Insurance

Digging Deeper: 20 Years of the S&P Metals & Mining Select Industry Index

Measuring USD Leveraged Loans for the Brazilian Market

Ballots and Benchmarks: How Elections Shake Markets around the World

How and Why Institutions Are Evolving Their ETF Usage

The Next Phase of Volatility Control in Indexed Insurance

Contributor Image
Yuan Tian

Executive Director, Multi-Asset Indices

S&P Dow Jones Indices

Volatility-controlled indices (VCIs) have become a cornerstone of indexed insurance product design, helping insurers navigate volatility while maintaining exposure to growth assets. S&P Dow Jones Indices recently published the paper Indexed Insurance: Embracing Volatility-Controlled Indices in Next-Generation Products, in which we explore the growth in popularity of VCIs, their performance across market environments and their evolution. The paper also examines how volatility-control strategies have adapted to support the growing indexed insurance market and the changing needs of modern market participants. Recent market performance demonstrates how quickly risks can emerge and evolve in today’s environment—highlighting the important role that VCIs may play in turbulent markets, as well as the inherent tradeoffs such strategies represent.

2025 and 2026 saw markets characterized by periods of heightened uncertainty, sharp market selloffs and rapid rebounds—all of which created a challenging backdrop for VCIs. Compared with broad equity benchmarks, VCIs generally helped mitigate drawdowns during periods of market stress, although their volatility-management frameworks also resulted in more muted participation during subsequent recoveries.
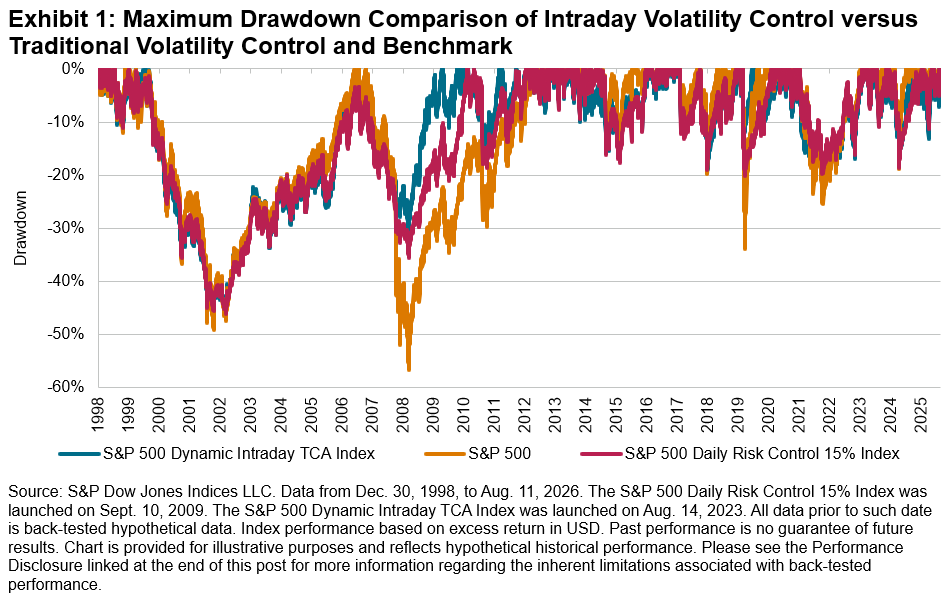
However, evaluating VCIs solely through the lens of short-term relative performance may not capture their broader role within indexed insurance products. Due to the nature of indexed insurance products, characteristics like rolling returns and rolling volatility may better reflect the potential value of VCIs as complements to benchmark indices in these products. As seen in Exhibit 2, both the S&P 500® Daily Risk Control 15% Index and S&P 500 Dynamic Intraday TCA Index exhibited a narrower range of rolling one-year performance than the S&P 500, illustrating how a volatility-control mechanism may smooth the experience across different market environments.
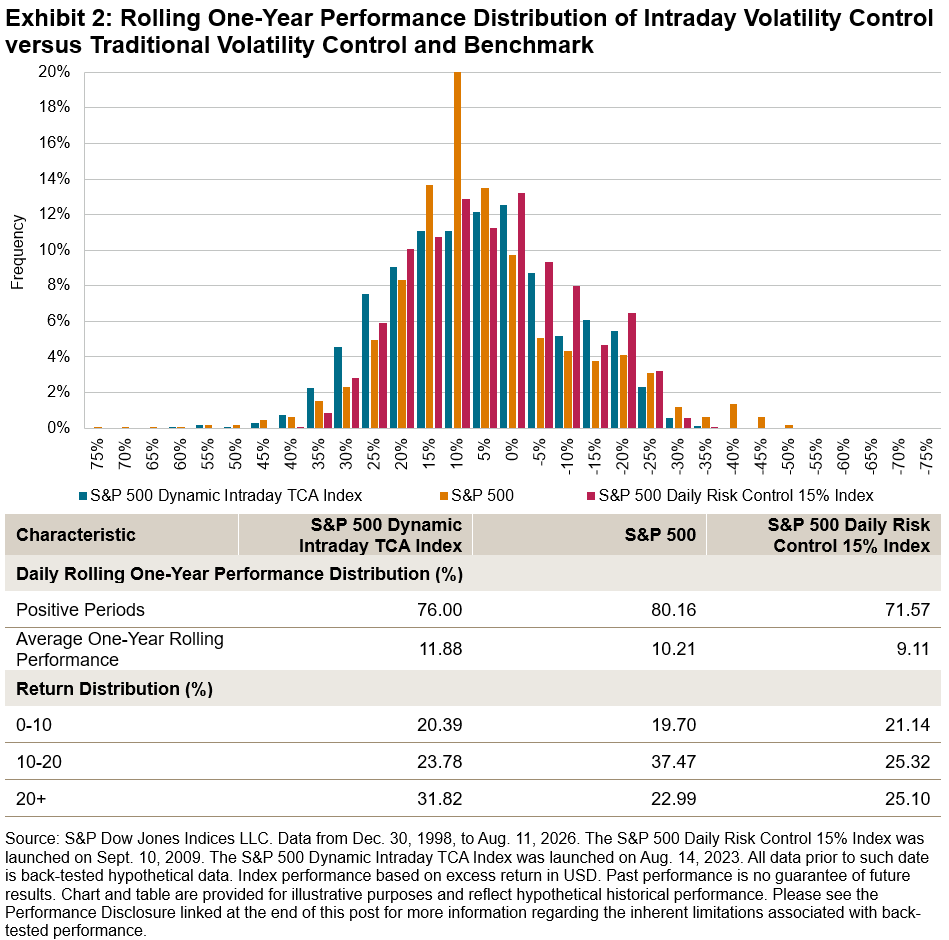
A narrower distribution of rolling one-year performance suggests that the risk-control mechanisms may help reduce extreme outcomes and mitigate fat-tail risk, resulting in a more balanced performance distribution while preserving exposure to long-term equity growth. In particular, the S&P 500 Dynamic Intraday TCA Index was able to achieve higher rolling one-year performance than the S&P 500 and the traditional volatility control index.
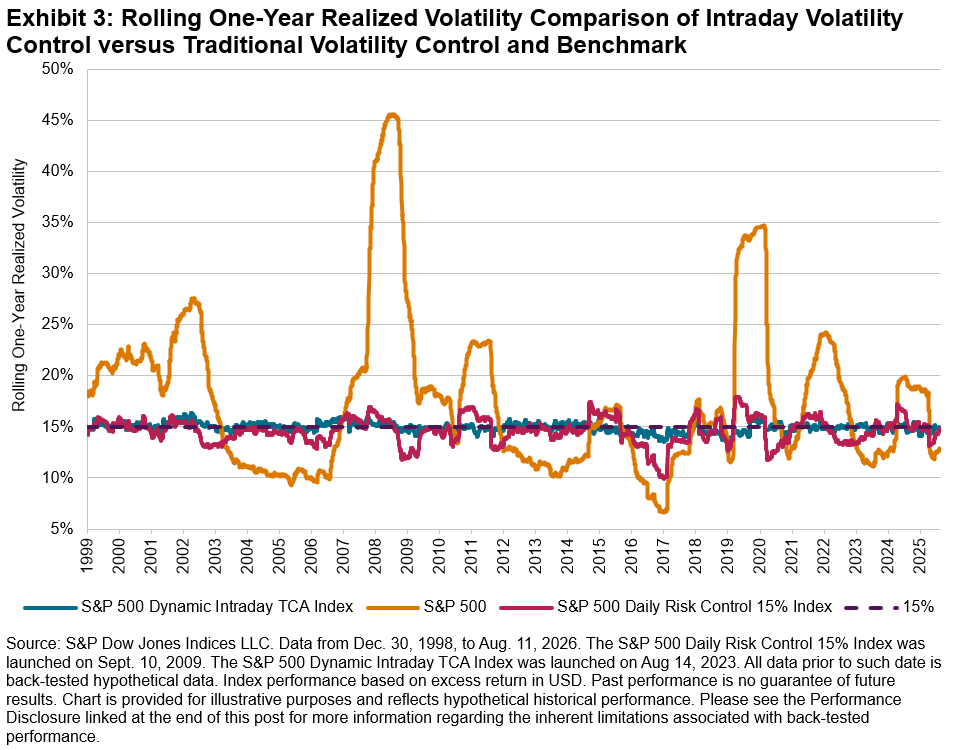
While rolling performance highlights outcome consistency, realized volatility provides a direct measure of risk management effectiveness. As shown in Exhibit 3, both volatility-controlled indices generally maintained lower realized volatility than the S&P 500. The dynamic intraday approach further reduced realized volatility than traditional daily risk-control methods, highlighting the evolution of volatility-control technology.

VCIs can reflect the trade-off between downside protection and upside participation, but their characteristics extend beyond raw index performance. Recent market conditions have reinforced that VCIs are generally not designed to outperform in every environment. Rather, they seek to provide a more stable risk profile.

The posts on this blog are opinions, not advice. Please read our Disclaimers.

Digging Deeper: 20 Years of the S&P Metals & Mining Select Industry Index

Contributor Image
Amit Pathak

Head of U.S. Equity Product Management Asia-Pacific

S&P Dow Jones Indices

From artificial intelligence and electrification to infrastructure spending and geopolitical competition for critical minerals, metals and mining companies sit at the center of some of the most important themes of this decade. The S&P Metals & Mining Select Industry Index tracks the performance of the companies that discover, extract and process the materials powering the global economy.

The S&P Metals & Mining Select Industry Index offers a focused view of the U.S. metals and mining sector. The index selects eligible companies from across various GICS® sub-industries, including Aluminum, Copper, Gold, Silver, Steel, Coal & Consumable Fuels and Diversified Metals & Mining. Constituents must be members of the S&P Total Market Index and meet minimum liquidity and market capitalization requirements.1

The index rebalances quarterly, with eligible constituents being initially equally weighted, with modifications made to ensure that for a given theoretical portfolio value, each constituent’s index weight cannot exceed 4.5% of the float market capitalization and the value that can be traded in three days.

Evolution of the Index

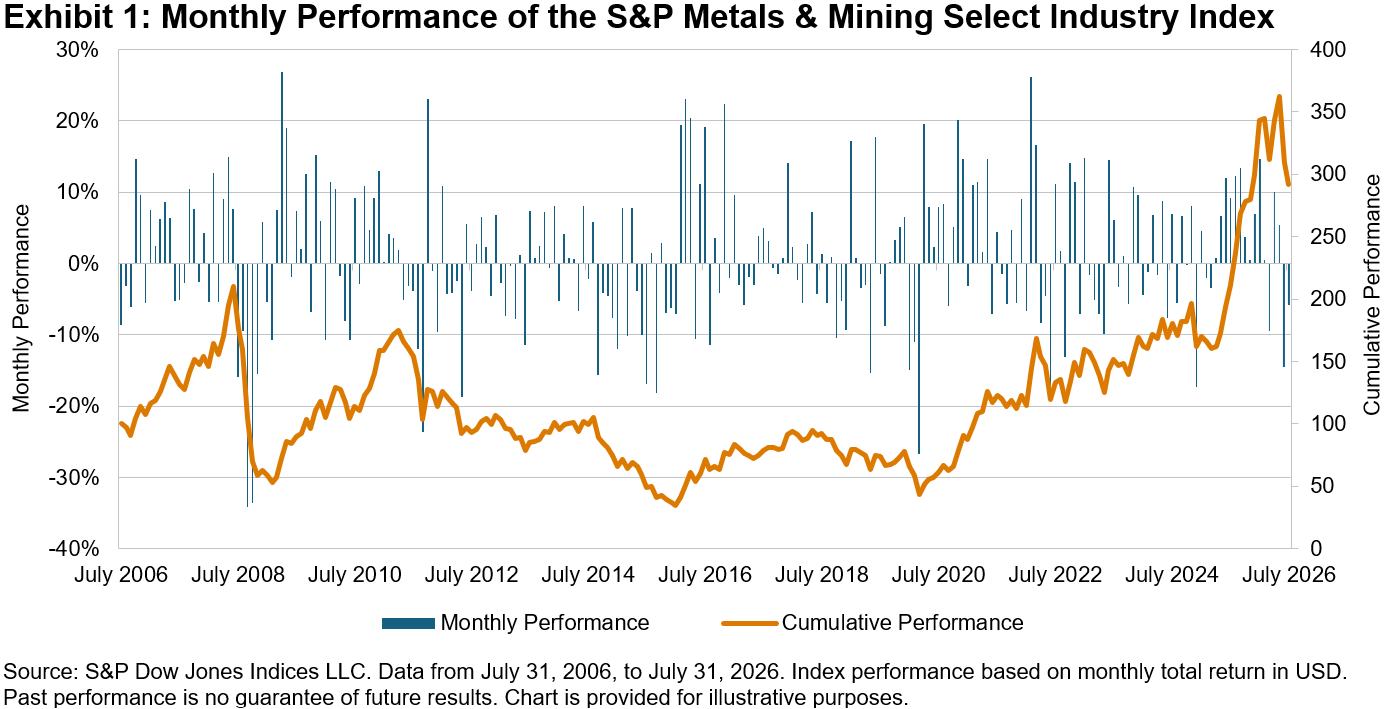
Launched on June 19, 2006, the S&P Metals & Mining Select Industry Index recently marked its 20th anniversary. Exhibit 1 shows the index’s monthly and cumulative performance over the past two decades. During this period, the index delivered an average monthly gain of 0.95%, with a positive monthly performance in 52.9% of observations.

The S&P Metals & Mining Select Industry Index’s composition has changed considerably over time, reflecting both market trends and methodology updates.2

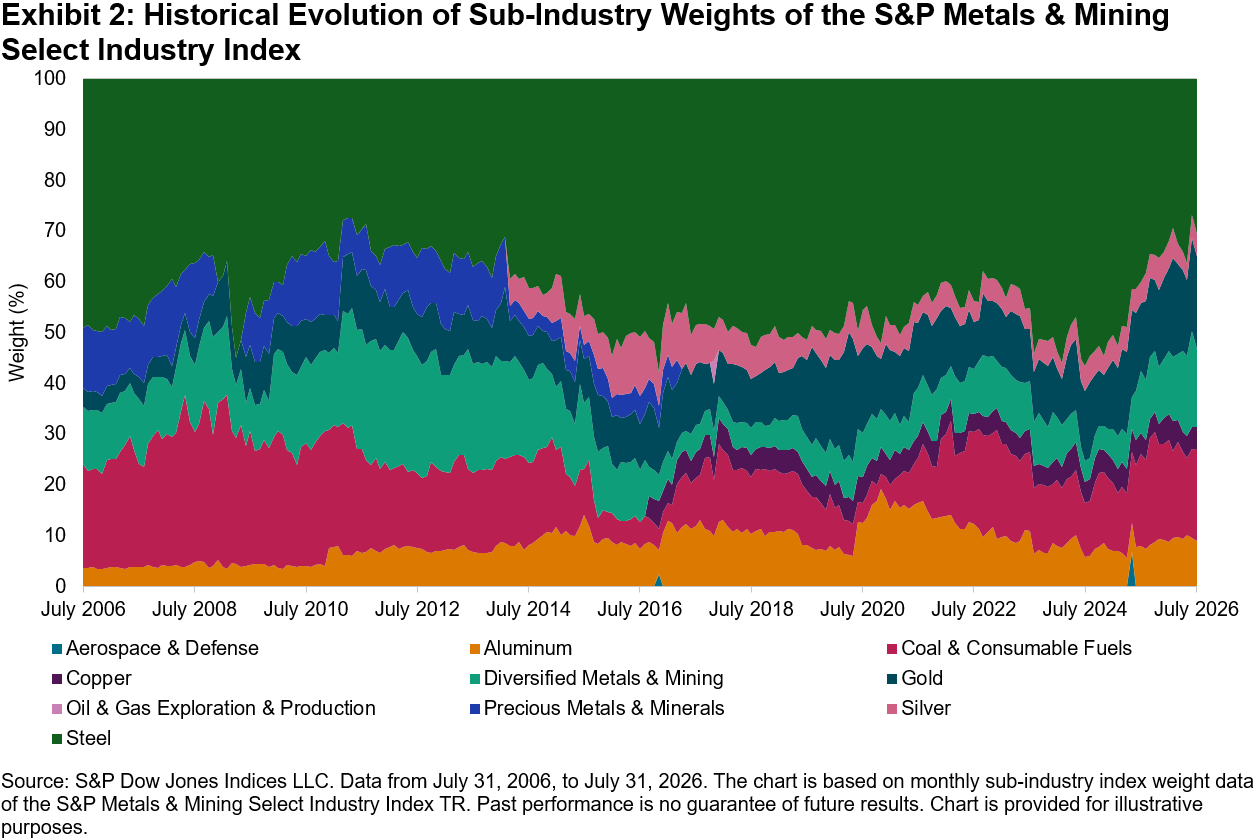
As seen in Exhibit 2, since its launch in July 2006, the index has evolved away from being a steel-heavy benchmark—Steel accounted for 49% of the index at launch, followed by Coal & Consumable Fuels at 20% and Diversified Metals & Mining and Precious Metals & Minerals at about 11%-12% each. The weight of Coal & Consumable Fuels grew significantly during the late 2000s, exceeding 30% at its peak, while the creation of the Copper sub-industry under the Metals & Mining industry resulted in the addition of Copper in 2016,3 further broadening the index’s industry representation. By July 2026, the index was more balanced, with Steel (31%), Coal & Consumable Fuels (18%), Precious Metals & Minerals (18%), Diversified Metals & Mining (15%), Aluminum (9%) and Copper (5%) all representing meaningful weights, reflecting a much broader cross-section of the U.S. metals and mining industry than at launch.

Effect of Participation across Sub-Industries and Capping on Performance

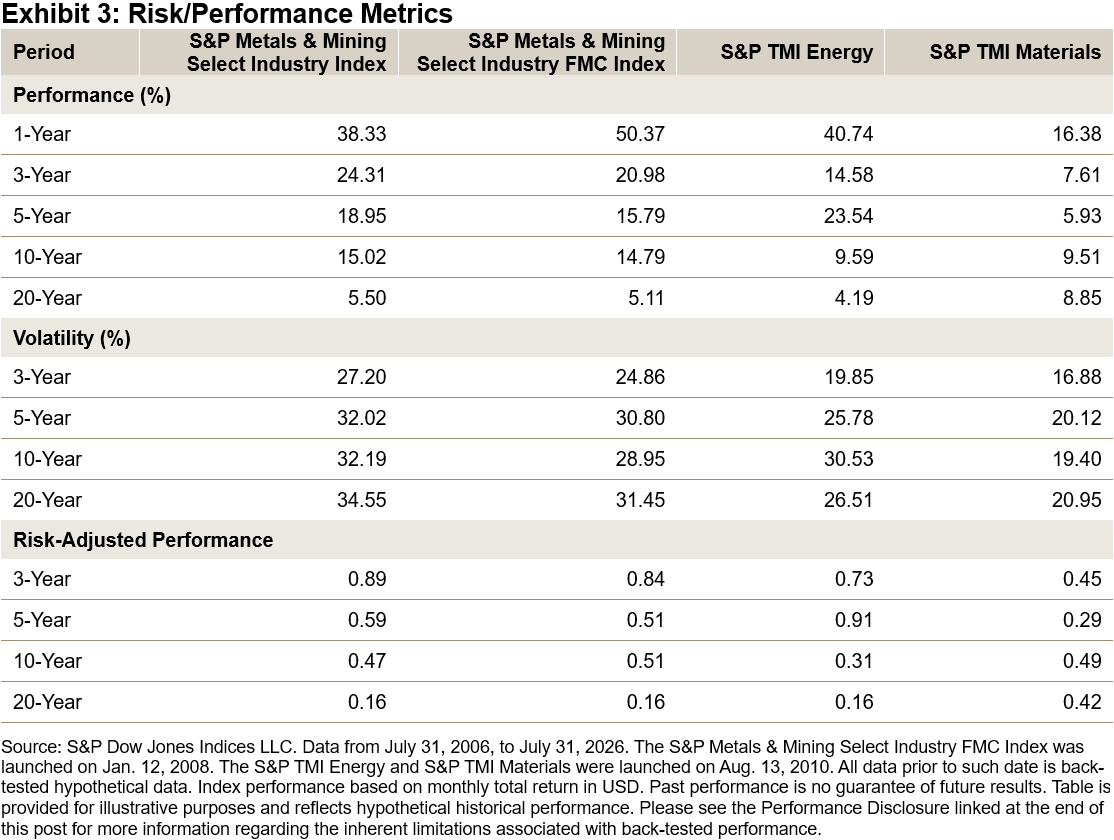
Exhibit 3 shows the effects of having a more targeted focus on U.S. Metals & Mining companies: the S&P Metals & Mining Select Industry Index typically posted higher risk-adjusted performance than the broader S&P Total Market Index (TMI) Energy and S&P TMI Materials sector indices. Additionally, the S&P Metals & Mining Select Industry Index typically posted higher risk-adjusted performance than its float market cap (FMC) weighted counterpart, highlighting the potential benefit of the index’s modified equal weight approach.

Conclusion

The S&P Metals & Mining Select Industry Index has evolved alongside the U.S. metals and mining industry, broadening from a structure once dominated by steel and coal producers to a more diversified mix that includes copper, aluminum, precious metals and diversified mining companies. The index’s historical (risk-adjusted) performance demonstrates the effects of a more targeted focus on U.S. metals and mining companies and incorporating a modified equal weight approach.

1 For more information, please see the S&P Select Industry Indices Methodology.

2 Essential Metal Awakening – Indexology® Blog | S&P Dow Jones Indices

Beyond the Bullion: Market Trends in Global Gold Production – Indexology Blog | S&P Dow Jones Indices

The Race for Critical Materials and the Shift to Security – Indexology Blog | S&P Dow Jones Indices

3 S&P Dow Jones Indices And MSCI Announce Further Revisions To The Global Industry Classification Standard (GICS) Structure In 2016 – Nov. 2, 2015


The posts on this blog are opinions, not advice. Please read our Disclaimers.
Measuring USD Leveraged Loans for the Brazilian Market

Contributor Image
Adrian Roseth

Analyst, Fixed Income Product Management

S&P Dow Jones Indices

The author would like to thank Sofia Lozada for her contributions to this blog.

Introduction: The Challenge

Brazilian institutional investors are increasingly looking beyond domestic markets in search of income. With local yields subject to monetary policy cycles and a concentrated domestic credit universe, global fixed income could offer diversification. Instruments with different risk drivers, such as USD-denominated senior secured loans, could complement a BRL-based fixed income view.

Yet investing abroad introduces a structural challenge: currency risk. For Brazilian market participants, USD-BRL movements can have as much influence on performance as the underlying asset itself. The question is how to reflect the yield characteristics of USD leveraged loans while managing that currency risk.

Why U.S. Leveraged Loans?

U.S. leveraged loans offer floating-rate coupons that reset with short-term U.S. rates, providing income and buffering against duration risk in a way that fixed-rate bonds do not.

Leveraged loans are senior secured instruments, sitting at the top of the borrower’s capital structure and backed by collateral. This gives lenders a priority claim in a restructuring or default scenario—a structurally defensive way to access credit spreads.

The U.S. leveraged loan market is large, liquid and well-established, and it is not replicated in Brazil’s domestic credit universe. Compared with the Brazilian fixed income market, this asset class provides diversification characteristics through different borrowers, different rate dynamics and a source of USD-denominated yield. The S&P USD Select Leveraged Loan BRL Hedge Carry Index measures the performance of the U.S. leveraged loan market through a currency-hedged framework, combining loan weighting with a built-in BRL hedge and BRL cash carry.

Why Currency Matters for Brazilian Investors

For a Brazilian strategy focused on USD-denominated leveraged loans, three forces drive performance: credit performance, coupon income and the USD-BRL exchange rate. Even when underlying loans perform well, currency moves can reshape the outcome once performance is converted back to BRL, making a systematic hedge a more targeted way to reflect the performance of the asset class.

Understanding the Index Construction

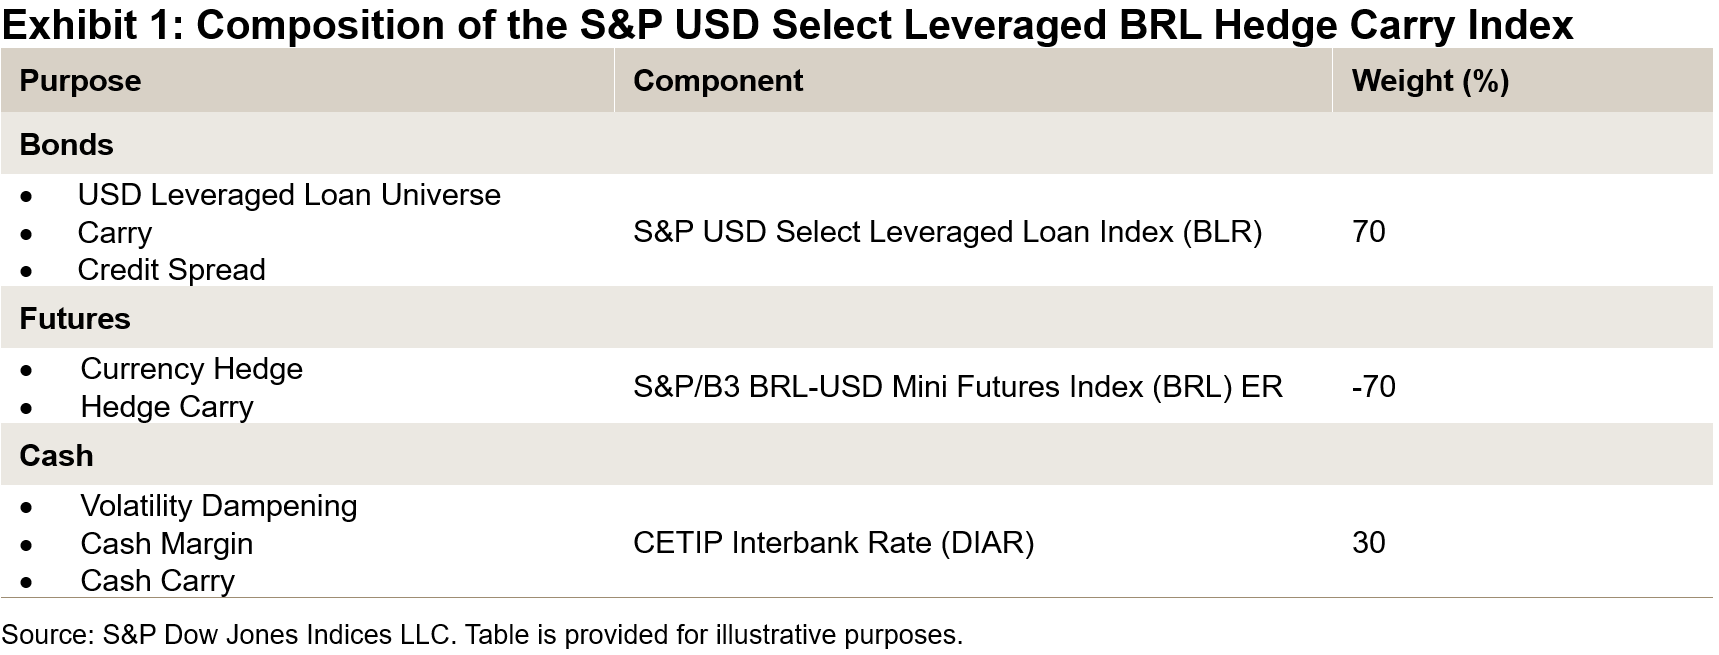
The S&P USD Select Leveraged Loan BRL Hedge Carry Index is built from three components. First, a 70% weight to the S&P USD Select Leveraged Loan Index (BRL) as the underlying benchmark for the U.S. leveraged loan market. Second, a 30% weight in the CETIP Interbank Rate (DIAR) provides a measure of BRL cash carry and serves as collateral support for the futures position. Third, a -70% short position in the S&P/B3 BRL-USD Mini Futures Index (BRL) ER forms the systematic currency hedge.

The hedge is intended to offset the USD-BRL currency risk embedded in the loan weighting. Rather than leaving performance subject to U.S. dollar movements, the short futures position seeks to reduce that unintended risk—with performance in Brazilian real terms reflecting the credit performance and yield of the underlying loans.

The index also incorporates a cash buffer mechanism to cover potential margin calls from the B3 exchange. A rebalance is triggered whenever the cash weight falls below 10% of the index weight, aiming to maintain sufficient liquidity for the futures position at all times. For more information, see the S&P Multi-Asset Indices Methodology.

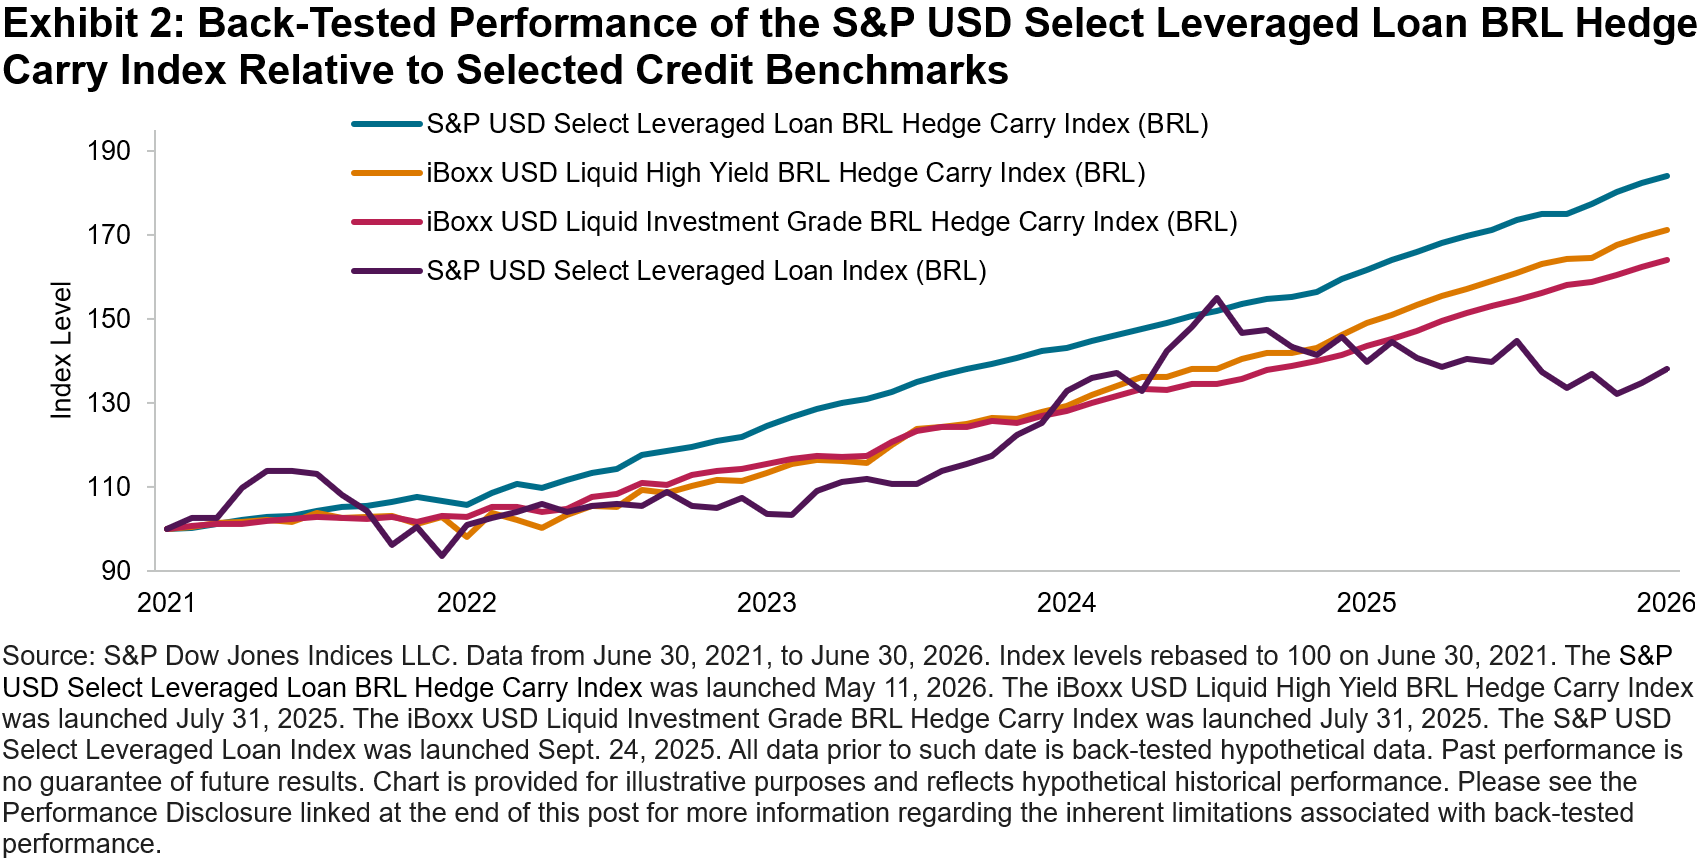
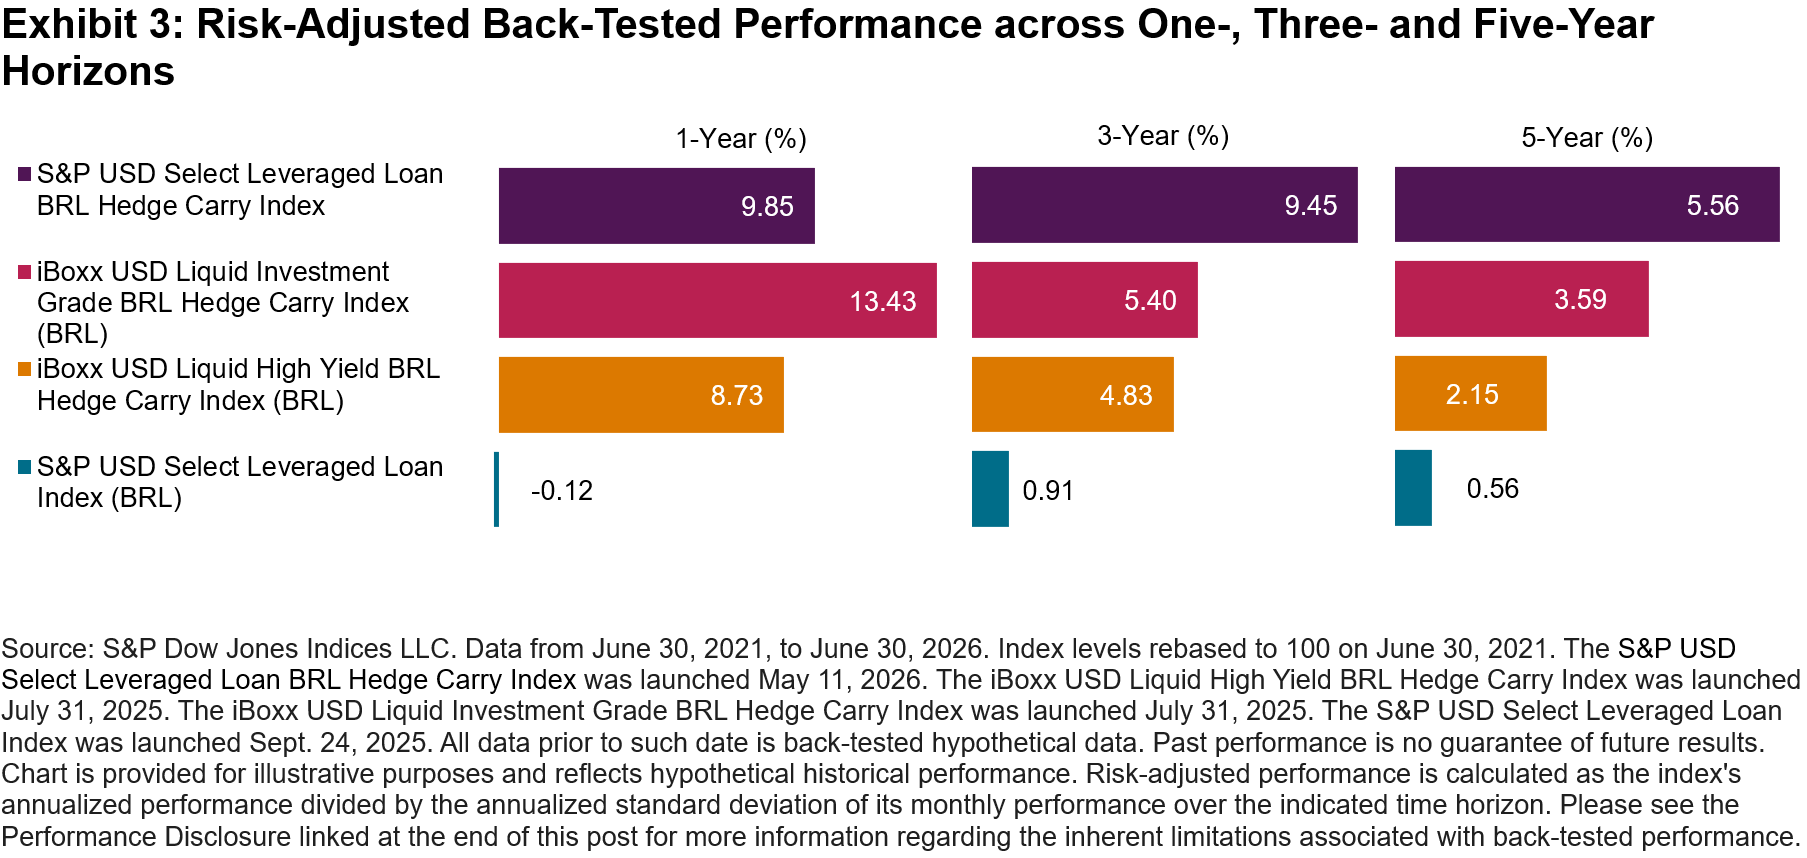
Comparing the S&P USD Select Leveraged Loan BRL Hedge Carry Index with its investment grade and high yield counterparts (the iBoxx USD Liquid Investment Grade BRL Hedge Carry Index and the iBoxx USD Liquid High Yield BRL Hedge Carry Index, respectively), illustrates how different U.S. credit segments have performed within a BRL-hedged framework. As shown in Exhibits 2 and 3, the back-tested analysis indicates that the leveraged loan strategy reported higher cumulative performance than the investment grade and high yield indices over the past five years, as well as higher risk-adjusted performance across the three- and five-year horizons. Over five years, the S&P USD Select Leveraged Loan BRL Hedge Carry Index gained 12.98% on an annualized basis with 2.34% annualized volatility, compared with 11.36% and 5.28% for the high yield index, and 10.43% and 2.90% for the investment grade index, respectively.

The comparison with the unhedged S&P USD Select Leveraged Loan Index (BRL) is equally notable: over five years, the S&P USD Select Leveraged Loan Index (BRL) gained an annualized 6.67% with 11.89% annualized volatility. The one-year comparison further illustrates this observation—the S&P USD Select Leveraged Loan BRL Hedge Carry Index gained 13.80%, while the S&P USD Select Leveraged Loan Index (BRL) posted -1.24%, as appreciation of the Brazilian real weighed on U.S. dollar-denominated performance.

S&P Dow Jones Indices brings extensive experience in index design, transparency and rules-based methodologies to this fixed income space. The S&P USD Select Leveraged Loan BRL Hedge Carry Index reflects S&P DJI’s ability to combine established market benchmarks—the S&P USD Select Leveraged Loan Index and the S&P/B3 BRL-USD Mini Futures Index—into a single index solution. This cross-market index innovation provides a transparent and replicable framework that may be used for benchmarking purposes or as the basis for index-linked products.

The posts on this blog are opinions, not advice. Please read our Disclaimers.
Ballots and Benchmarks: How Elections Shake Markets around the World

Contributor Image
Lucas Hyman

Quantitative Analyst, Index Investment Strategy

S&P Dow Jones Indices

Every election season brings a familiar ritual: wall-to-wall media coverage, confident predictions and no shortage of opinions about what a given outcome will mean for markets. But does the noise translate into measurably significant market movement? And if it does, does it matter equally everywhere?

To find out, we examined equity index performance around election dates across seven countries, spanning a selection of developed and emerging markets—and what we found challenges some common assumptions. Market reactions to elections are far from uniform, and not always as extreme as pundits predict.

How We Measured Election Effects

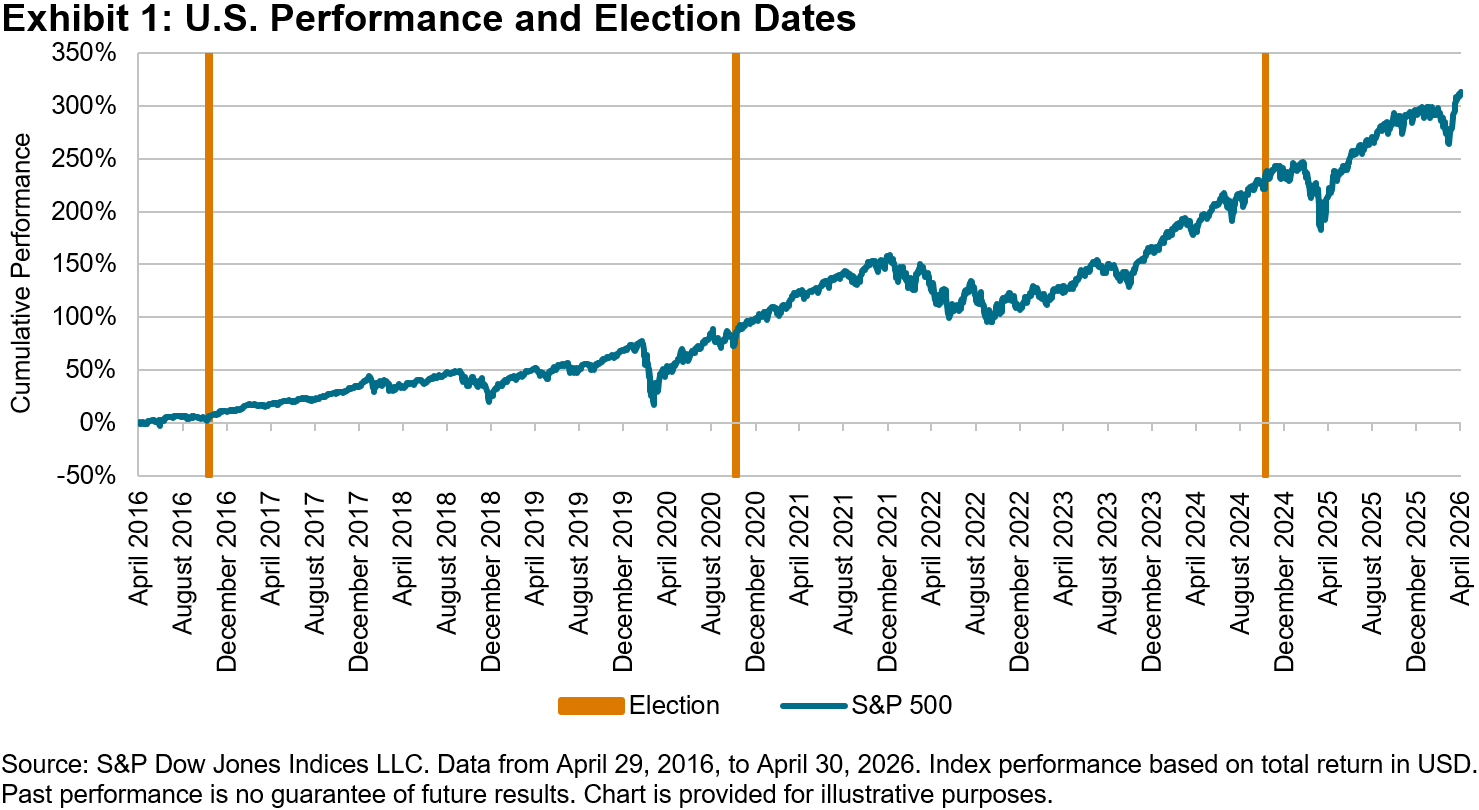
We analyzed performance of local benchmarks in the U.S. (S&P 500®), Mexico, Brazil, Chile, Japan, the U.K. and Germany (single-country indices from the S&P Global BMI) from April 2016 to April 2026. All indices are expressed in their local currencies.

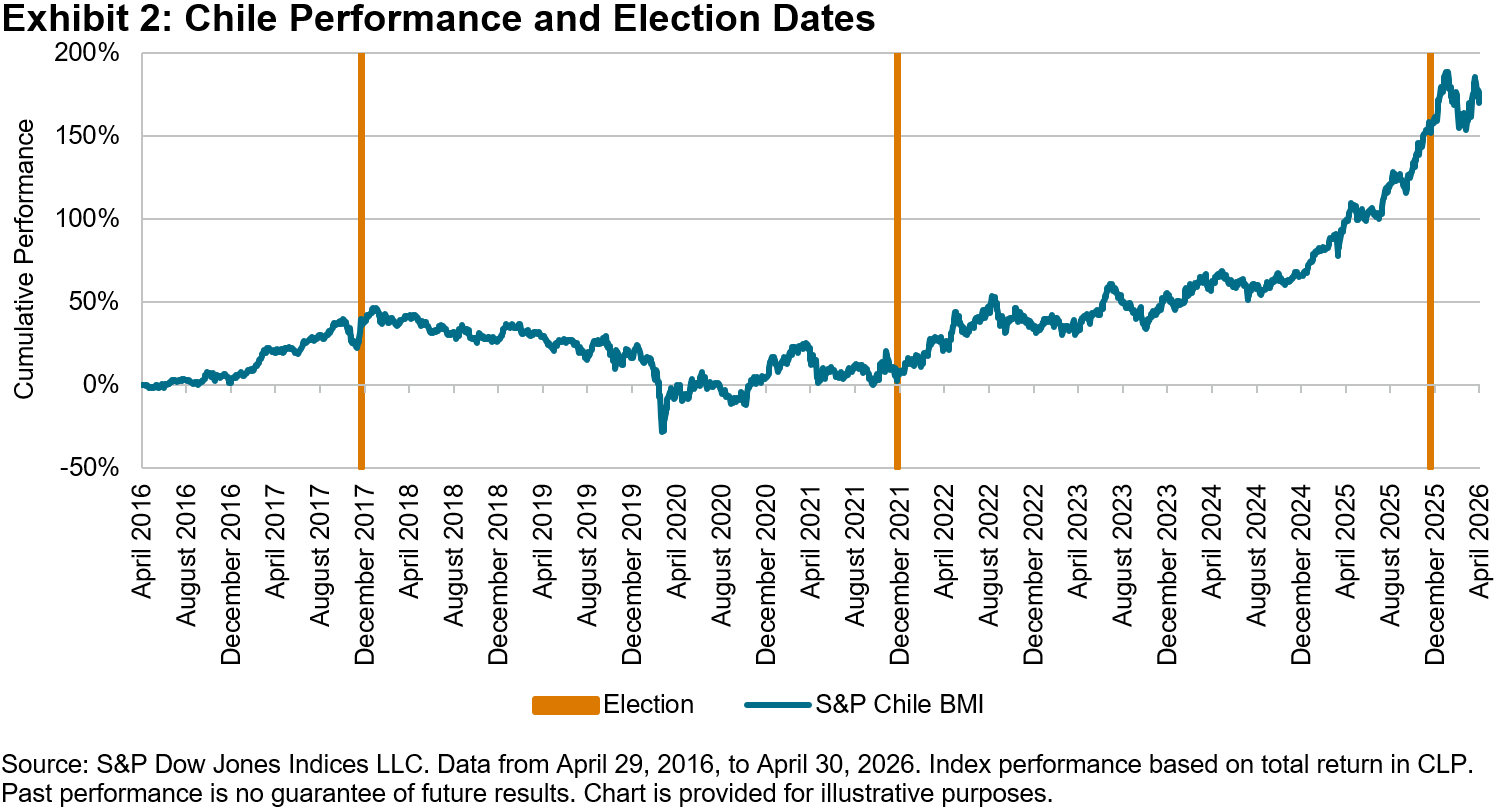
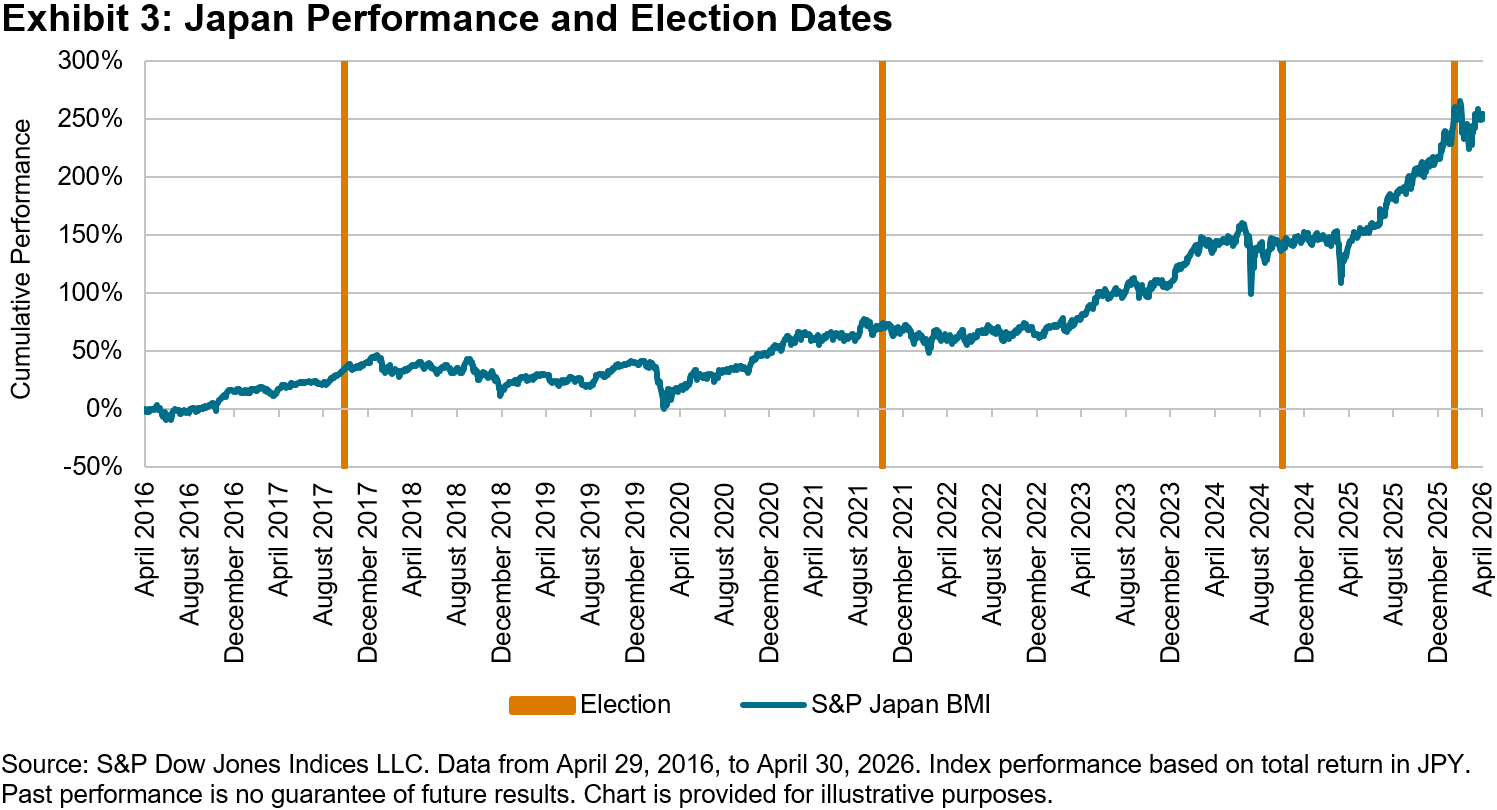
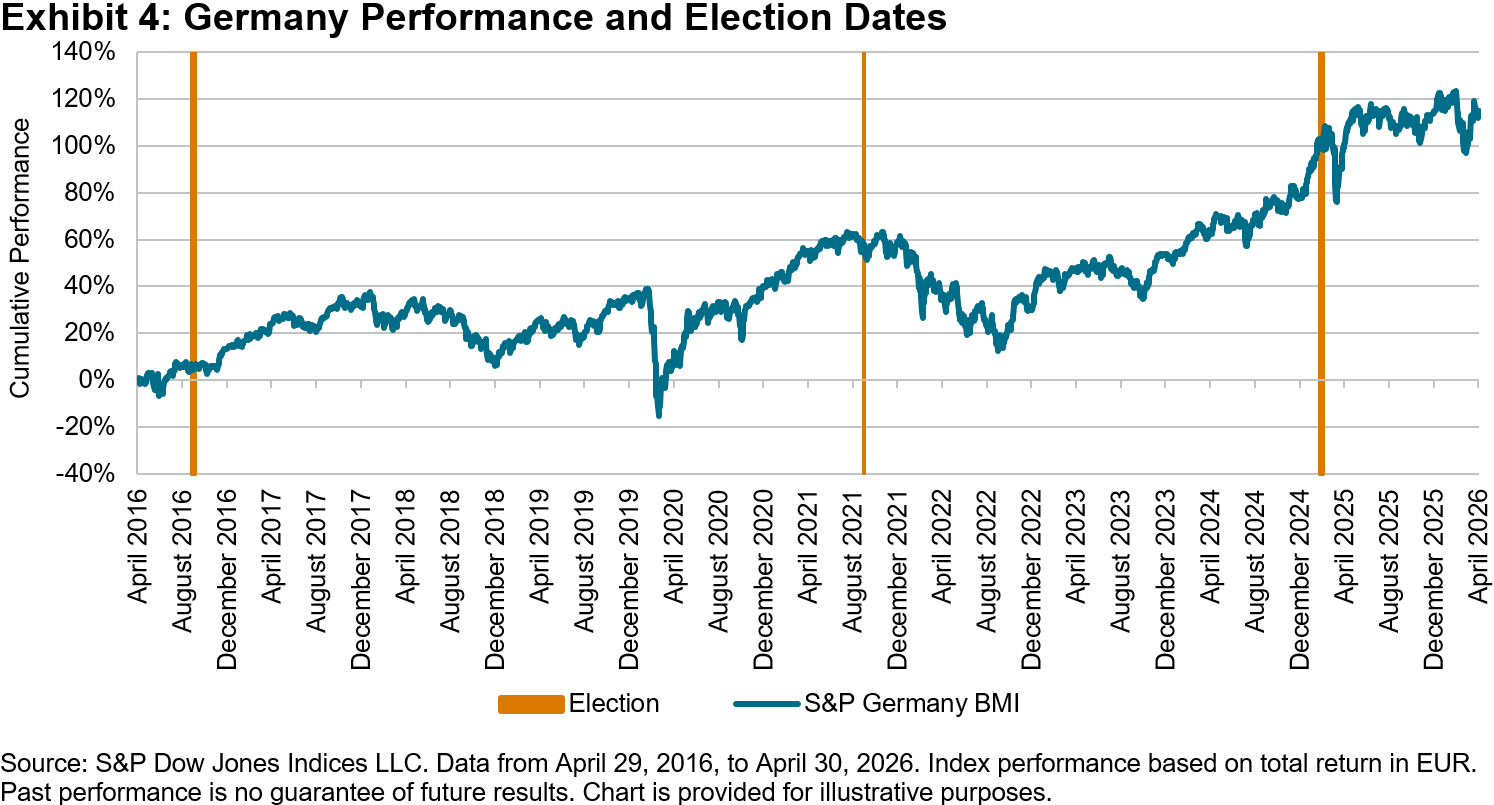
Performance of local indices indicate some seemingly significant fluctuations in performance around election dates, as shown in a sample of our observed countries in Exhibits 1-4, but similar bouts of volatility outside of election cycles suggest other factors may drive market changes even more.

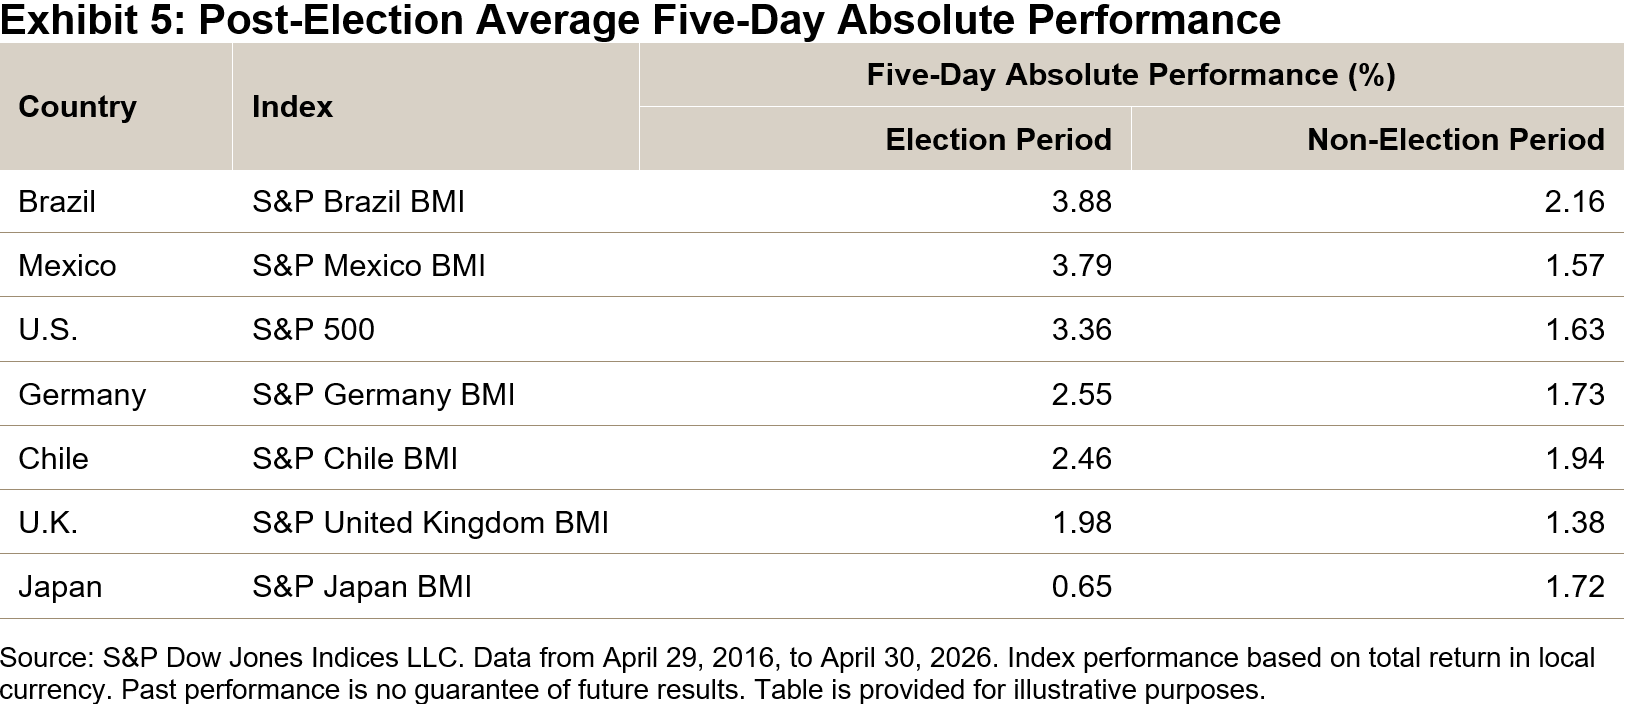
To standardize analyses of short-term election effects, we measured the absolute value of performance over the five-day period following federal election dates for new leaders in each selected country and compared them to a baseline of non-election periods across the same time frame.

The clearest pattern in the data indicated that short-term election effects varied significantly, as shown in Exhibit 5.

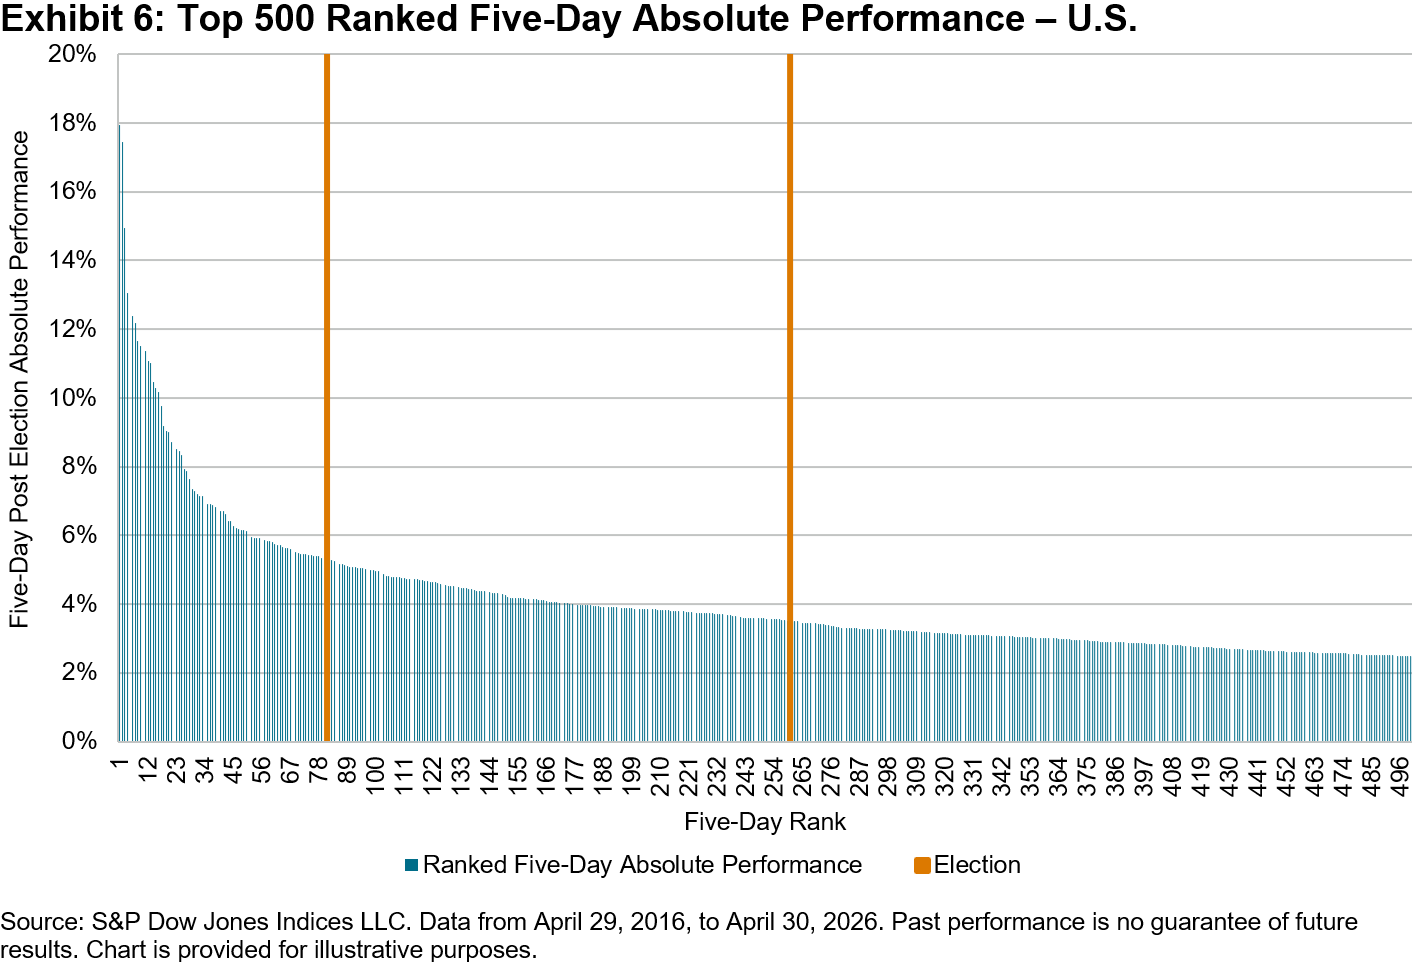
Looking beyond the averages and examining periods with the highest absolute index movement, we find that many election periods rank highly, but they are far from the most volatile periods encountered in these markets, as shown through the top 500 ranked five-day periods in the U.S. as shown in Exhibit 6.

Among our seven observed countries, five-day post-election market performance ranked in the top half of observed periods slightly more than half the time, suggesting national elections indeed are associated with above-average short-term volatility. However, there are plenty of volatile periods of more extreme market performance that underscore the impact of unexpected non-election events as well.

The implication is clear; election effects are real, but difficult to predict in direction, magnitude and timing. Investor reactions to expected election outcomes may occur well before or even well after election days, as polling and other news is taken into account. Markets may move for a variety of reasons, including elections, but drivers may be more nuanced. Analyzing which stocks, industries and sectors are most affected by local market events can paint a clearer picture of how investors are responding to all types of news, whether it’s related to the ballot box or not.

The posts on this blog are opinions, not advice. Please read our Disclaimers.

How and Why Institutions Are Evolving Their ETF Usage

What’s driving the continued growth of ETF adoption among institutional investors? Explore the expanded range of ETF applications across portfolio types and objectives.

For a deeper dive into the trends and insights highlighted in this video, read the full research report, ETFs in Institutional Portfolios: The New Normal.


The posts on this blog are opinions, not advice. Please read our Disclaimers.