From artificial intelligence and electrification to infrastructure spending and geopolitical competition for critical minerals, metals and mining companies sit at the center of some of the most important themes of this decade. The S&P Metals & Mining Select Industry Index tracks the performance of the companies that discover, extract and process the materials powering the global economy.
The S&P Metals & Mining Select Industry Index offers a focused view of the U.S. metals and mining sector. The index selects eligible companies from across various GICS® sub-industries, including Aluminum, Copper, Gold, Silver, Steel, Coal & Consumable Fuels and Diversified Metals & Mining. Constituents must be members of the S&P Total Market Index and meet minimum liquidity and market capitalization requirements.1
The index rebalances quarterly, with eligible constituents being initially equally weighted, with modifications made to ensure that for a given theoretical portfolio value, each constituent’s index weight cannot exceed 4.5% of the float market capitalization and the value that can be traded in three days.
Evolution of the Index
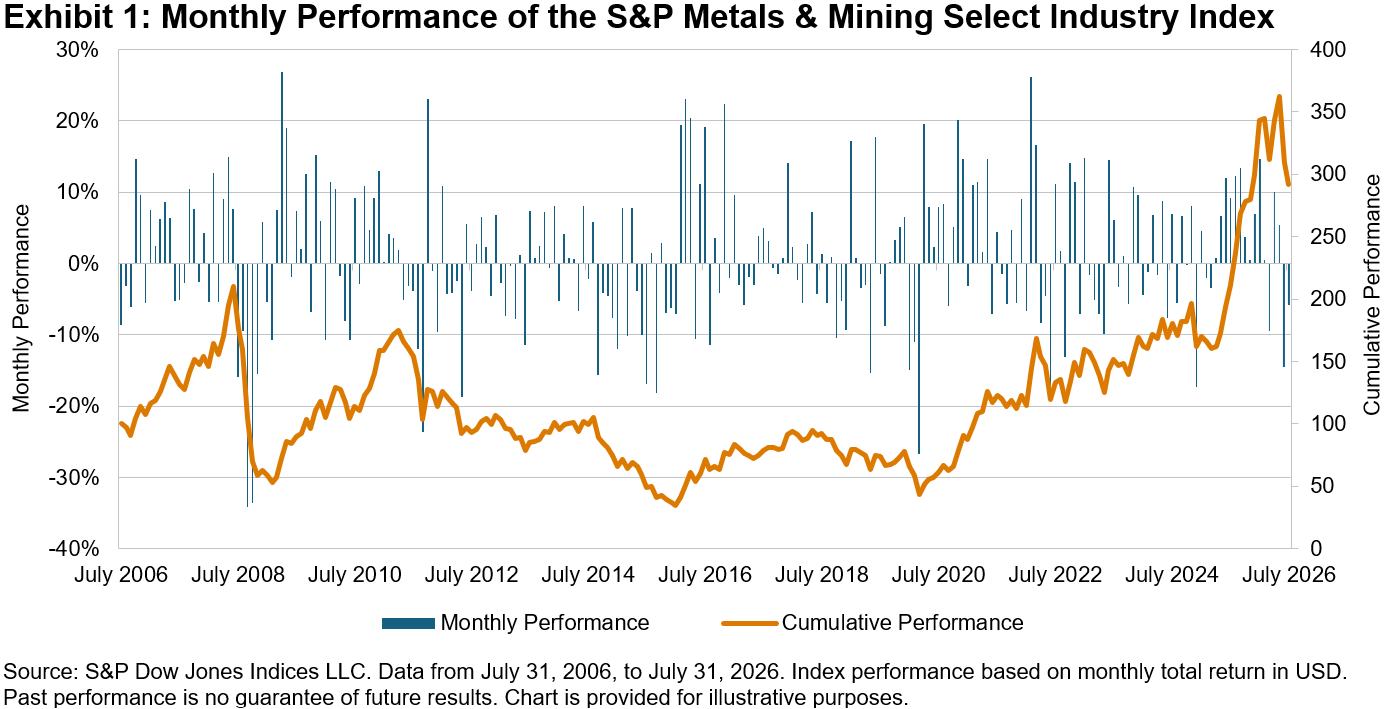
Launched on June 19, 2006, the S&P Metals & Mining Select Industry Index recently marked its 20th anniversary. Exhibit 1 shows the index’s monthly and cumulative performance over the past two decades. During this period, the index delivered an average monthly gain of 0.95%, with a positive monthly performance in 52.9% of observations.
The S&P Metals & Mining Select Industry Index’s composition has changed considerably over time, reflecting both market trends and methodology updates.2
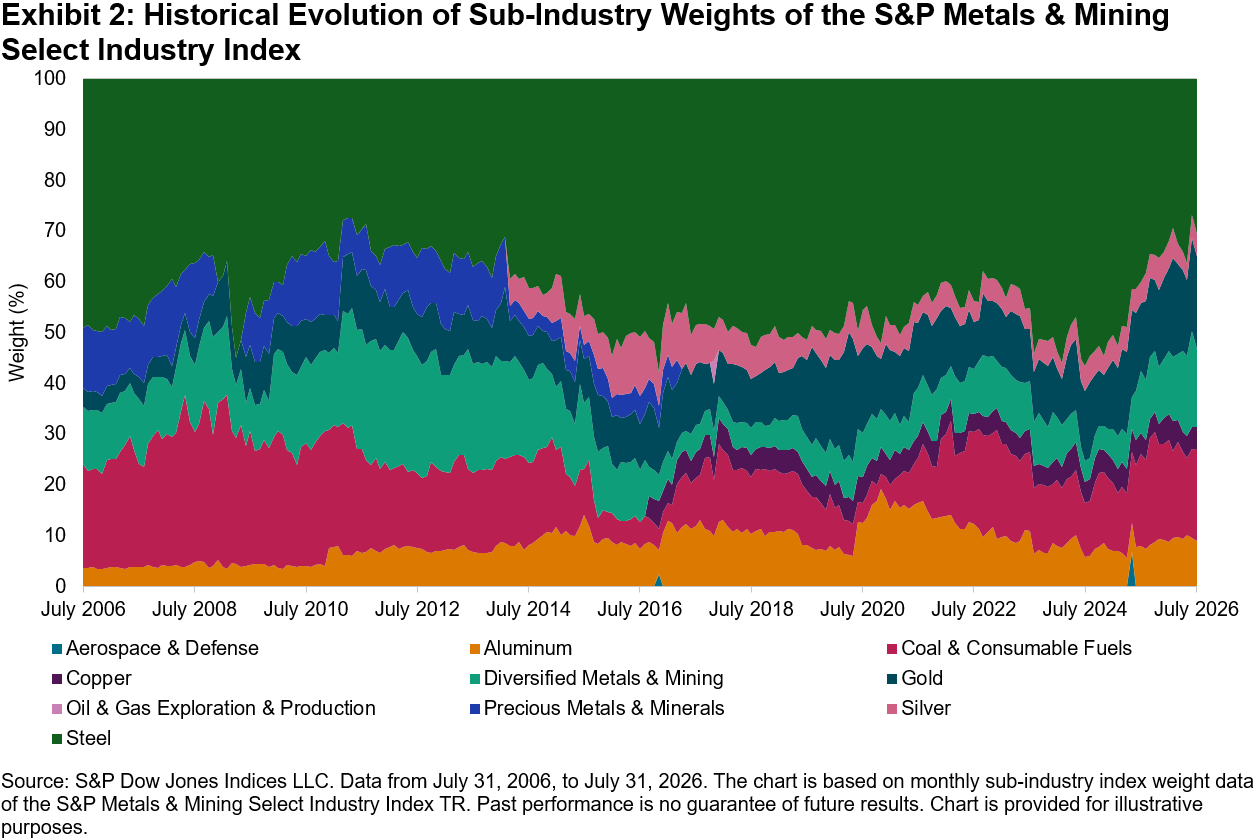
As seen in Exhibit 2, since its launch in July 2006, the index has evolved away from being a steel-heavy benchmark—Steel accounted for 49% of the index at launch, followed by Coal & Consumable Fuels at 20% and Diversified Metals & Mining and Precious Metals & Minerals at about 11%-12% each. The weight of Coal & Consumable Fuels grew significantly during the late 2000s, exceeding 30% at its peak, while the creation of the Copper sub-industry under the Metals & Mining industry resulted in the addition of Copper in 2016,3 further broadening the index’s industry representation. By July 2026, the index was more balanced, with Steel (31%), Coal & Consumable Fuels (18%), Precious Metals & Minerals (18%), Diversified Metals & Mining (15%), Aluminum (9%) and Copper (5%) all representing meaningful weights, reflecting a much broader cross-section of the U.S. metals and mining industry than at launch.
Effect of Participation across Sub-Industries and Capping on Performance
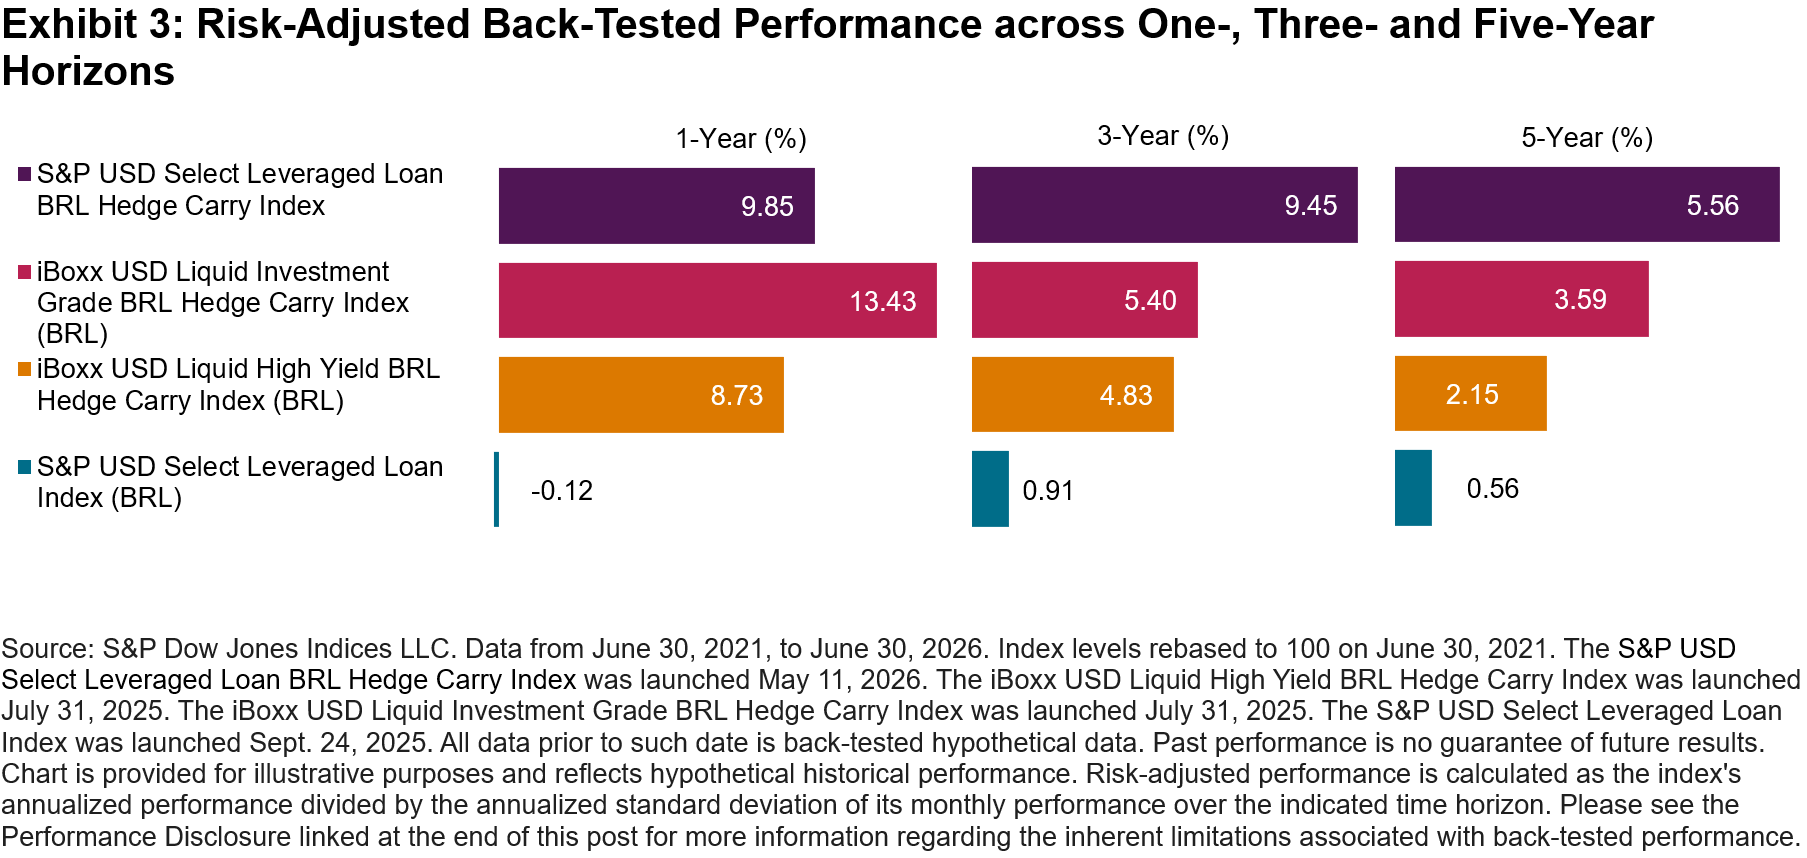
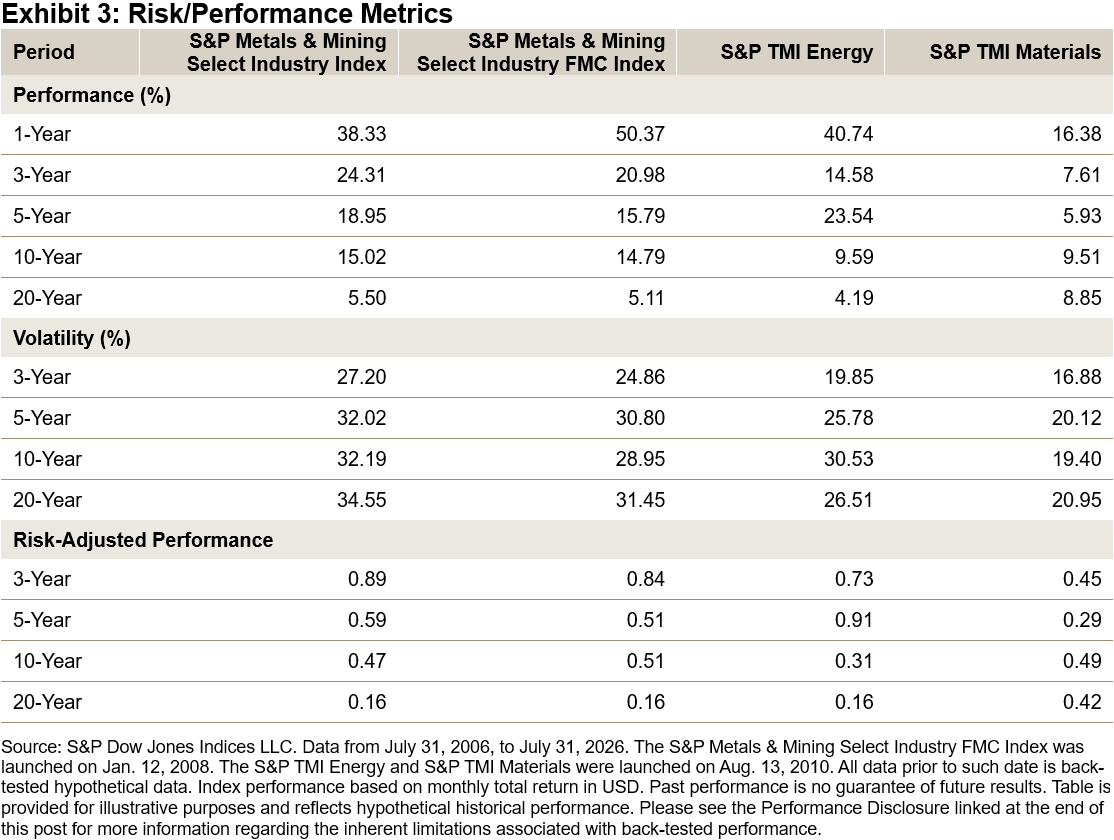
Exhibit 3 shows the effects of having a more targeted focus on U.S. Metals & Mining companies: the S&P Metals & Mining Select Industry Index typically posted higher risk-adjusted performance than the broader S&P Total Market Index (TMI) Energy and S&P TMI Materials sector indices. Additionally, the S&P Metals & Mining Select Industry Index typically posted higher risk-adjusted performance than its float market cap (FMC) weighted counterpart, highlighting the potential benefit of the index’s modified equal weight approach.
Conclusion
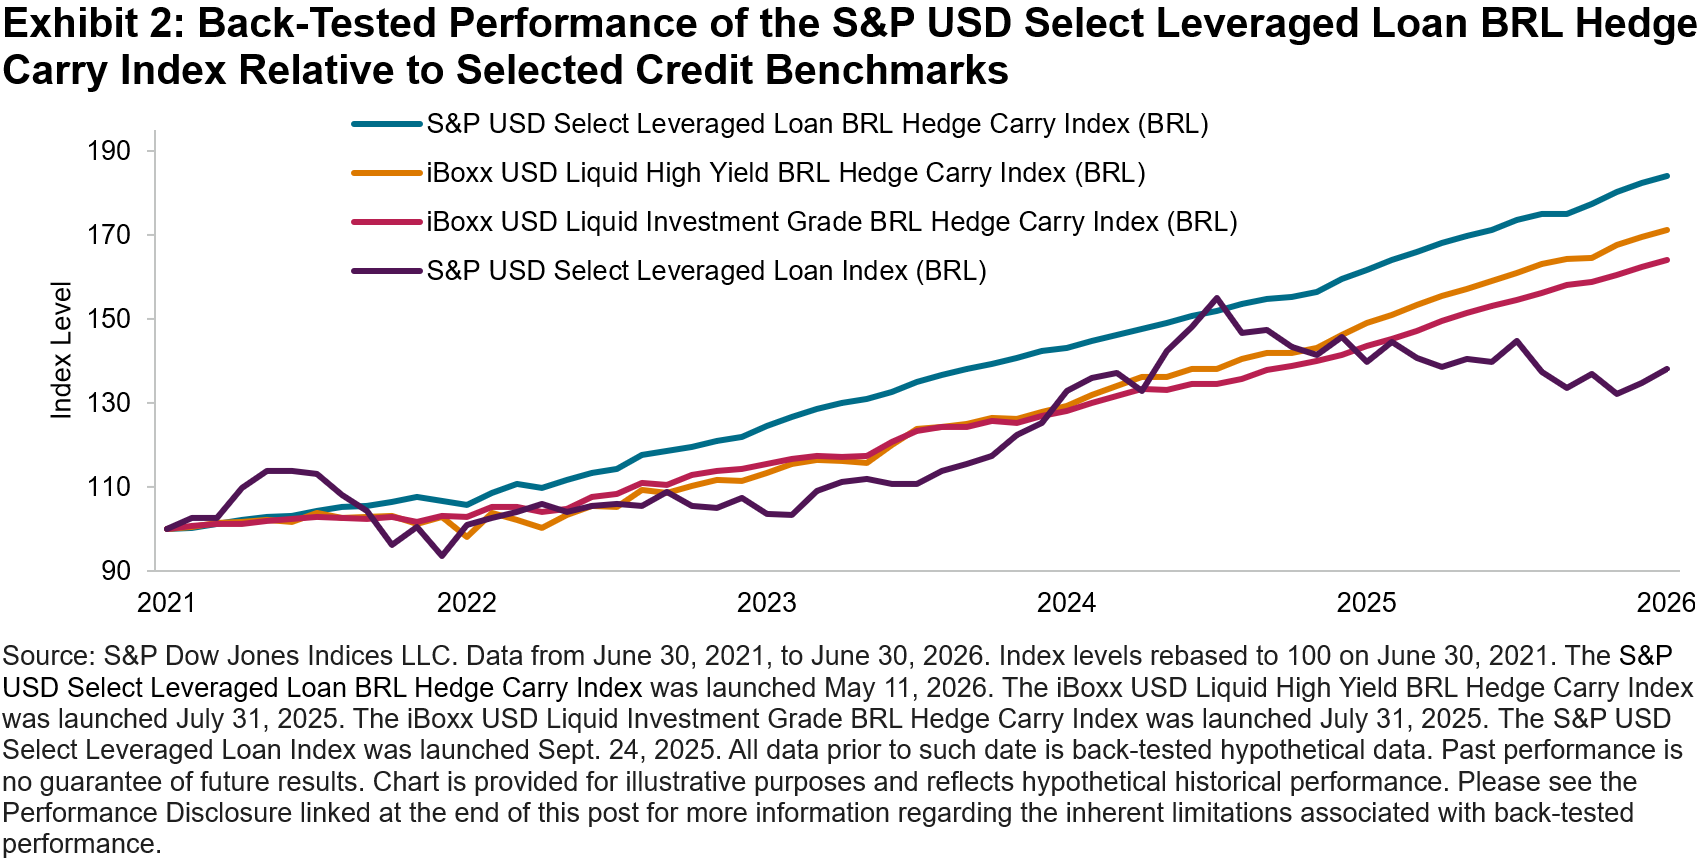
The S&P Metals & Mining Select Industry Index has evolved alongside the U.S. metals and mining industry, broadening from a structure once dominated by steel and coal producers to a more diversified mix that includes copper, aluminum, precious metals and diversified mining companies. The index’s historical (risk-adjusted) performance demonstrates the effects of a more targeted focus on U.S. metals and mining companies and incorporating a modified equal weight approach.
1 For more information, please see the S&P Select Industry Indices Methodology.
2 Essential Metal Awakening – Indexology® Blog | S&P Dow Jones Indices
The Race for Critical Materials and the Shift to Security – Indexology Blog | S&P Dow Jones Indices
The posts on this blog are opinions, not advice. Please read our Disclaimers.