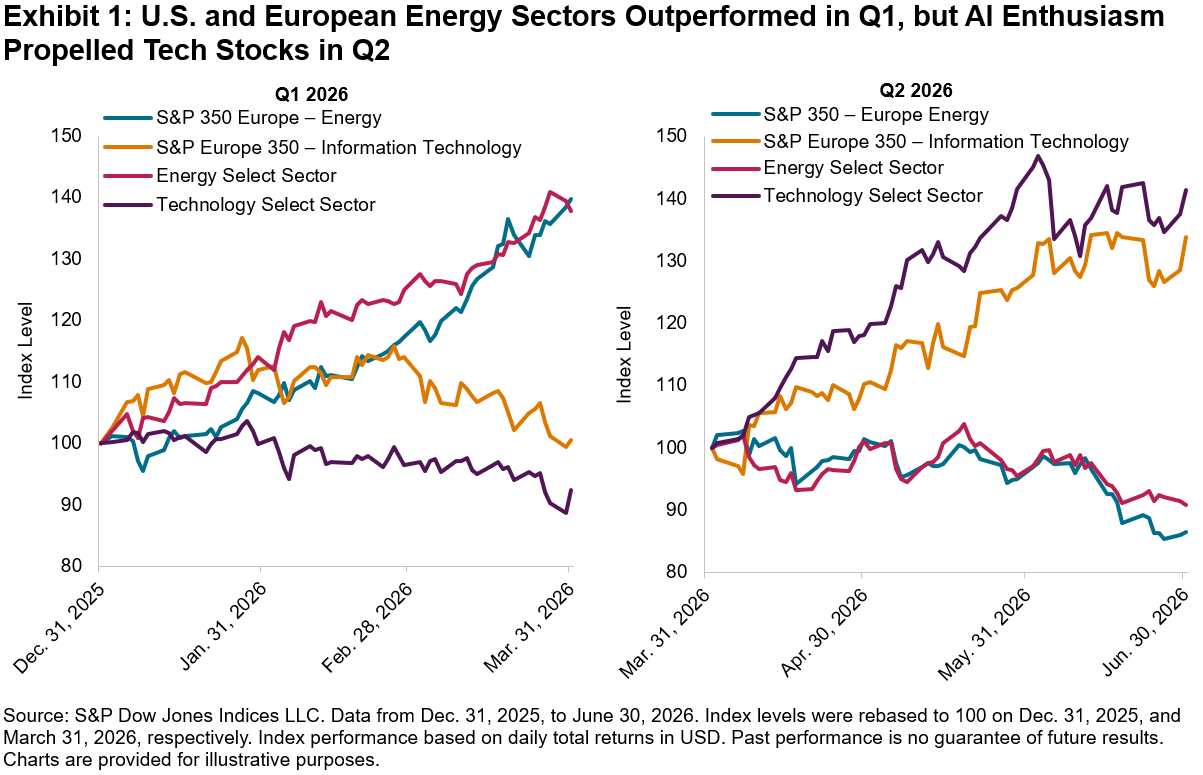
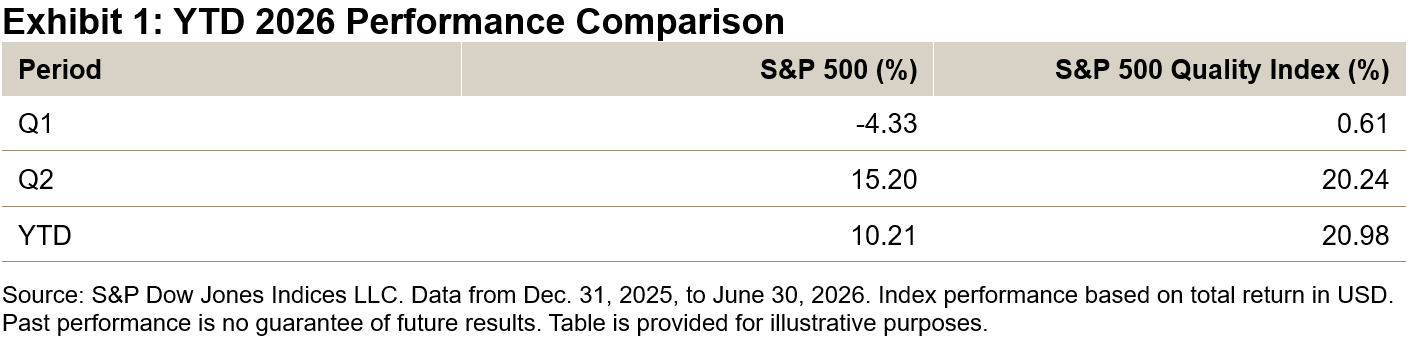
While headline returns often steal the spotlight, the path to those returns can be equally important—especially for those seeking to weather the market’s ups and downs over the long term. This underscores what makes the S&P 500® Quality Index particularly interesting: it hasn’t just outperformed the S&P 500 over the long term, but it has done so with lower risk, greater consistency and resilience during periods of market stress. Much of S&P 500 Quality Index’s outperformance has come from its ability to participate in most of the S&P 500’s upside while limiting losses during market downturns. The first half of 2026 showcases this well: the S&P 500 Quality Index posted 20.98%, more than twice the S&P 500’s 10.21%, driven in part by the S&P 500 Quality Index posting a gain in Q1 2026 while the S&P 500 fell 4.33% (see Exhibit 1).
In addition to reviewing historical performance, this blog will highlight the S&P 500 Quality Index’s performance profile—featuring its asymmetric capture ratios, robust hit rates and notable outperformance during “risk-off” economic periods.
Performance
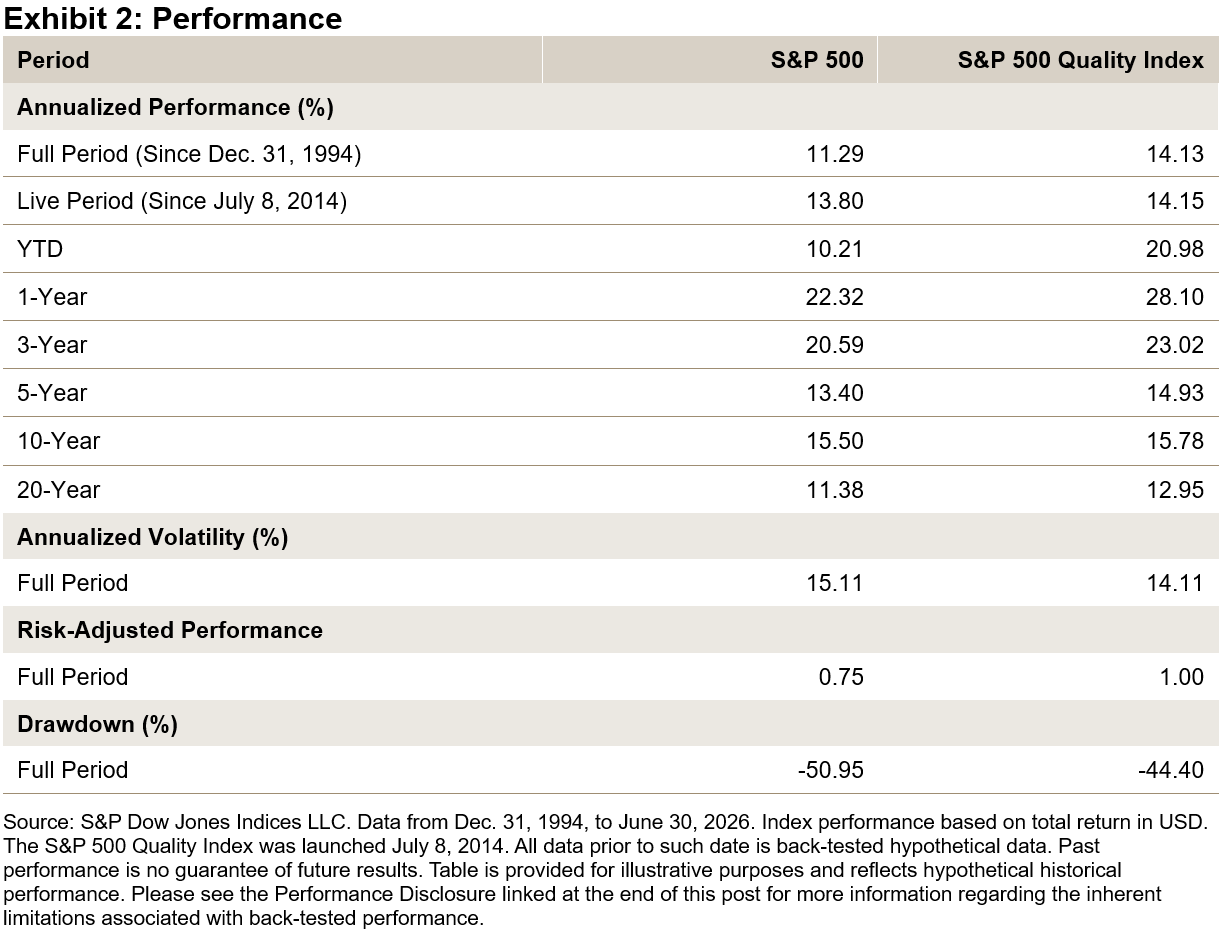
For more than three decades—including both live and back-tested performance—the S&P 500 Quality Index has outperformed the S&P 500 on a nominal basis by an annualized average of 285 bps (see Exhibit 2). Notably, its 14.13% annualized performance exceeded its volatility of 14.11%, resulting in a risk-adjusted ratio of 1.00—33% higher than the S&P 500’s already strong 0.75.
Moreover, while the S&P 500 Quality Index outperformed the S&P 500 in nominal terms across every period shown, it’s notable that this was accomplished with lower volatility and a smaller maximum drawdown over the full period. Importantly, the outperformance persisted during the live period. Since its launch on July 8, 2014, the S&P 500 Quality Index has outpaced the S&P 500 by 35 bps per year (see Exhibit 2), while also exhibiting lower annualized volatility (14.34% versus 14.85%).
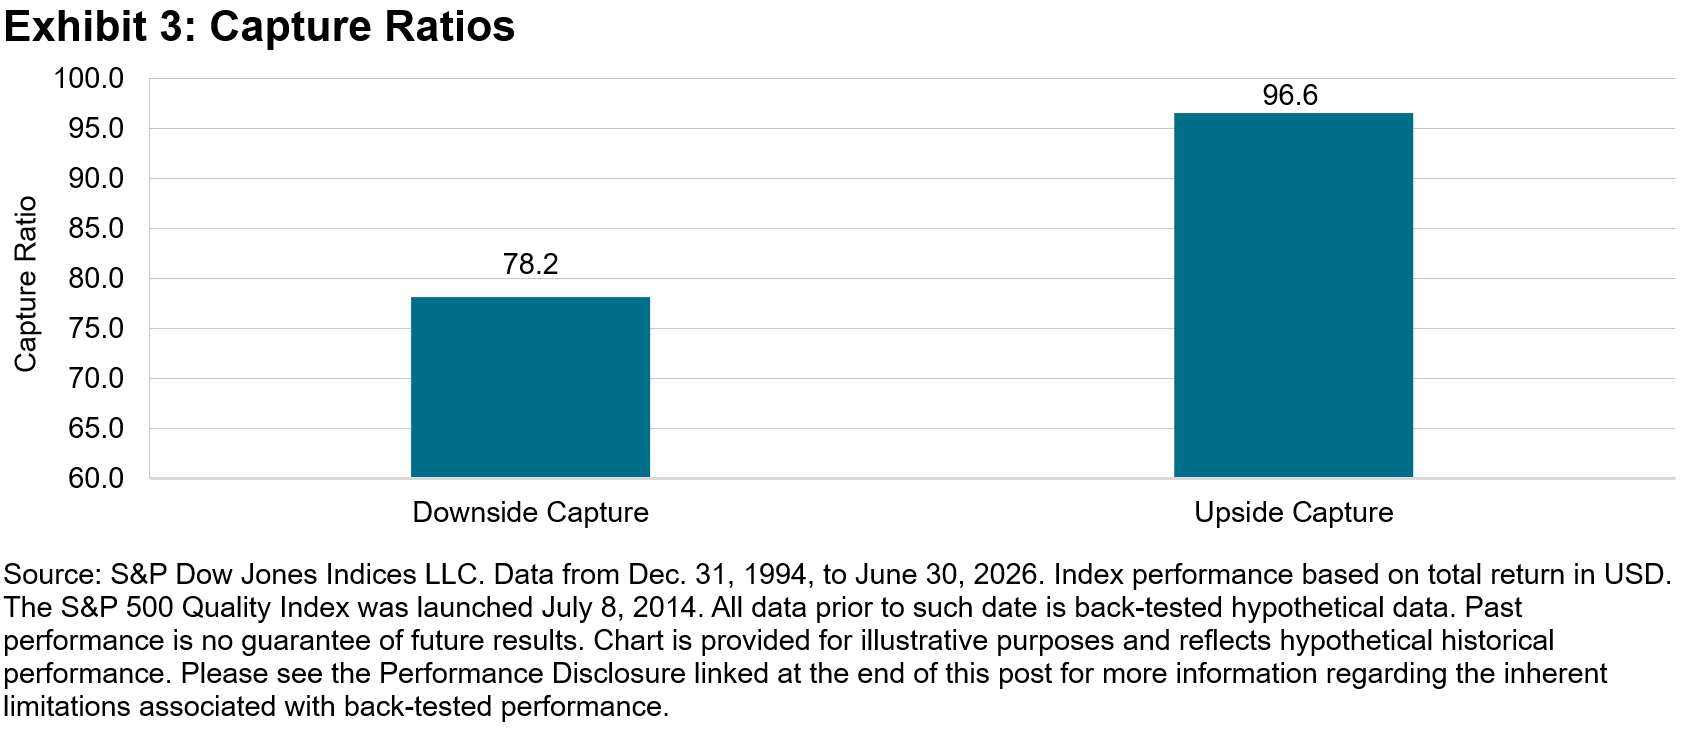
As mentioned earlier, a key characteristic of the S&P 500 Quality Index has historically been its asymmetric capture ratios. With an upside capture of 96.6, the index has participated in nearly all of the S&P 500’s upside, while its 78.2 downside capture means that it has tended to provide significant protection during market declines, historically.
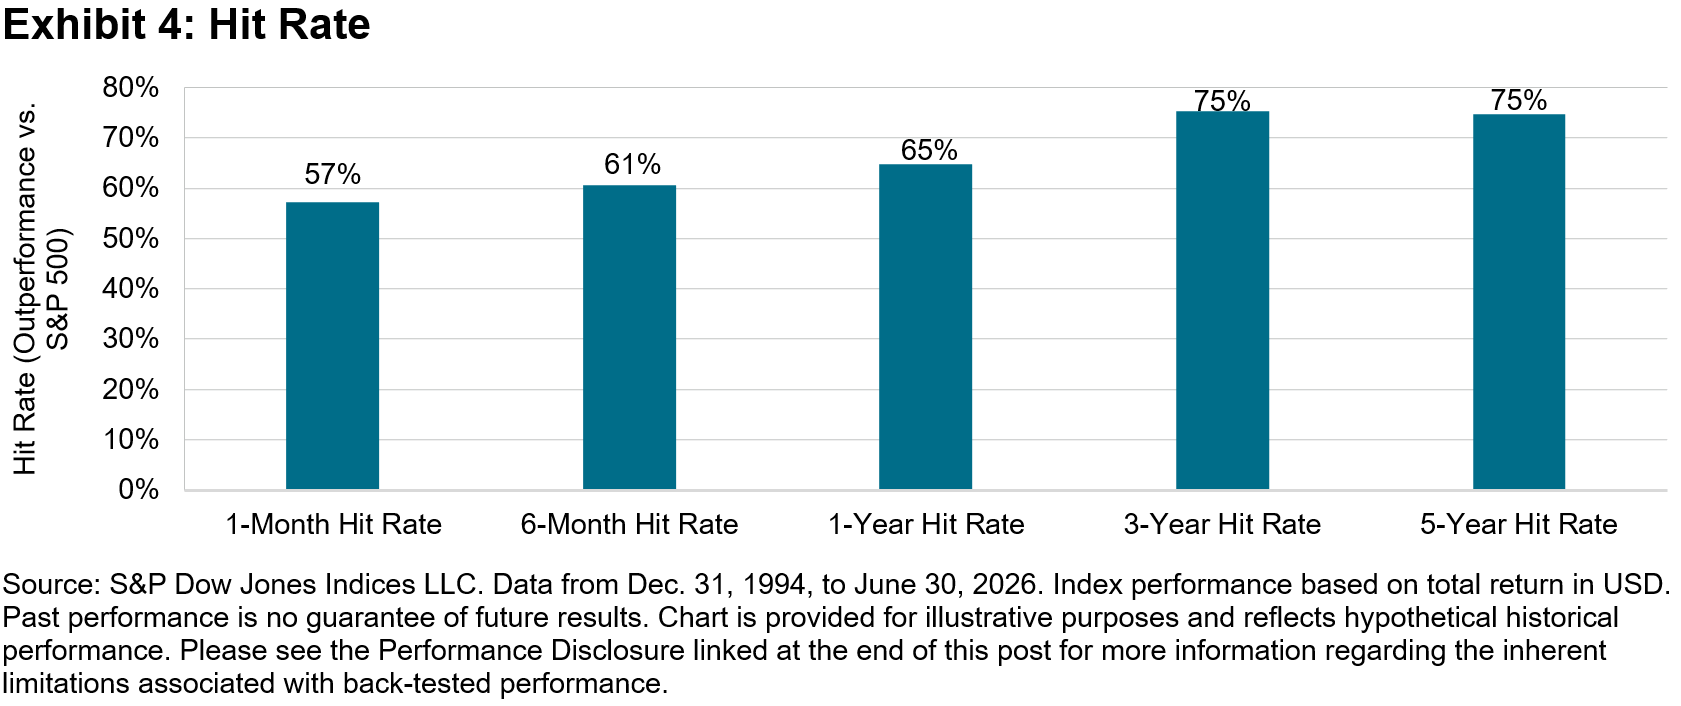
Another key characteristic of the S&P 500 Quality Index has been its consistent outperformance, demonstrated by its hit rate—the percentage of rolling periods during which it outperformed the S&P 500. As shown in Exhibit 4, the S&P 500 Quality Index outperformed the S&P 500 in 57% of one-month rolling periods, 61% of six-month rolling periods, 65% of one-year rolling periods, 75% of three-year rolling periods and 75% of five-year rolling periods.
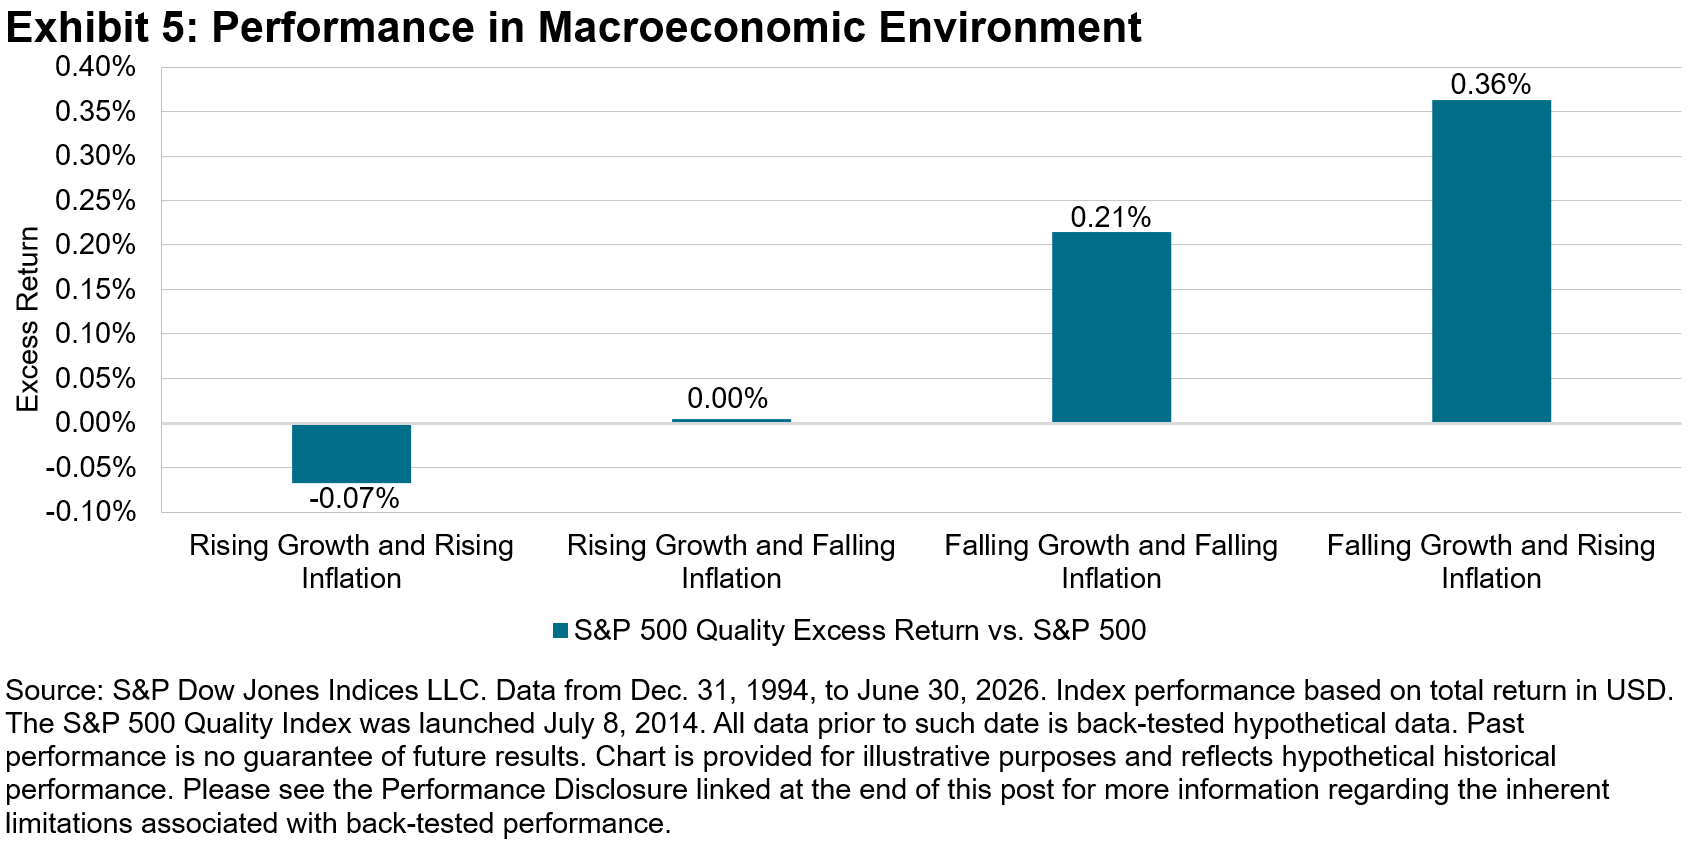
The S&P 500 Quality Index’s unique performance profile may best be highlighted in Exhibit 5. In “risk-on” environments with rising growth, the index typically matches or slightly underperforms the S&P 500. However, during “risk-off” periods marked by falling growth, the S&P 500 Quality Index provides crucial outperformance—averaging 0.21% when both growth and inflation are declining, and 0.36% when growth is falling but inflation is rising.
Conclusion
The S&P 500 Quality Index’s performance in the first half of 2026 exemplifies its historical strength, delivering outperformance through downside protection in Q1 and exceeding the S&P 500’s gain in Q2. However, its long-term outperformance—both absolute and risk-adjusted—is only part of the story; equally important are its lower risk—reflected in lower volatility, drawdowns and capture ratios—consistency and resilience during past periods of economic stress. It’s the distinctive combination of these attributes that sets the S&P 500 Quality Index apart.
The posts on this blog are opinions, not advice. Please read our Disclaimers.