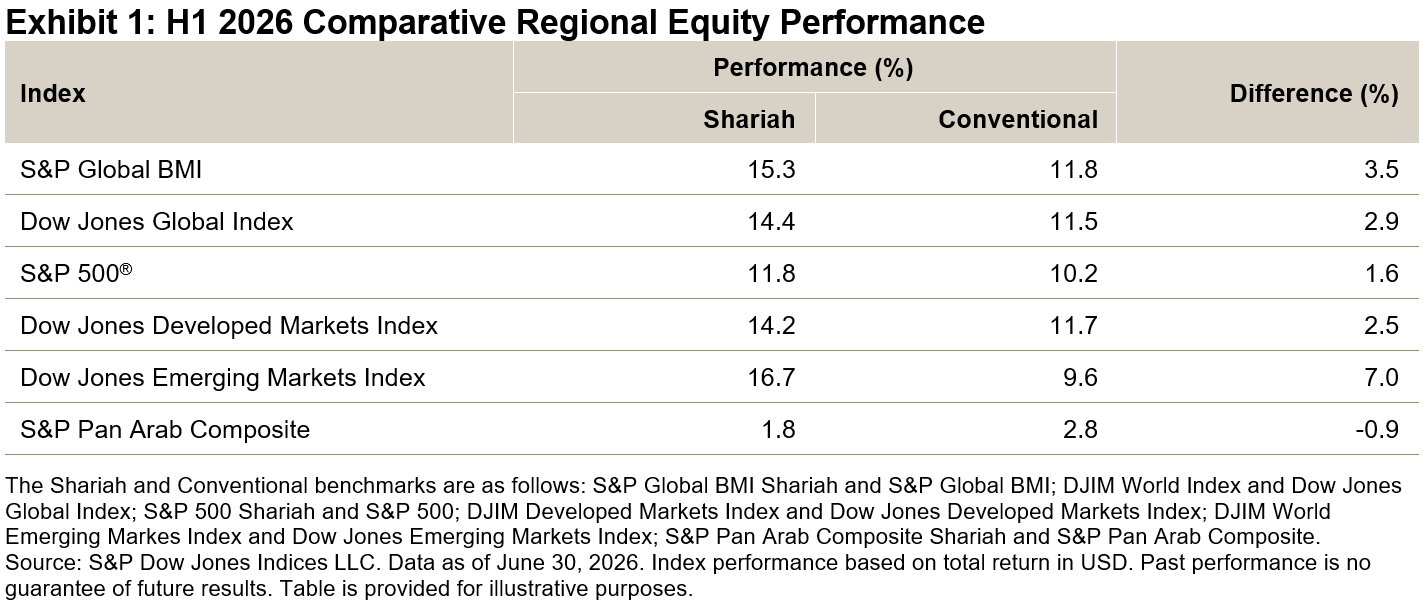
Global equities showed solid gains in the first half of 2026, supported by strong earnings in semiconductor-related industries. Conventional benchmarks rose across regions, with both global and developed markets posting double-digit gains, while emerging markets advanced at a slower pace, partly reflecting U.S. dollar strength. MENA equities continued to lag, weighed down by geopolitical tensions (see Exhibit 1).
Shariah-compliant equities outperformed conventional benchmarks across most major regions. The S&P Global BMI Shariah rose 15.3%, outperforming its benchmark, the S&P Global BMI, by 3.5%, while the Dow Jones Islamic Market (DJIM) World Index outperformed the Dow Jones Global Index by 2.9%. In developed markets, Shariah indices also modestly outpaced conventional peers, while the most pronounced gains were in emerging markets, where excess performance reached 7.0%. The MENA region remained the exception, showing modest underperformance (see Exhibit 1). See the Q2 2026 S&P Shariah and Dow Jones Islamic Market Indices Scorecard for more performance details.
Drivers of Shariah Index Performance in H1 2026
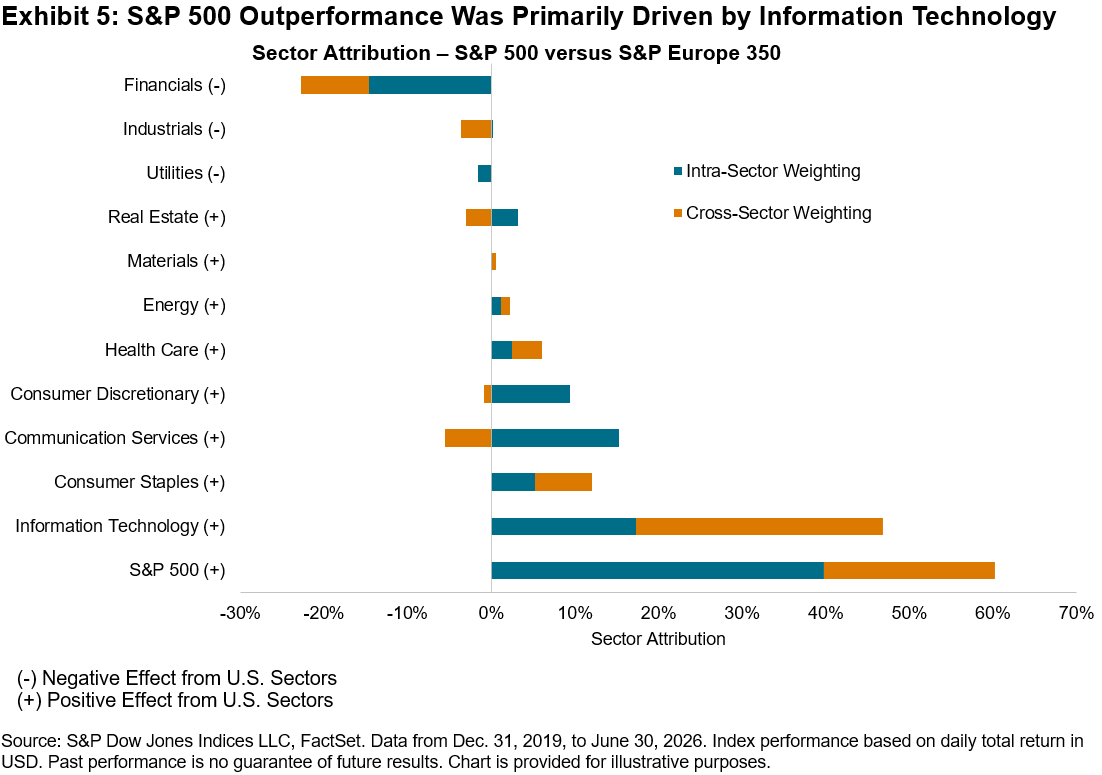
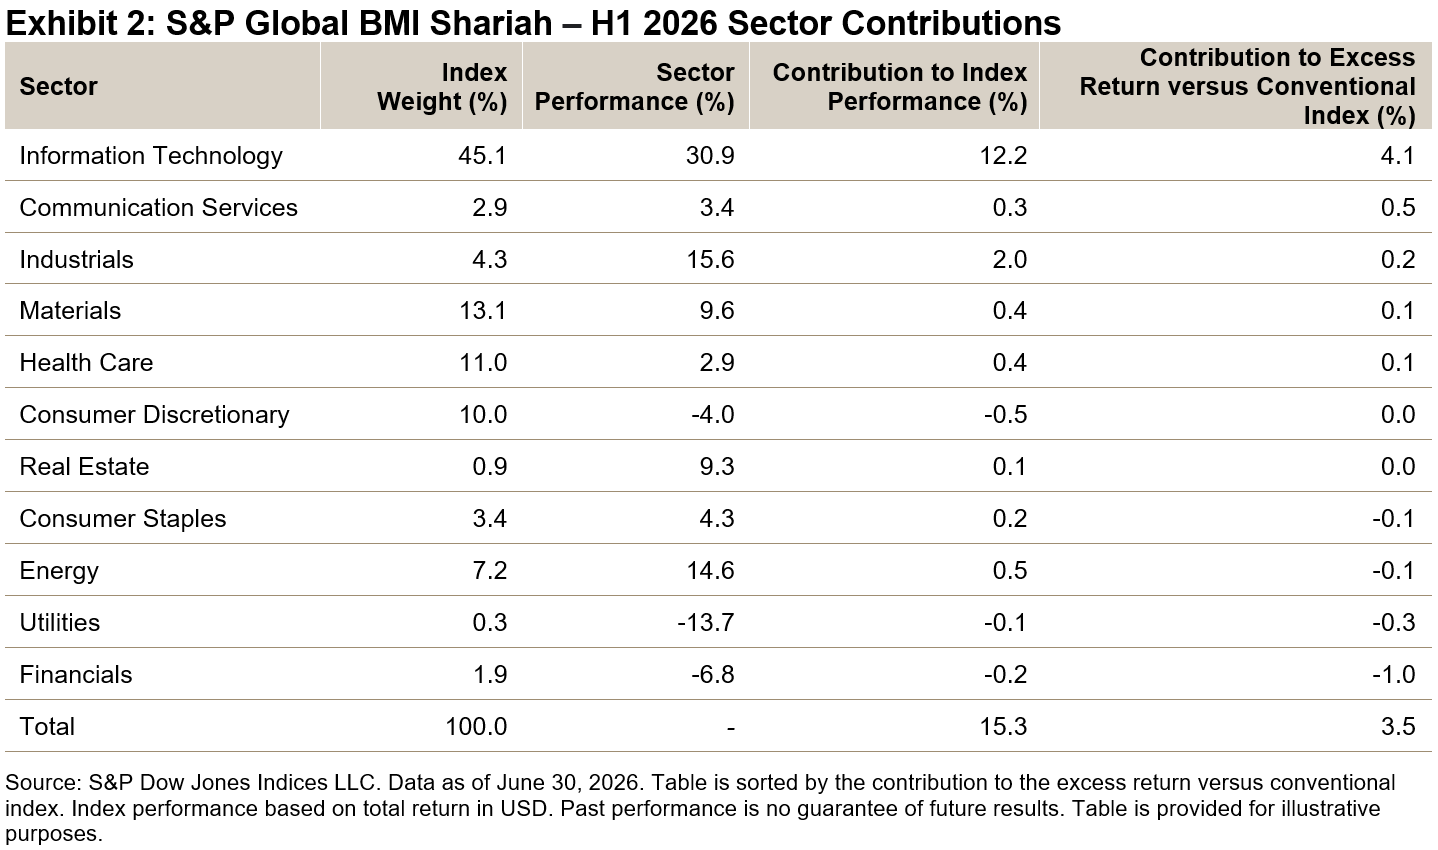
Sector positioning was a key driver of relative performance (see Exhibit 2). Information Technology—accounting for over 45% of the S&P Global BMI Shariah—rose 30.9% and contributed more than 12.2% to the index’s overall performance. Communication Services also supported relative gains, benefiting from stronger performance differentials versus conventional counterparts.
Conversely, structural underweights created headwinds. Limited weight in Financials and Utilities detracted 1.0% and 0.3% from excess performance, respectively, due to both underperformance versus conventional counterparts and lower weights.
Global Sukuk Posted Modest Gains
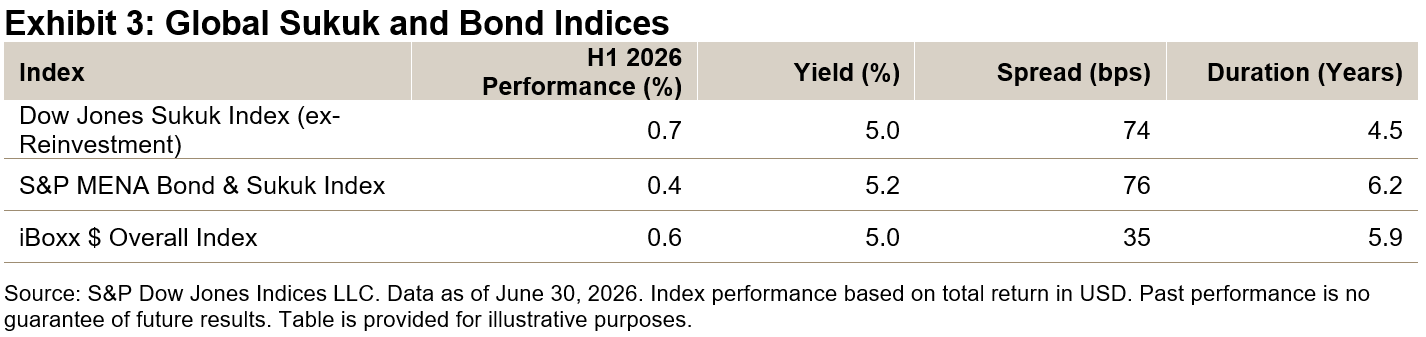
In fixed income, global markets experienced increased volatility amid sharp moves in oil prices and related uncertainties around inflation and policy rates. Investment grade bonds and sukuk performed modestly, with the iBoxx $ Overall Index and Dow Jones Sukuk Index (ex-Reinvestment) rising 0.6% and 0.7%, respectively. Yield levels remained comparable at around 5%, with sukuk offering higher spreads but shorter duration profiles (see Exhibit 3).
This article was first published in IFN Volume 23 Issue 29 dated July 22, 2026.
This content may be AI-assisted and is composed, reviewed, edited, and approved by S&P Global.
The posts on this blog are opinions, not advice. Please read our Disclaimers.