Get Indexology® Blog updates via email.

In This List

Introducing the S&P 500 Defined Outcome Index Series

Cashing in the Chips?

Qubits and beyond: Tracking Quantum Computing’s Momentum

The Search for Elusive Outperforming Active Funds in Japan

New Tools for Tracking Sector Liquidity

Introducing the S&P 500 Defined Outcome Index Series

Contributor Image
Phillip Brzenk

Managing Director, Global Head of Multi-Asset Indices

S&P Dow Jones Indices

Since the launch of the first defined outcome ETF in 2018, defined outcome strategies have moved from the margins to mainstream. In markets shaped by concentration risk, volatility and interest rate uncertainty, strategies that offer market participants upside participation with downside protection—via caps, buffers, floors and outcome periods—may help offset the risk of long-only equity exposure. With defined outcome ETF assets estimated at more than USD 78 billion,1 the need for benchmarks that reflect those strategies with greater precision is greater than ever, and S&P Dow Jones Indices has introduced the S&P 500® Defined Outcome Index Series to meet this need.2

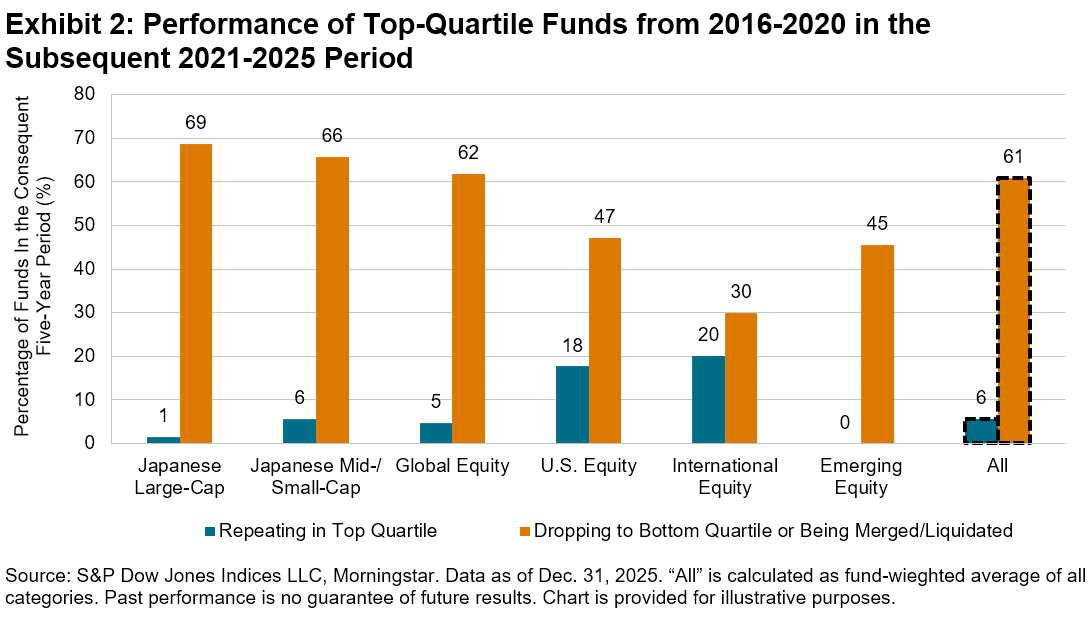
These indices were built to measure options-based outcome structures tied to the S&P 500 with a level of specificity that mirrors how investors use these strategies. Rather than treating defined outcome investing as a single category, the new benchmarks recognize that outcomes vary by downside buffer, upside participation framework and outcome period. The result is a broader index architecture spanning monthly vintages and several distinct exposure profiles, including 9% buffered, 15% buffered, 5% to 35% buffered and 100% buffered strategies, along with composite benchmarks designed to give a wider view across vintages. The indices have back-tested history back to 1996, which provides insight into hypothetical performance. With this data, we are able see how these strategies have performed across multiple market regimes and several key market stress events, including the dotcom bubble and crash, the 2007-2008 Global Financial Crisis and the COVID-19 pandemic.

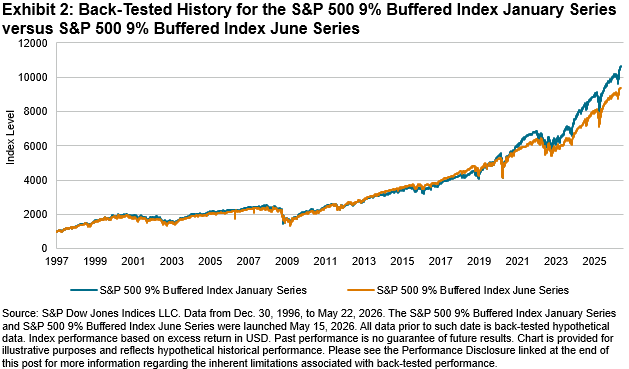
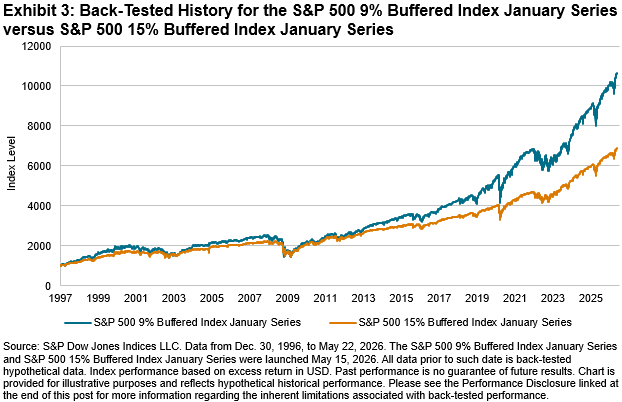
Timing and structure are both critical elements of defined outcome strategies. A one-year buffered strategy that starts in January is different from one beginning in June. Similarly, a partial buffer and a deep buffer serve different purposes and suit different risk tolerances. Defined outcome strategies represent tradeoffs, as greater downside protection comes at the cost of greater upside potential.

Market participants may use these indices to help match outcome-oriented exposures with client objectives, whether that be mitigating drawdowns, reducing sequence risk or maintaining a more deliberate balance between protection and upside potential. A benchmark family that reflects those distinctions gives market participants a transparent way to compare exposures and better understand potential strategy behavior.

A benchmark should do more than provide a reference point; it should help provide transparency into the mechanics of performance. The dedicated S&P 500 Defined Outcome Index Series provides a more rigorous framework for measuring buffered equity strategies.

1 Morningstar as of year-end 2025.

2 For more information, please see the S&P 500 Defined Outcome Indices Methodology.

The posts on this blog are opinions, not advice. Please read our Disclaimers.

Cashing in the Chips?

Contributor Image
Anu Ganti

Head of U.S. Index Investment Strategy

S&P Dow Jones Indices

The rally in U.S. equities continued in May, with the S&P 500® posting 11 all-time closing highs during the month. A key catalyst for the market’s upward march has been optimism surrounding companies benefiting from the boom in AI. The beneficiaries of the investment in AI are no longer just the mega-cap hyperscalers, but the rapidly growing companies situated within the technology hardware and semiconductors industries.

Exhibit 1 shows that almost a quarter of the S&P 500’s YTD performance was contributed by the five top-performing stocks within the 500. Notably, none of these companies are part of the Magnificent 7, the members of which contributed a similar magnitude to the index’s performance. Instead, these leaders are part of a growing cohort of chipmakers, including the latest addition to the trillion dollar club Micron Technology, as well as older stalwart and survivor of the tech bubble Intel.

As investors have become more discerning in assessing the winners and losers of the AI trade, cross-sectional volatility—or dispersion, which measures how differently stocks are performing relative to each other—has risen to extreme levels relative to history. These levels were surpassed only by May 2009, as the market began its recovery from the Global Financial Crisis. The value of stock-selection skill rises when dispersion is high, which can mean greater opportunities for skillful stock pickers to outperform.

Meanwhile, although the spread between outperforming and underperforming stocks has widened, market breadth—defined as the percentage of stocks outperforming the benchmark—has steadily declined this year. In May, 24% of stocks beat the S&P 500, declining by more than half compared to February, when 67% of stocks outperformed the index. Since then, market leadership has become more concentrated, shifting from smaller caps to a handful of large caps, which can make conditions more challenging for high-conviction managers who may be underweight the largest stocks while also holding a fewer number of the likely winners.

Active managers generally fared better during high dispersion periods, but how have stock pickers fared historically during periods of narrow breadth? Looking to history for a better understanding of active manager performance trends, we can analyze the 25-year history of our SPIVA® U.S. Scorecard, which measures the performance of active managers versus their appropriate benchmarks.

In Exhibit 4, we divided the years in our SPIVA database into low and high breadth periods, defined as when the percentage of stocks beating the benchmark S&P 500 was below 50% and above 50%, respectively. As expected, large-cap managers generally did worse in low breadth periods, with 67% underperforming the S&P 500, higher than the 63% during high breadth periods. Still, high breadth regimes were characterized by majority underperformance.

As we approach the second half of 2026, we can look to implied dispersion to understand the potential for future opportunities for stock selection. The Cboe S&P 500 Dispersion Index (DSPX), which uses listed options to measure the expectations for dispersion over the next 30 calendar days, rose to a one-year high of 42.01 on the last trading day of May. This means the market expects that the spread of annualized S&P 500 stock returns will have a standard deviation of 42% next month and may signify positive prospects for active stock selection.

But if the market continues its advance upwards and breadth remains narrow, that could create a higher hurdle for constituent stocks to beat and for the stock pickers attempting to outperform the benchmark. Exhibit 5 shows that, historically, S&P 500 all-time highs have been followed by an annual average gain of 7.5%, slightly below the median of 8.5%. Extremes include the 42% decline after the all-time high in October 2007, when the market subsequently entered a bear market, and the 40% gain after the all-time high in October 1996, when the market continued its momentous bull run.

Today’s environment, characterized by soaring valuations and the fervor toward spending on memory chips, is reminiscent of the late 1990s. Of course, the dot-com bubble popped in 2000, but no one knows if we are in the midst of a bubble that may soon burst. For those high-conviction managers who may be capitalizing on a higher dispersion environment, the headwinds from narrow breadth may be a much-needed warning.

The posts on this blog are opinions, not advice. Please read our Disclaimers.

Qubits and beyond: Tracking Quantum Computing’s Momentum

Contributor Image
Luca Ramotti

Associate Director, Thematic Indices

S&P Dow Jones Indices

The U.S. government recently committed over USD 2 billion to nine quantum companies under the CHIPS Act,1 taking equity stakes in each. It is a signal that quantum computing has become a matter of national interest. Markets seem to have already been taking note, with the S&P Kensho Global Quantum Computing Technologies Index up 120% since the start of 2025 and 57% quarter-to-date as of May 22, 2026 (see Exhibit 1).

At its core, quantum computing uses qubits. Unlike classical bits that are fixed as either 0 or 1, qubits can exist in a superposition of both states simultaneously until measured. This property makes quantum computers particularly powerful for certain complex problems that are effectively unsolvable by classical computers. The theoretical foundations stretch back decades, but the technology has long been constrained by the difficulty of building stable, error-corrected qubits. In this way, it shares something with AI, where the core ideas preceded the technology needed to make them useful by a generation.

An Index in Motion

Tracking this fast-evolving space requires a different approach than traditional index construction. As described in a previous blog post, the S&P Kensho Global Quantum Computing Technologies Index uses natural language processing (NLP) to identify relevant companies, rather than relying on standard industry or revenue-based classifications. This matters because most pure-play quantum companies do not yet have tangible recurring revenues, making financial screening alone insufficient. The index has doubled from 13 to 26 constituents between 2022 and 2026, with U.S. companies accounting for 69% of the index’s weight, a concentration that mirrors the dominance of U.S. venture capital in funding quantum research.2

The pie charts in Exhibits 2, 3 and 4 show the breakdown of the S&P Kensho Global Quantum Computing Technologies Index using traditional GICS® industry weights, RBICS revenues and a value-chain analysis, respectively. However, as quantum computing is still a nascent industry, standard approaches still do not reflect it fully.

Since its launched on July 7, 2025, the S&P Kensho Global Quantum Computing Technologies Index is up 107%, but the journey has not been smooth. A significant rally in the September-October 2025 period gave way to a range-bound phase through the end of Q1 2026, before the index accelerated again, adding 57% quarter-to-date as of May 22, 2026. Gains have been broad based, with 22 out of 27 constituents contributing positively to one-year performance (see Exhibit 5).

The Backstage Winners

Of the top 10 S&P Kensho Global Quantum Computing Technologies Index contributors, 7 belong to the Sub-Components and Materials segment. As shown in Exhibit 6, this segment represents only 12% of the index’s weight yet has accounted for 73% of overall performance. Quantum Hardware has dominated the index with a weight of 59% but has contributed only 16% to overall performance.

Much of the public narrative around quantum computing is dominated by QCaaS companies such as D-Wave, Rigetti and IonQ—the companies that are generally considered to be the closest to building real world quantum applications. Yet the strongest returns have come from a less visible part of the ecosystem: the companies supplying the components behind the hardware. For example, Soitec provides silicon on insulator wafers critical for advanced chip design;3 FormFactor provides semiconductor test and measurement equipment;4 while Coherent supplies optical components and specialty fiber used in AI data center infrastructure and quantum hardware.5 Each of these companies carries quantum exposure on top of an already strong underlying business tied to AI infrastructure spending, something pure-play quantum names cannot yet claim.

This reflects where quantum computing stands today, still in the infrastructure building phase. The more downstream companies, the QCaaS names and those closest to real world applications, remain more directly tied to the longer-term potential of the technology.

Quantum’s Present Tense

Quantum computing’s story is not waiting to start.6 In cryptography, researchers and government agencies have begun flagging a risk7 known as “harvest now, decrypt later,” where malicious actors collect encrypted data today with the intention of decrypting it once quantum computers are powerful enough to break current encryption standards. It is a threat that is already informing how some governments and enterprises think about long-term data security.

The S&P Kensho Global Quantum Computing Technologies Index will continue to measure the evolution of this technology. Its performance across segments, from Sub-Components to QCaaS, offers a window into how the technology itself is progressing and which stage of the quantum journey is leading the market at any given time.

1   National Institute of Standards and Technology, “Department of Commerce Announces Letters of Intent With 9 Companies for $2 Billion to Accelerate U.S. Leadership in Quantum Computing,” May 21, 2026.

2   Ruane, J., Kiesow, E., Galatsanos, J., Dukatz, C., Blomquist, E., Shukla, P., “The Quantum Index Report 2025,” MIT Initiative on the Digital Economy, Massachusetts Institute of Technology, Cambridge, MA, May 2025.

3   Soitec, “Semiconductors Fabs: Speed and time-to-market acceleration – A global presence.

4   FormFactor, “Press Release,” May 13, 2026.

5   Coherent, “Specialty Optical Fibers.”

6   Hopkins, Brian, “Practical Quantum Computing By 2030 Is Likely — And So Is Q‑Day,” Forrester, March 11, 2026.

7   Mascelli, Jillian and Rodden, Megan, “‘Harvest Now Decrypt Later’: Examining Post-Quantum Cryptography and the Data Privacy Risks for Distributed Ledger Networks,” Board of Governors of the Federal Reserve System, September 2025.

The posts on this blog are opinions, not advice. Please read our Disclaimers.

The Search for Elusive Outperforming Active Funds in Japan

Contributor Image
Sue Lee

APAC Head of Index Investment Strategy

S&P Dow Jones Indices

As readers of our SPIVA® Scorecards know, beating the market is difficult. Finding those few managers capable of doing so consistently may be even harder. Of the 933 active equity funds domiciled in Japan, more than 80% underperformed their respective benchmarks in 2025.1 Yet even among the minority that did outperform, the bigger question remains: how many were able to repeat that success?

If an active manager possesses genuine skill, one would expect their funds to outperform with some consistency over time. However, our research shows that active outperformance tends to be fleeting, regardless of asset class or geography.

Japan was no exception. Based on the universe of funds covered in the SPIVA Japan Scorecard, most of the funds that ranked among the best performers in one period failed to maintain that position in the years that followed. Of the 78 Japanese Large-Cap and 47 Japanese Mid-/Small-Cap funds that placed in the top quartile in 2021, only 8% (including 6 Japanese Large-Cap and 4 Japanese Mid-/Small-Cap funds) remained in the top quartile in each of the four subsequent years. Across the non-domestic equity fund categories examined, not a single fund managed to rank in the top quartile for five consecutive years (see Exhibit 1).

The picture became even starker over longer time horizons. As shown in Exhibit 2, among the top-quartile funds across all reported Japanese fund categories for the five-year period ending in December 2020, only 6% maintained their top-quartile status over the subsequent five-year period, while 61% fell to the bottom quartile or were merged or liquidated.

These shifts were particularly pronounced in domestic equity funds. Only 1% of the top-quartile Japanese Large-Cap funds in 2016-2020 remained in the top quartile in 2021-2025, while 69% dropped to the bottom quartile or were merged or liquidated.

Examining market trends over these two five-year periods may provide some insights into the sharp turnover in fund rankings. Comparing the performance of Japanese sector and factor indices2 between the two five-year periods (see Exhibit 3) reveals meaningful rotations in leadership. For example, the top-performing sectors in 2016-2020—Information Technology, Communication Services and Health Care—all lagged in 2021-2025, while Financials and Energy, which were among the worst-performing sectors in 2016-2020, posted strong outperformance in the subsequent five-year period.

A similar reversal was evident at the factor level. Quality moved from the top of the table in 2016-2020 to the bottom in 2021-2025, while Value, Dividend and Buyback moved in the opposite direction, leading the market in the most recent five years (see Exhibit 3). Taken together, the lack of persistence among active funds and the sharp rotation in market drivers suggest that many active domestic equity managers struggled to adapt to the changing conditions in the Japanese equity market.

Over the recent five-year period, a firm majority of actively managed equity funds in Japan underperformed across all reported categories (see Exhibit 4). While domestic equity funds fared relatively better, with roughly one in four funds outperforming, identifying these outperformers in advance would likely have been difficult, particularly for fund selectors relying on historical fund performance as a guide.

1 Lee, Sue et al., “SPIVA Japan Scorecard Year-End 2025,” S&P Dow Jones Indices LLC, March 9, 2026.

2 See the Index Dashboard: Japan for the list of sector and factor indices in Japan.


The posts on this blog are opinions, not advice. Please read our Disclaimers.

New Tools for Tracking Sector Liquidity

How is index data helping market participants make more informed decisions at the sector level? S&P DJI’s Anu Ganti and Agatha Malinowski discuss how the new Sector Liquidity Monitor in the U.S. Sector Dashboard means investors can now get sector performance, factor exposure, fundamental metrics and liquidity all in one resource to inform sector strategy decisions.

The posts on this blog are opinions, not advice. Please read our Disclaimers.