Get Indexology® Blog updates via email.

In This List

S&P 500: America's Benchmark

The Case for the S&P Dividend Aristocrats in Today’s Market

Choppy Chips

Don’t Call It a Comeback: Value’s Ascendance Continues in Australian Equities

Mexico Rating Actions: Market Impact through the Lens of Bond Indices

S&P 500: America's Benchmark

Cathy Clay, CEO of S&P Dow Jones Indices, and Lynn Martin, President of the NYSE Group, recently met on the trading floor of the New York Stock Exchange to discuss how the S&P 500 connects America’s past, present and future.  

Drawing on the index’s nearly 70-year legacy, they examine what has made the benchmark so iconic—its role in helping Americans participate in the economy, the enduring strength of the NYSE Group and S&P Dow Jones Indices partnership, and the way it continues to serve as a trusted compass for today’s markets. 

The posts on this blog are opinions, not advice. Please read our Disclaimers.

The Case for the S&P Dividend Aristocrats in Today’s Market

Contributor Image
Kevin Multhaup

Senior Analyst, Factors and Dividends Indices

S&P Dow Jones Indices

With broad market benchmarks trading at historically low yields and elevated valuations, it’s timely to examine the performance of the S&P Dividend Aristocrats® Index Series in today’s market environment. These indices track companies with a consistent record of dividend growth and currently offer a combination of strong yields and reasonable valuations. Historically, they have also exhibited defensive qualities, which is relevant in an environment characterized by market volatility and a risk of pullbacks. Furthermore, as benchmark concentration has risen and technology stocks have come to dominate broad market indices, dividend-focused strategies show diversification characteristics owing to their broad sector profiles and sources of performance.

Methodology Review

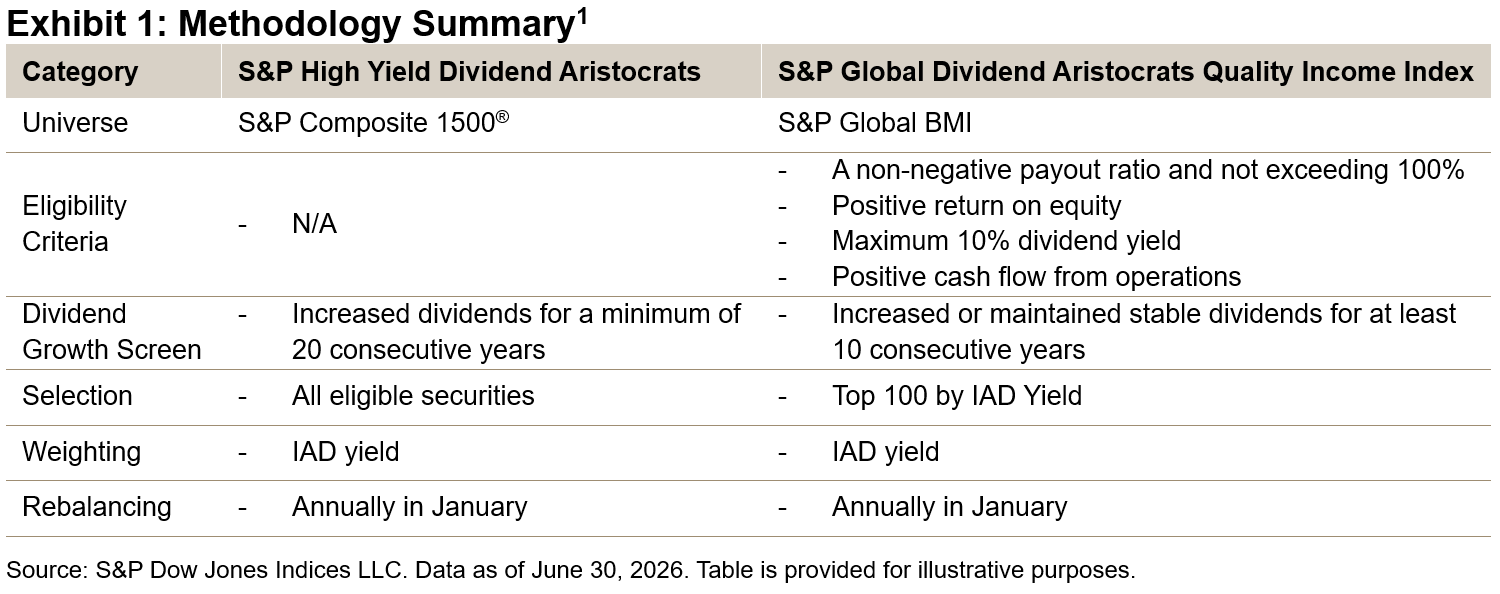
The S&P Dividend Aristocrats Indices track companies that have followed a managed-dividends policy of consistently increasing dividends every year for several years. The S&P High Yield Dividend Aristocrats considers 20 consecutive years of increasing dividends, whereas the S&P Global Dividend Aristocrats Quality Income Index requires 10 consecutive years of increasing or stable dividends, alongside fundamentals-based quality metrics focused on assessing the sustainability of companies’ dividend payout policies. Both indices are weighted by indicated annual dividend yield (IAD yield), helping maintain a strong focus on income while prioritizing inclusion of companies with demonstrated dividend growth characteristics.

Dividend Yields Significantly Exceed Benchmark Universes

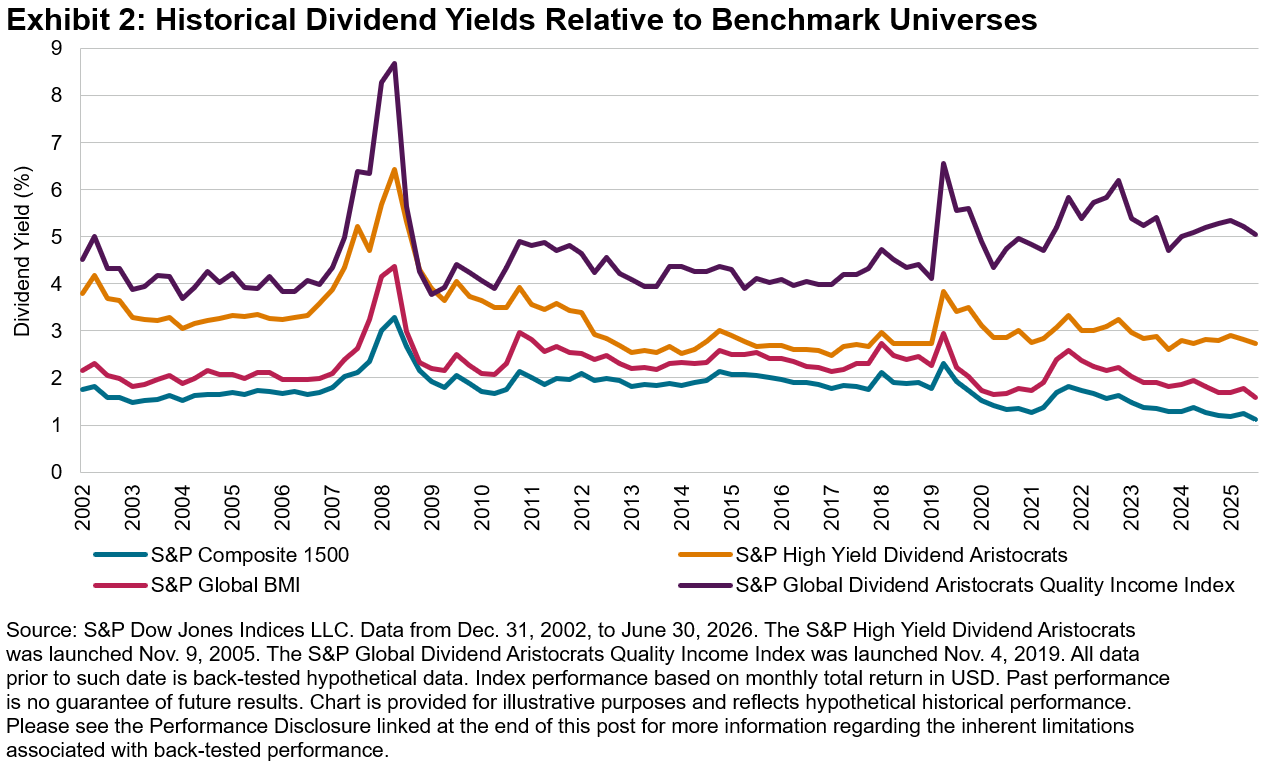
Dividend yield is a core metric for any income-focused strategy. Both the S&P High Yield Dividend Aristocrats and the S&P Global Dividend Aristocrats Quality Income Index have historically posted yields over twice those of their respective benchmarks (see Exhibit 2).

Valuations Remain Strong Relative to Benchmarks

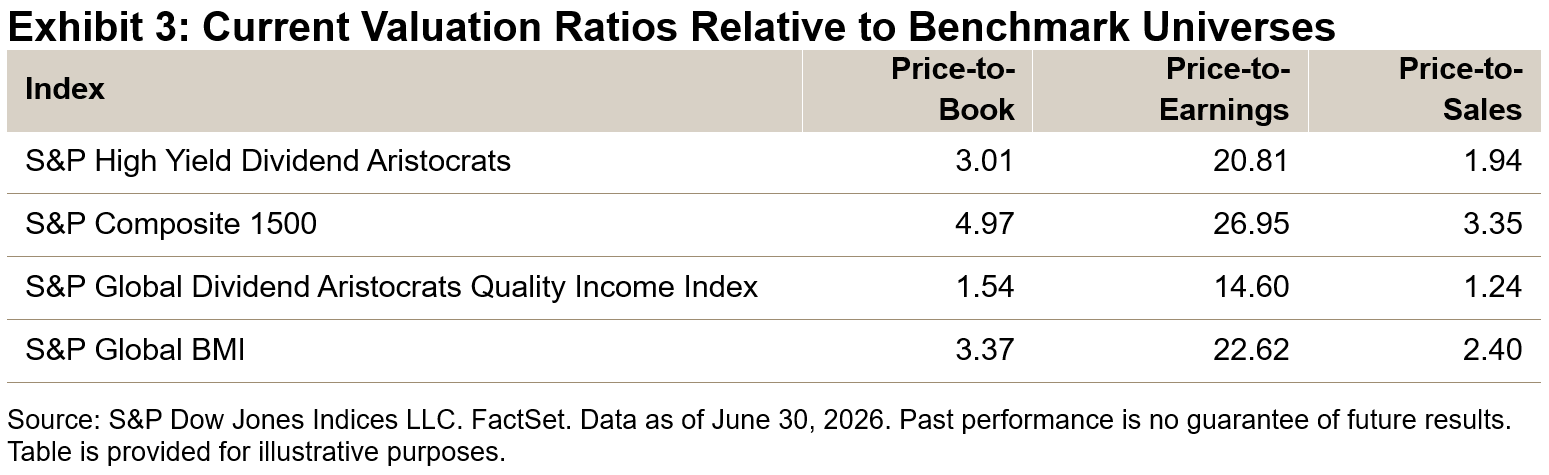
Following an extended bull market and historically elevated valuations—particularly within the Information Technology sector—Exhibit 3 highlights that both indices continue to trade at meaningful valuation discounts relative to their respective benchmark universes.

Sector Diversification

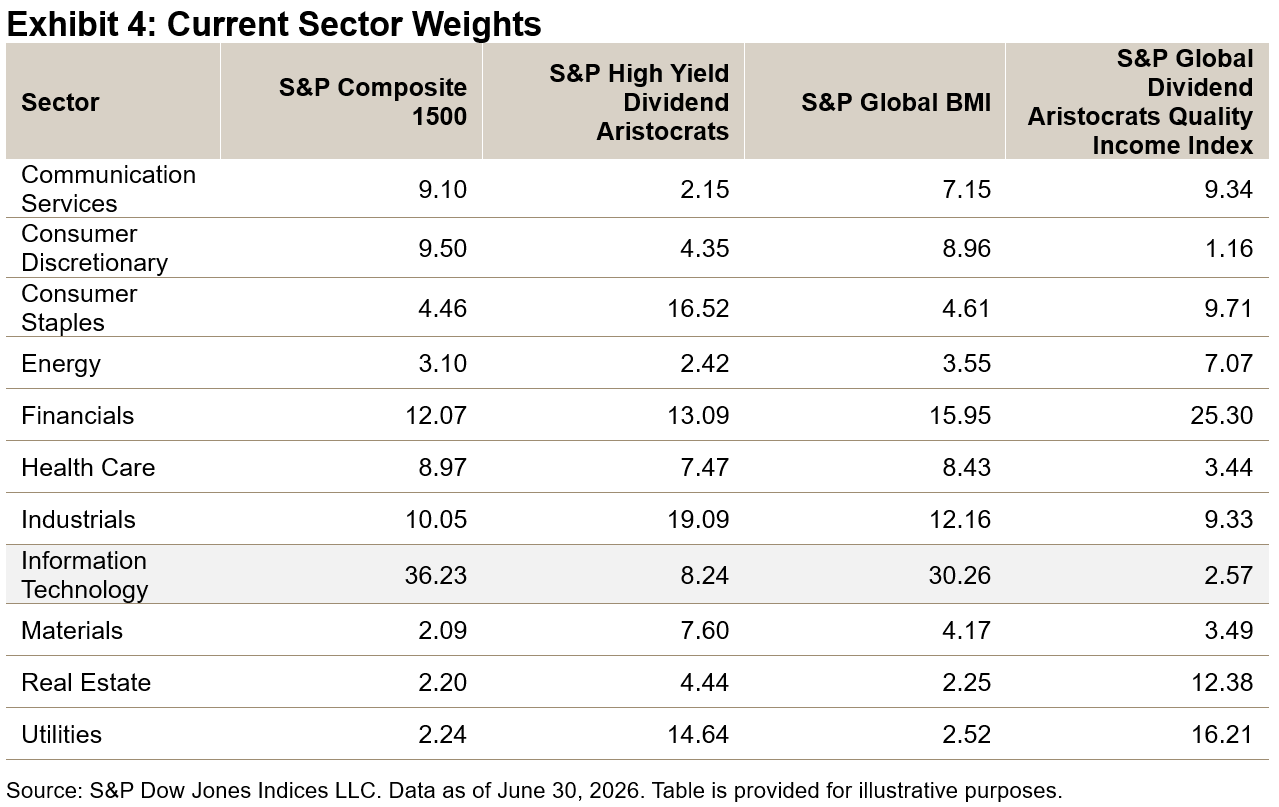
Exhibit 4 shows the diversification characteristics of these indices, demonstrating a significant underweight in Information Technology while increasing weight in traditionally defensive sectors such Consumer Staples and Utilities.

Assessing Historical Defensive Characteristics

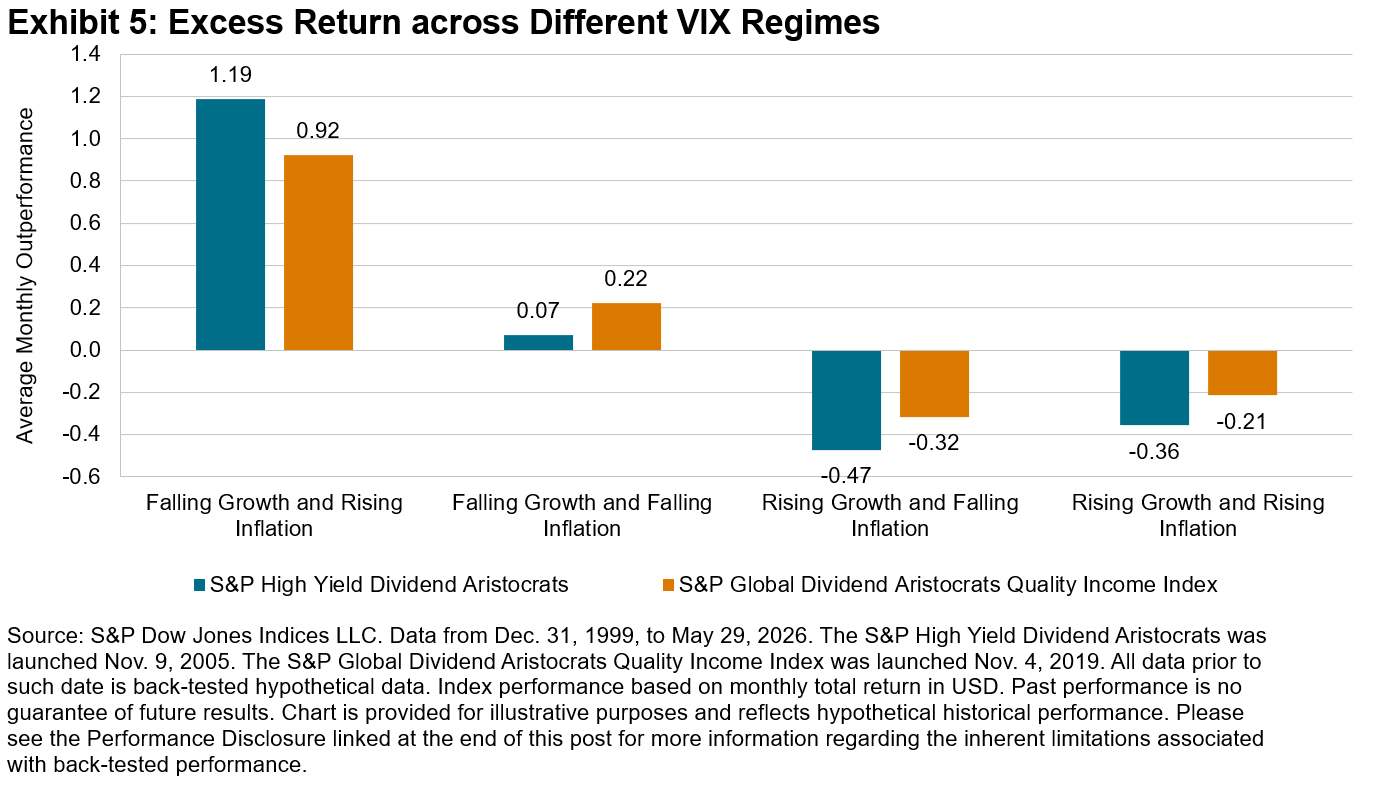
The S&P Dividend Aristocrats Indices have historically demonstrated stronger performance in weaker markets. Both indices have often delivered better relative performance during periods of higher volatility—especially when VIX® rises above 20, a level often linked to increased market stress (see Exhibit 5).

Examining Performance over the Long Term

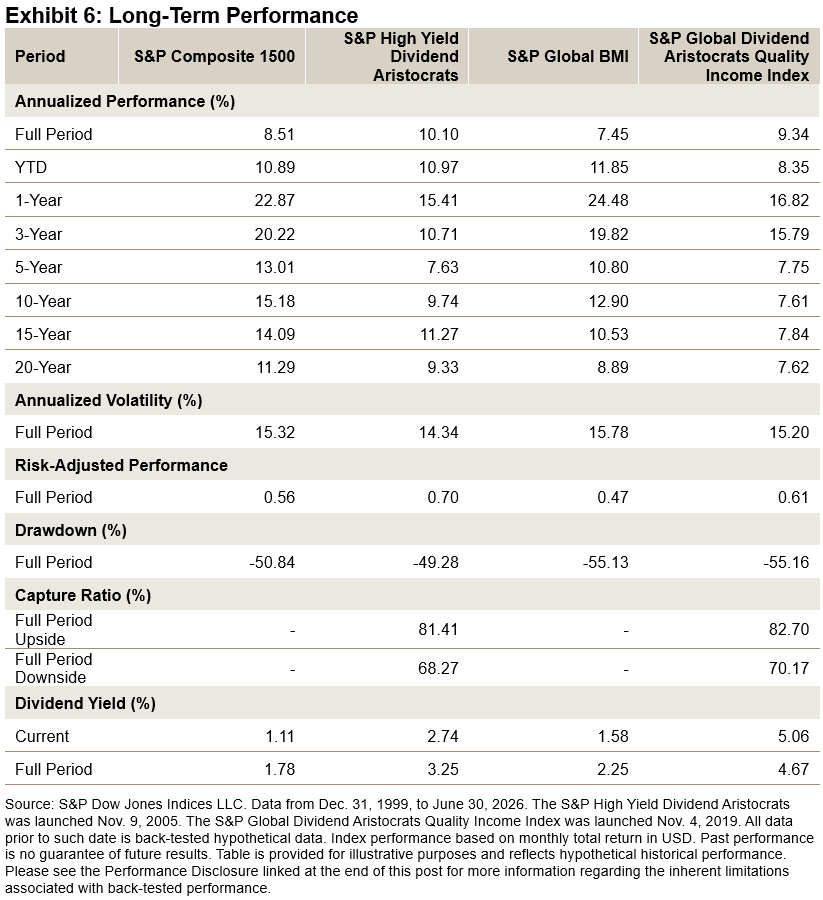
Over the long term, both the S&P High Yield Dividend Aristocrats and S&P Global Dividend Aristocrats Quality Income Index have outperformed their respective benchmarks on an absolute and risk-adjusted basis (see Exhibit 6).

Conclusion

Strong Q1 2026 inflows into dividend strategies suggest renewed demand for income and defensiveness amid heightened volatility and evolving macroeconomic conditions. The S&P Dividend Aristocrats Indices methodology focuses on companies with durable dividend growth and consistent income—traits often associated with mature, stable companies—which tend to have more robust operating models and have historically shown resilience in difficult markets while providing a measure of consistent dividend yield and diversification.

1 Please see the S&P Dividend Aristocrats Indices Methodology for more information.


The posts on this blog are opinions, not advice. Please read our Disclaimers.
Choppy Chips

Contributor Image
Nick Didio

Quantitative Associate, Index Investment Strategy

S&P Dow Jones Indices

The U.S. market has been buffeted by swings in the performance of semiconductor companies, as investors have become increasingly anxious about the outlook for the tech sector and whether a regime change is in store. The choppiness has been global in nature, sparked by a steep sell-off in Korean chipmakers, with the S&P Korea BMI down 10.9% for the month as of July 15, 2026. The parallel between the two countries is notable, and although both markets vary widely in size, outperformance in both has been driven by a handful of semiconductor companies.1, 2, 3 The connections between the two markets strengthened upon the debut of chipmaker SK Hynix’s ADR listing, which shed more than 10% on its second trading day before rising more than 25% the following day.4

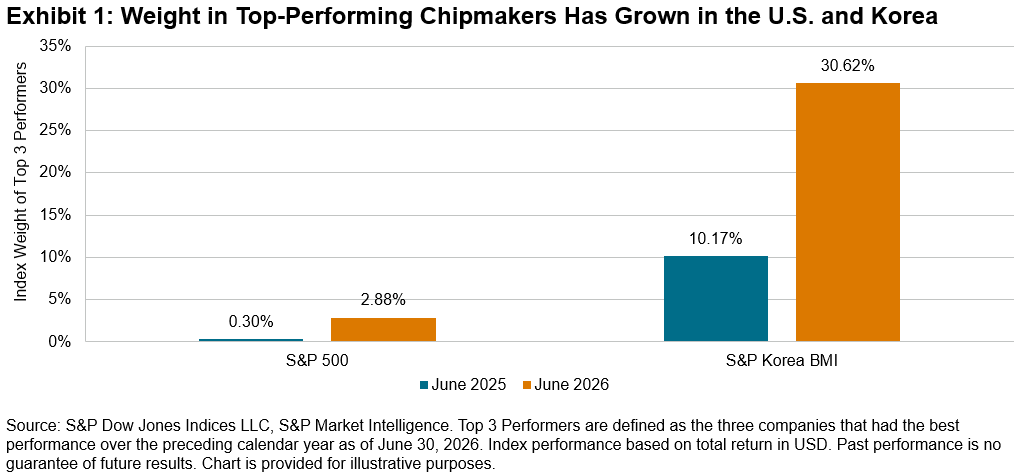
Exhibit 1 demonstrates how the weight of the three top-performing companies within each index have grown. The S&P Korea BMI’s performance, up 169% over the past year through June 30, 2026, was driven by chipmakers and hardware suppliers including PSK, SK Hynix and its holding company SK Square.5 The S&P 500® was up 22% over the same time frame, and its top three performers—Sandisk, Western Digital and Micron—were, perhaps not coincidentally, also chipmakers. Though smaller in absolute terms, the relative growth in index weight of the U.S. companies was significantly higher than their Korean counterparts.

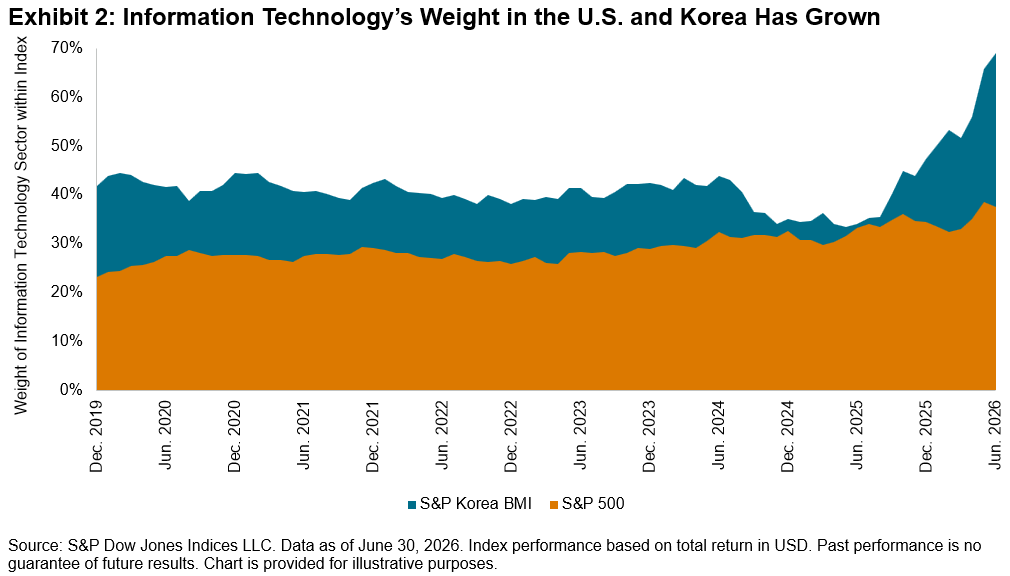
Offering a historical perspective and consistent with the rising weights of top-performing tech companies, Exhibit 2 shows that the weight of the Information Technology sector in the S&P 500 and S&P Korea BMI has grown considerably in recent years. As of June 30, 2026, Information Technology’s weight within the S&P Korea BMI was 69%, towering over the sector’s 38% weight in the S&P 500.

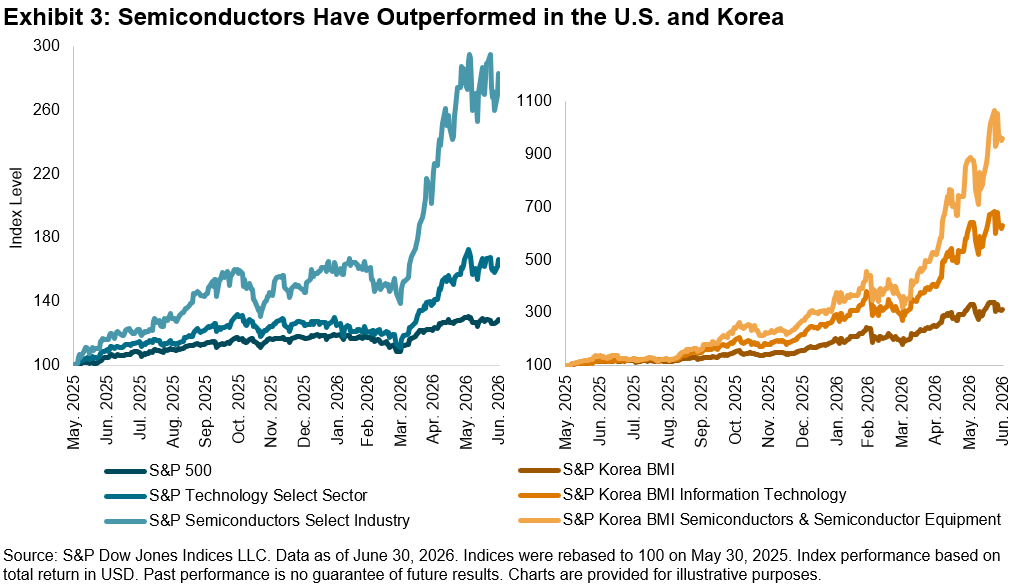
We can also examine the sources of U.S. and Korea index performance from an industry lens. As of Dec. 31, 2019, the Semiconductors & Semiconductor Equipment industry held 4% and 6% of the weight in the S&P 500 and S&P Korea BMI, respectively. By June 30, 2026, those weights had ballooned to 19% and 29%, respectively. Exhibit 3 demonstrates that the S&P Semiconductors Select Industry Index and the S&P Korea BMI Semiconductors & Semiconductor Equipment have significantly outperformed their respective sectors and country benchmarks.

While the U.S. equity market is almost 20 times larger than that of South Korea in terms of market capitalization, the countries are similar in terms of the increasing weight of chipmaker companies in their respective indices. Understanding the similarities and differences between both markets may be helpful for navigating whether semiconductors will continue to play an increasing role in the AI value chain and global markets overall.


1 Ganti, Anu, “Cashing in the Chips?” S&P Dow Jones Indices LLC, June 2, 2026.

2 Agarwal, Purvi, “Micron overtakes Meta, Tesla in market value amid relentless AI infrastructure demand,” Reuters, June 25, 2026.

3 Shan, Lee Ying, “SK Hynix surges 12% after Micron earnings; blockbuster Nasdaq listing,” CNBC, June 25, 2026.

4 Tan, Huileng, “Why SK Hynix’s wild swings aren’t only an AI story,” Business Insider, July 15, 2026

5 Samsung affiliated businesses were not included due to lower aggregate performance.

This content may be AI-assisted and is composed, reviewed, edited, and approved by S&P Global.

The posts on this blog are opinions, not advice. Please read our Disclaimers.
Don’t Call It a Comeback: Value’s Ascendance Continues in Australian Equities

Contributor Image
Sean Freer

Director, Global Exchange Indices

S&P Dow Jones Indices

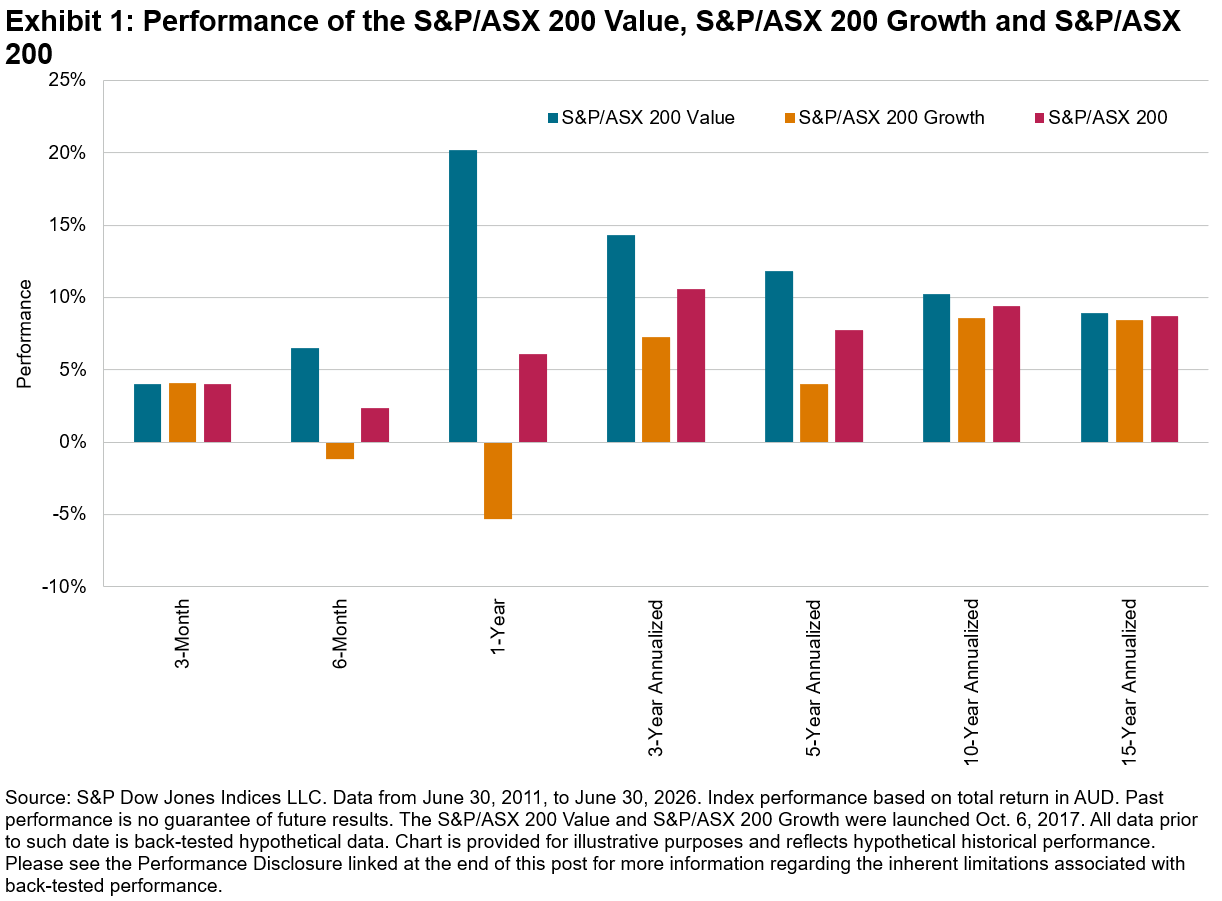
The S&P/ASX 200 Value gained 20.20% over the financial year ending June 30, 2026, outperforming the S&P/ASX 200 by more than 14% and its counterpart, the S&P/ASX 200 Growth, by more than 25%. This represents the index’s strongest one-year relative outperformance in over 16 years.

Following a long period in which Australian companies with growth characteristics outperformed in the 2010s, the rotation toward value started during the COVID-19 pandemic and has continued into the current environment of high interest rates, with the S&P ASX 200 Value outperforming the S&P/ASX 200 Growth over all time periods up to 15 years as of June 30, 2026 (see Exhibit 1).

It has been over 90 years since Columbia Business School professors Benjamin Graham and David Dodd published Security Analysis, a work that established the foundational principles of value investing. Both Graham and Dodd, along with numerous other academics and investment practitioners, have since evolved and developed the tenets of value investing. Today, the value versus growth dynamic persists in financial markets and often serves as a lens through which both active and passive investors determine investment allocations.

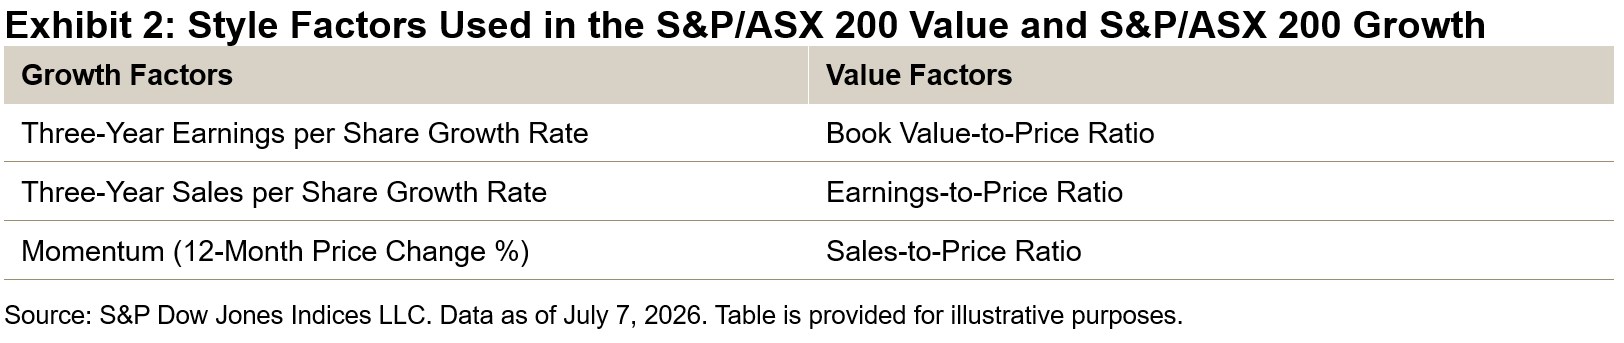
S&P Dow Jones Indices calculates value and growth barometers across global, regional and single-country indices, including the S&P/ASX 200, as previously referenced. Based on price multiples, earnings and sales growth, companies are ranked by style scores and classified as pure value, pure growth or blend. Please refer to the S&P/ASX Style Indices Methodology for more information.

Companies classified as “blend” (those ranked in the median cohort) can have their float-adjusted market capitalization proportionality split across both the value and growth indices. The style bias approach results in two distinctive indices within a given universe—for Australia, these are the S&P/ASX 200 Value and S&P/ASX 200 Growth.

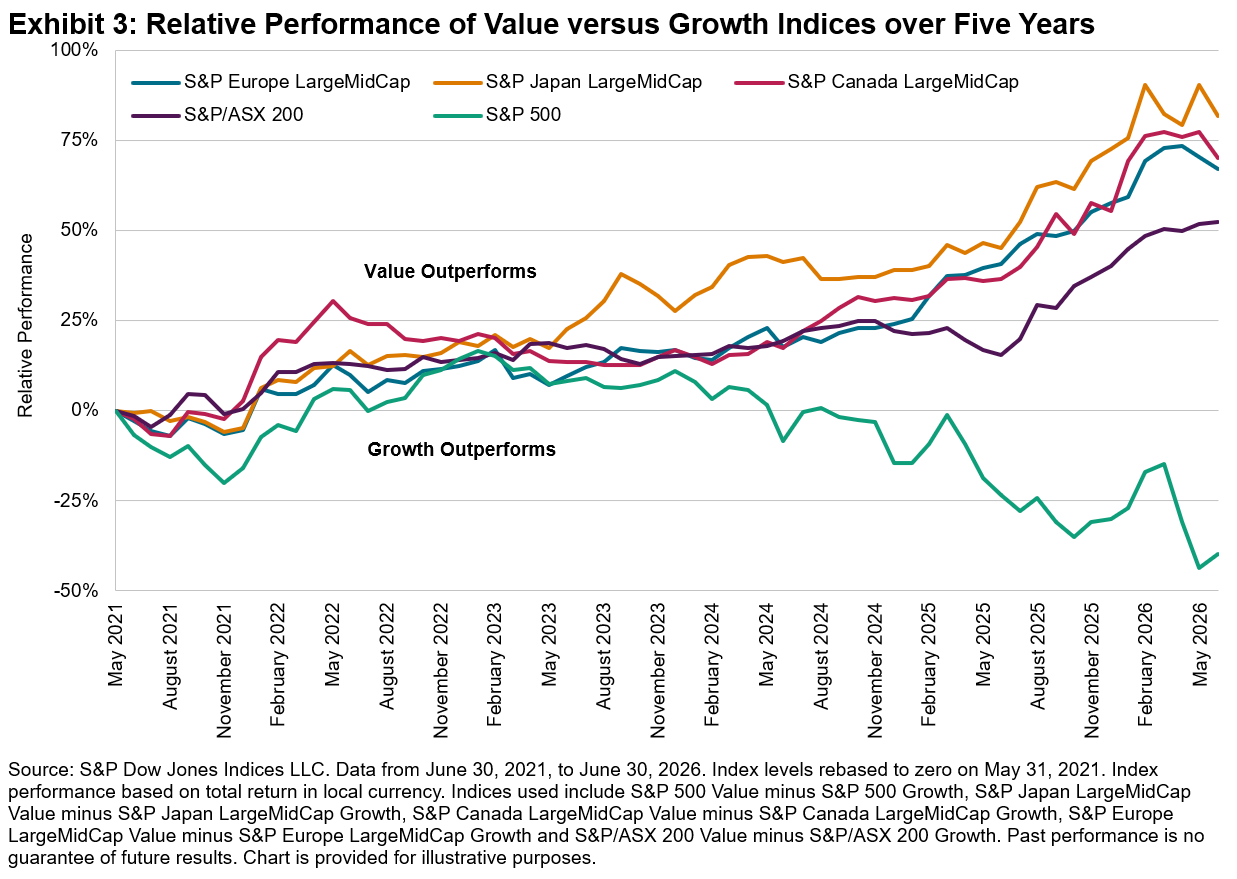
Outside the U.S. market—where performance has been largely driven by growth stocks such as the “Magnificent Seven”—value stocks have outperformed in many other developed markets. Over the past five years, value has meaningfully outpaced growth in Canada, Japan and Europe.

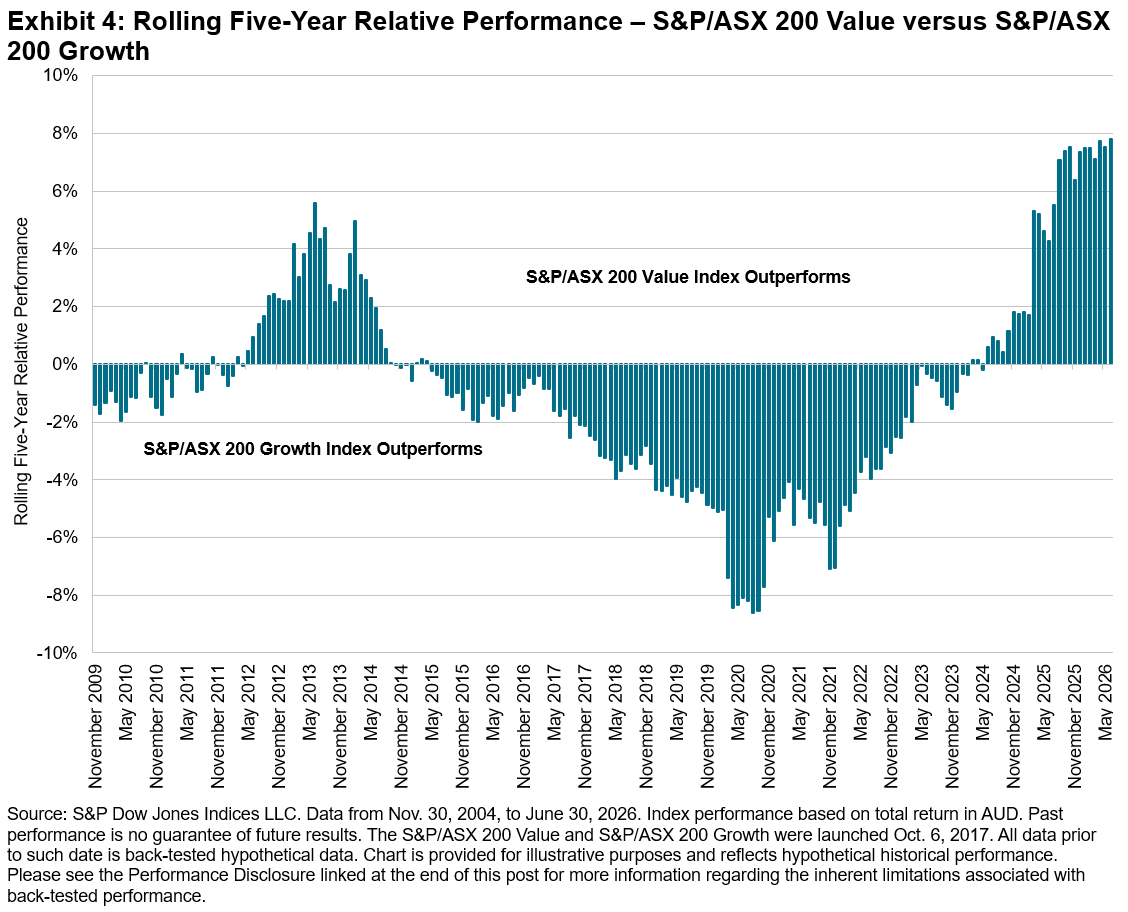
Australia has followed suit, with the S&P/ASX 200 Value outperforming the S&P/ASX 200 Growth by more than 53% on a cumulative basis over the five years ending June 30, 2026. Furthermore, the S&P/ASX 200 Value has consistently outperformed the S&P/ASX 200 Growth by more than 7% per year across rolling five-year periods throughout the 2026 financial year.

Changing Sector Composition of S&P/ASX 200 Style Indices

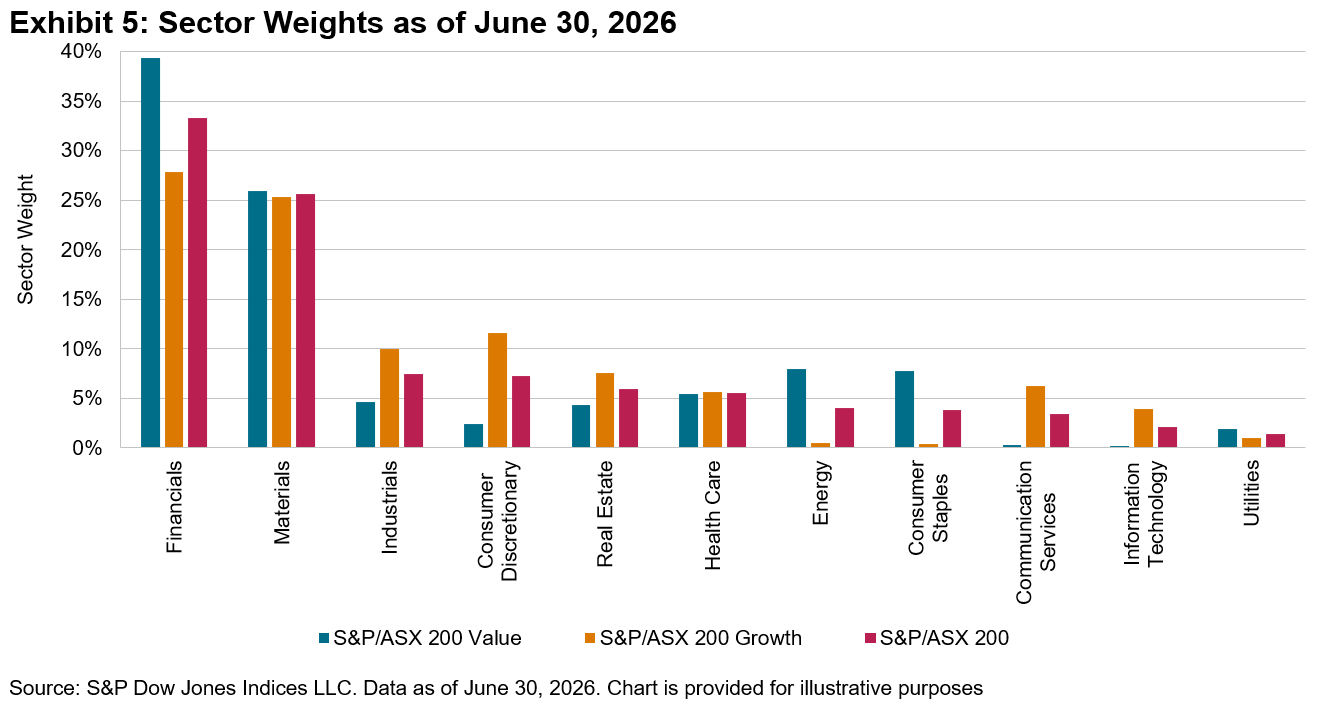
The performance drivers of the S&P/ASX 200 Style Indices extend beyond a simple Financials versus Materials sector dynamic. Value factors such as book-to-price, cash-flow-to-price and sales-to-price ratios are affected by share price movements, which can influence style scores and, in turn, the classification of companies as pure value, pure growth or blend.

As a result, the sector composition of the S&P/ASX 200 Style Indices can shift over time, reflecting changes in share prices as well as the sales and earnings growth of underlying companies.

The rising valuations among the large banks have increased Financials’ representation in the S&P/ASX 200 Growth, which now includes the Commonwealth Bank of Australia.

By contrast, the S&P/ASX 200 Value is currently below its long-term average weight in Financials and above its long-term average weight in Materials, as of June 30, 2026. The weight of Materials has increased by approximately 20% over the five years leading up to June 30, 2026, while Financials’ weight has declined.

Conclusion

Australian market participants have historically been less style-aware in their domestic equity allocations than institutional and international investors. Given their distinct performance characteristics, the S&P/ASX 200 Growth and S&P/ASX 200 Value offer a recognized framework for market participants and academics to assess market dynamics relative to the broad S&P/ASX 200.

This content may be AI-assisted and is composed, reviewed, edited, and approved by S&P Global.

The posts on this blog are opinions, not advice. Please read our Disclaimers.
Mexico Rating Actions: Market Impact through the Lens of Bond Indices

Contributor Image
Moyu Wang

Associate Director, Fixed Income Product Management

S&P Dow Jones Indices

Mexico’s recent rating actions have brought renewed attention to the country’s sovereign credit profile. Moody’s downgraded Mexico in May 2026, while S&P Global Ratings revised its outlook to negative. For fixed income investors, the key question is not only what changed from a ratings perspective, but also how those events translated into market performance.

Bond indices provide a useful lens through which to assess these effects. Comparing Mexico’s rating actions in 2020, 2022 and 2026, the data suggest a nuanced conclusion: Mexican risk repriced following these events, but the market reaction has generally appeared contained rather than disruptive.

Sovereign Bonds: Repricing, but Context Matters

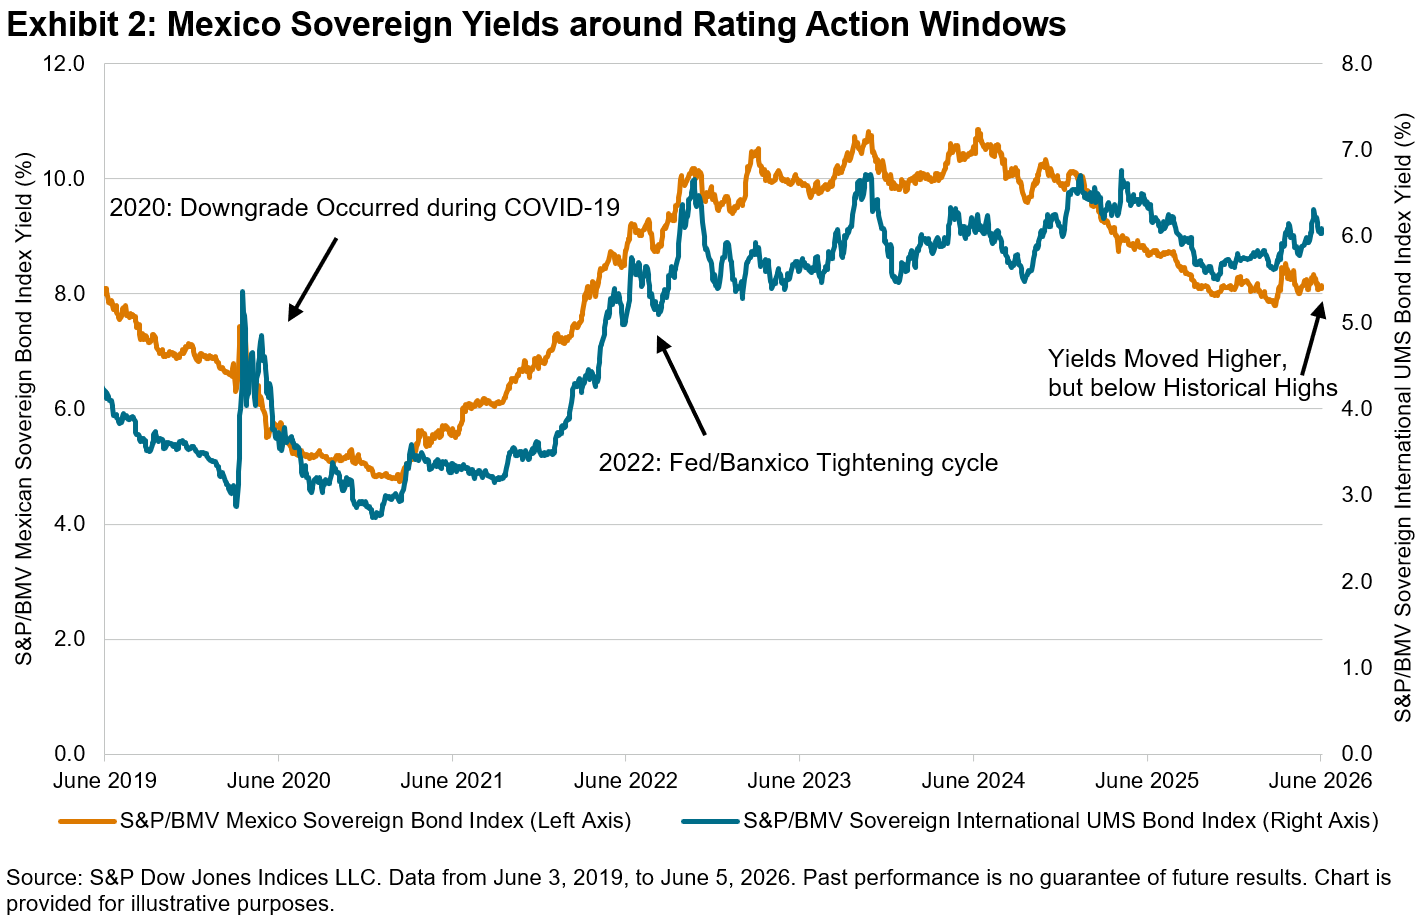
Mexican sovereign yields moved higher around the rating actions, but each episode occurred against a different market backdrop.

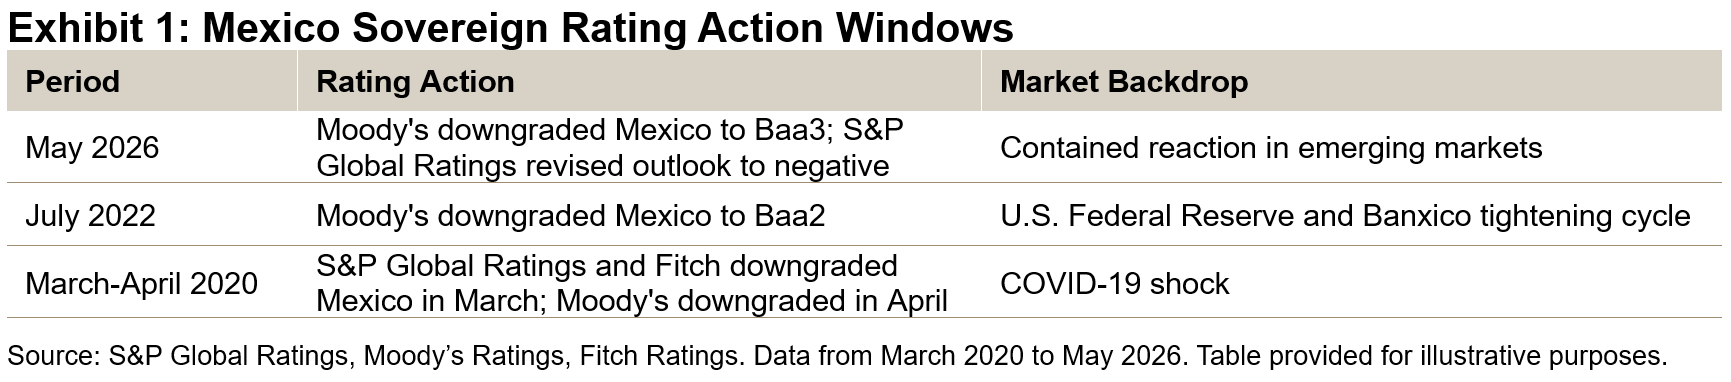
In 2020, S&P Global Ratings and Fitch downgraded Mexico in March, followed by Moody’s in April. However, those rating actions coincided with the global COVID-19 market shock, making the moves difficult to separate from broader risk aversion.

In July 2022, Moody’s downgraded Mexico again during a period of aggressive tightening by the Fed and Banxico, so higher yields may have reflected a combination of both interest rate pressures and credit concerns.

In 2026, yields rose around the May rating downgrade, suggesting some repricing of sovereign risk. However, the increase remained below levels observed during periods of prior market stress, pointing to repricing rather than a broader market dislocation.

Relative Performance: Broadly Aligned with Emerging Market Benchmarks

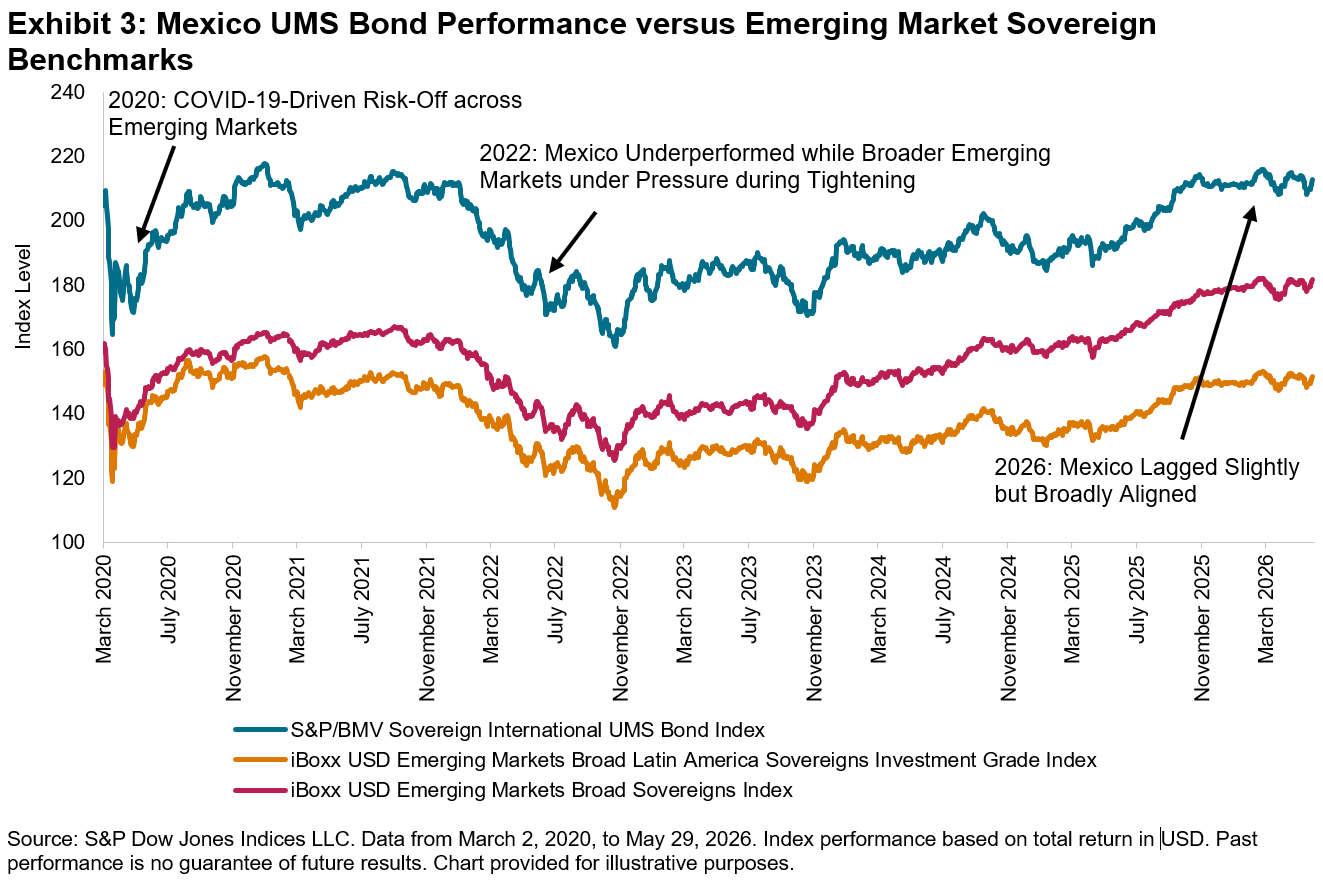
Total return performance tells a similar story. UMS bonds saw some weakness around rating action windows, but performance generally moved in line with Latin American and broader emerging market sovereign benchmarks.

In 2020, UMS bonds sold off sharply, broadly in line with Latin American and emerging market sovereigns during the COVID-19 shock. In 2022, Mexico showed modest underperformance around the July downgrade, but other emerging market sovereigns were also under pressure amid Fed tightening. In 2026, Mexico lagged modestly during the May pullback, but its performance remained broadly aligned with emerging market sovereign benchmarks, with early signs of narrowing in June.

The key message is that Mexican sovereign bonds repriced, but index performance does not suggest a standalone or strong Mexico selloff.

FX Translation: S&P/BMV Index Versions Highlight the Currency Effect

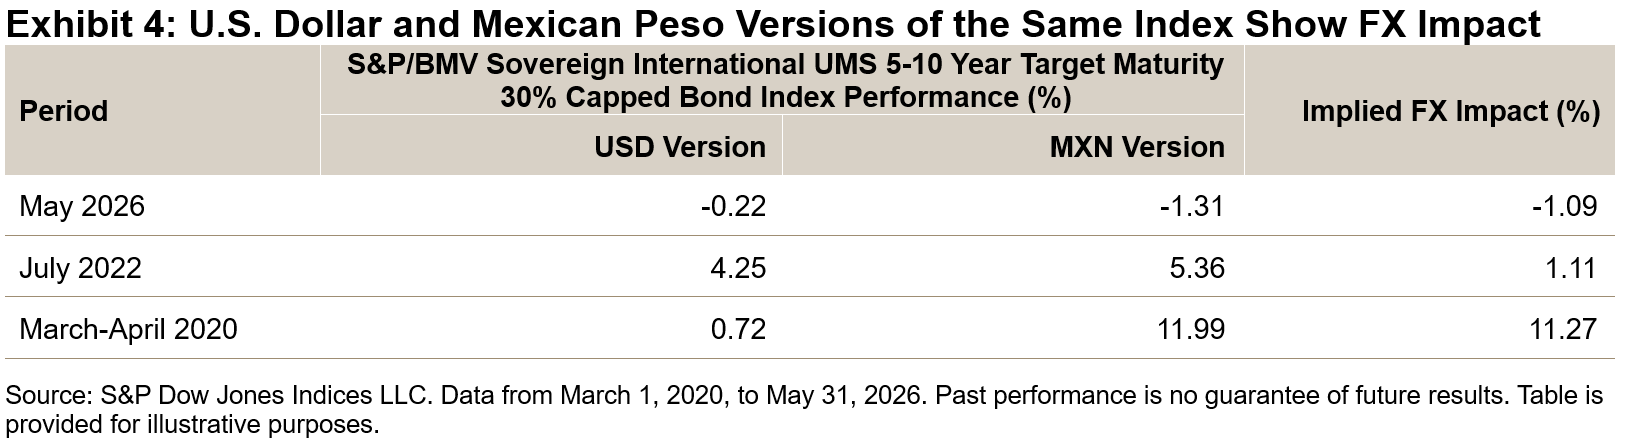
Foreign exchange (FX) matters for Mexican peso-based holders of U.S. dollar-denominated Mexico sovereign debt. Comparing the U.S. dollar and Mexican peso versions of the S&P/BMV Sovereign International UMS 5–10 Year Target Maturity 30% Capped Bond Index helps isolate the currency effect. Across the rating action windows reviewed, FX either reduced or enhanced performance reported in Mexican pesos.

In May 2026, Mexican peso strength reduced performance reported in that currency by approximately 1.09%, while in July 2022 and March-April 2020, FX translation added to Mexican peso-reported performance.

The index comparison shows that the credit signal did not consistently translate into Mexican peso weakness; rather, FX appeared to be influenced by broader factors.

Conclusion: Isolate the Drivers of Mexican Sovereign Debt Performance

The practical takeaway is that evaluating Mexican sovereign debt could involve more than a single risk factor. A more precise view distinguishes between sovereign credit repricing, local rates, broader emerging market risk sentiment and currency effects.

Mexico’s rating headlines matter, but the index data suggest they may be better viewed in a broader market context. Across the periods observed, Mexican UMS bonds generally moved in tandem with Latin American and broader emerging market sovereign benchmarks.


The author would like to thank Sofia Lozada for her contributions to this blog.

This content may be AI-assisted and is composed, reviewed, edited, and approved by S&P Global.

The posts on this blog are opinions, not advice. Please read our Disclaimers.