Get Indexology® Blog updates via email.

In This List

A Three-Year Milestone: Revisiting the S&P 500 Sector-Neutral Dividend Aristocrats Index

A New Normal for Institutional ETF Usage

Anchoring Equity to Economic Activity: The Power of Revenue Weighting

Tracking High Forecast Dividend Yield in Australia: S&P/ASX 200 High Yield Select Index

Regimes, Reversals and Risk

A Three-Year Milestone: Revisiting the S&P 500 Sector-Neutral Dividend Aristocrats Index

Contributor Image
George Valantasis

Director, Factors and Dividends

S&P Dow Jones Indices

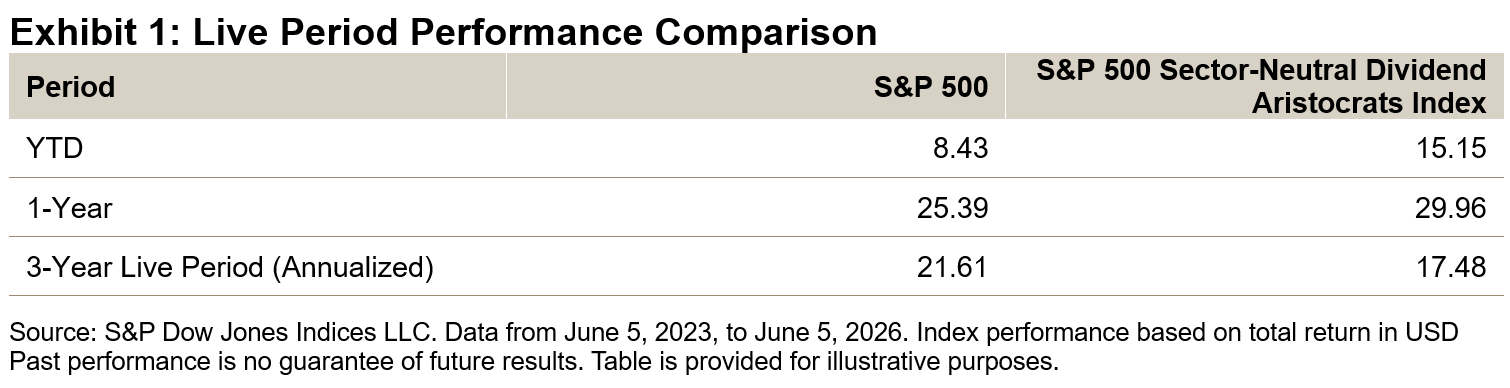
In June 2023, S&P DJI expanded the S&P Dividend Aristocrats® Series with the launch of the S&P 500® Sector-Neutral Dividend Aristocrats Index. The addition proved timely, as over the past three years, the technology-driven Information Technology and Communication Services sectors have fueled much of the S&P 500’s significant gains amid the rise of AI. While most dividend strategies have notably underperformed during this period due to their underexposure to these sectors, the sector-neutral design of the S&P 500 Sector-Neutral Dividend Aristocrats Index has clearly enabled it to keep pace with—and even outperform—the S&P 500 in recent times (see Exhibit 1).

In celebration of the index’s three-year milestone, this blog will review its short- and long-term performance, offer a quick overview of its methodology and highlight its current key attributes—such as dividend yield and valuation—which remain compelling compared to the S&P 500 today.

Performance

The S&P 500 Sector-Neutral Dividend Aristocrats Index has outperformed the S&P 500 on both a one-year and YTD basis, while also keeping pace with the S&P 500 over the three-year live period (see Exhibit 1). The strong recent performance is notable for a dividend-focused strategy, considering that the S&P 500’s gains have been predominantly driven by high momentum, growth-oriented technology companies capitalizing on the AI boom.
Methodology Overview

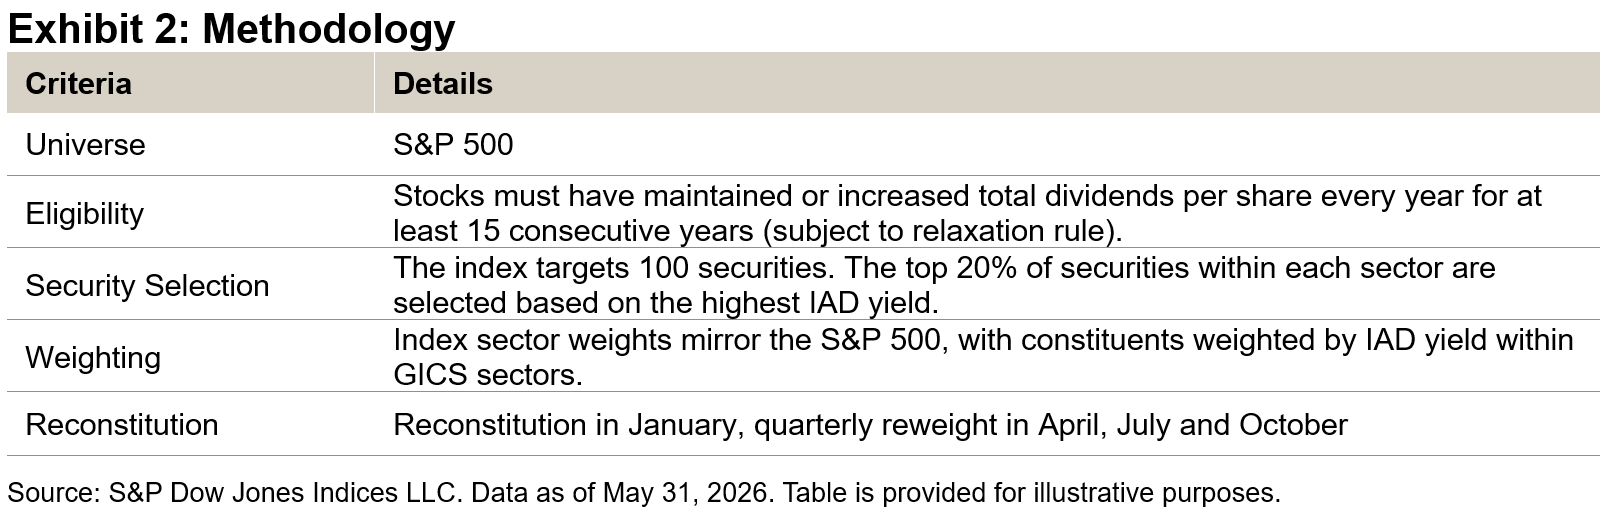
The S&P 500 Sector-Neutral Dividend Aristocrats Index starts by screening for companies that have maintained or increased dividend per share for at least 15 consecutive years, subject to a relaxation rule. From this subset, the index then selects the top 20% of companies within each GICS® sector based on the highest indicated annualized dividend (IAD) yield.
Performance Comparison

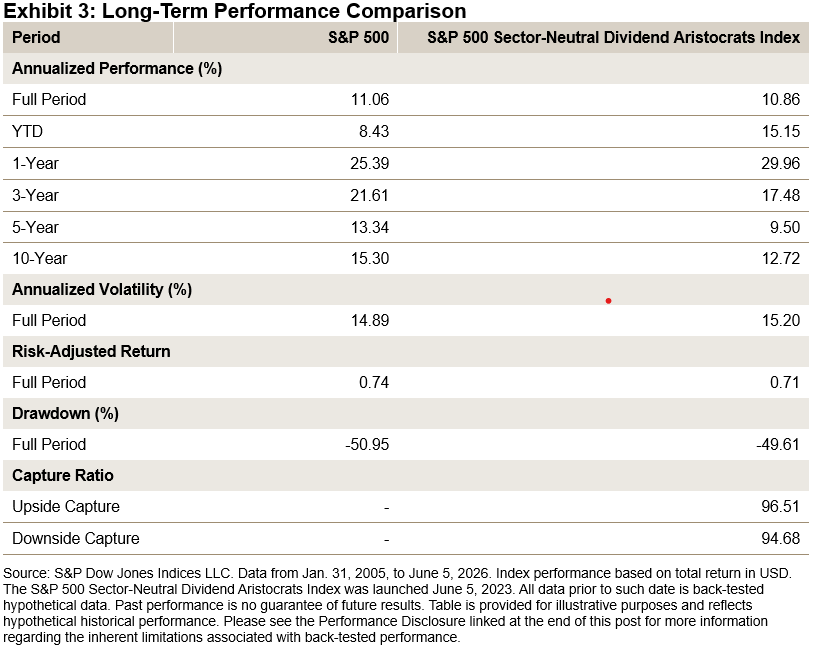
Over the back-tested period since January 2005, the S&P 500 Sector-Neutral Dividend Aristocrats Index has kept pace with the S&P 500, delivering an impressive double-digit annualized gain for more than twenty years. The index delivered this performance while also showing moderate downside protection, as evidenced by its downside capture ratio of 94.68.
Index Characteristics

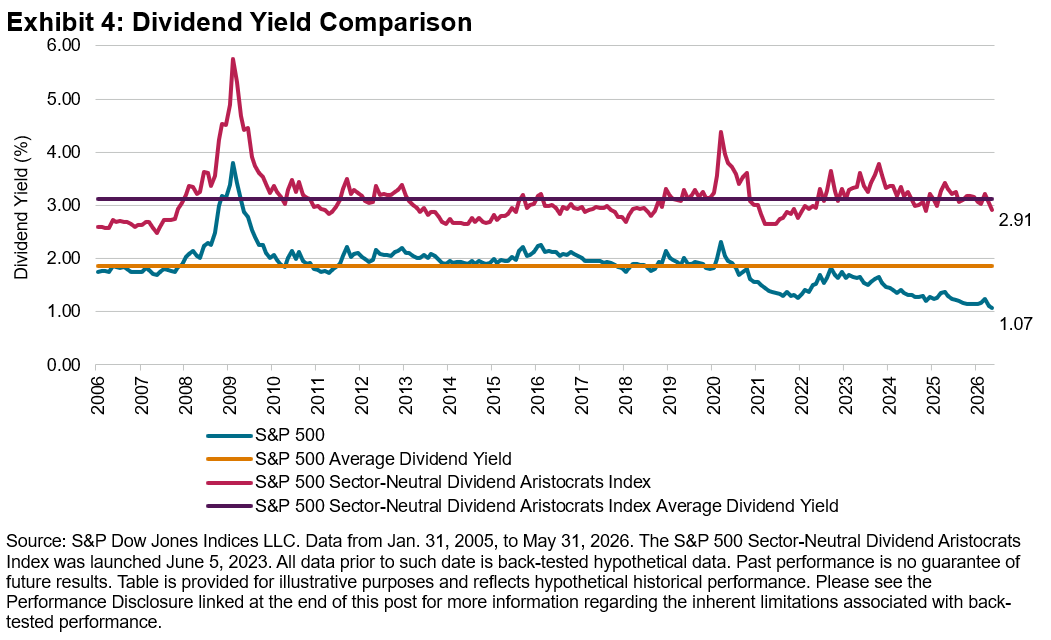
Exhibit 4 shows that as of May 31, 2026, the S&P 500 Sector-Neutral Dividend Aristocrats Index yielded 2.91%—2.7 times the S&P 500’s 1.07%, which is the lowest yield for the S&P 500 since January 2005, the beginning of the studied period. The S&P 500 Sector-Neutral Dividend Aristocrats Index has distinguished itself in today’s market environment by delivering a significantly higher yield than the S&P 500, while steering clear of large sector bets amid this period of technological transformation.
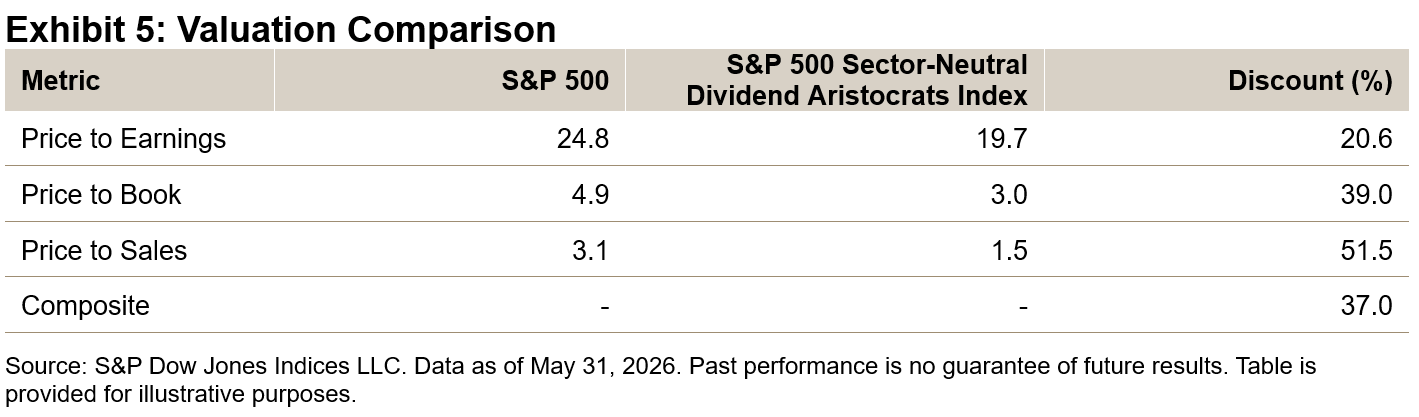
As of May 31, 2026, the S&P 500 Sector-Neutral Dividend Aristocrats Index traded at a significant discount to the S&P 500 across all three major valuation metrics (see Exhibit 5). On average, it traded at a discount of 37% compared to the S&P 500.
Conclusion

The sector-neutral design of the S&P 500 Sector-Neutral Dividend Aristocrats Index has been a significant advantage, allowing it to outperform both the S&P 500 and most other dividend strategies over 2025 and YTD. Currently, the index shows a markedly higher dividend yield than the S&P 500—while also trading at a notable discount. These characteristics are notable, given they are achieved without any sector bets relative to the S&P 500—which could be an important advantage during this distinctive period of technological change.

The posts on this blog are opinions, not advice. Please read our Disclaimers.

A New Normal for Institutional ETF Usage

Contributor Image
Marcus Friedman​

Director, Head of Asset Owners Channel​

S&P Dow Jones Indices

North American institutional asset owners have been using exchange-traded funds (ETFs) for more than a decade, but the way they use them has evolved. What began as a set of short-term tactical applications—manager transitions, portfolio completion and liquidity management—has expanded into long-term strategic uses. Sizable assets are now being deployed and held in ETFs for several years across a widening set of asset classes.

To learn more about this evolving dynamic, S&P Dow Jones Indices engaged Crisil Coalition Greenwich to survey 150 institutional asset owners across channels and sizes in the U.S. and Canada.1 The findings from the study shed light on asset owners’ ETF usage, the benefits from their perspective and their key evaluation criteria.

Why Asset Owners Are Turning to ETFs

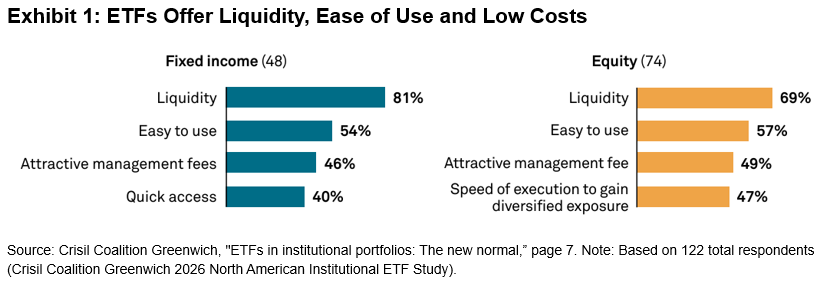
Institutional allocators point to a consistent set of characteristics when describing why they hold ETFs. Liquidity ranks first in both equities and fixed income. Ease of use, low management fees and quick access to markets follow closely behind (see Exhibit 1).2 Together, these attributes have outweighed the benefits of other investment vehicles in certain instances. In fact, institutional asset owners report using ETFs to replace wrappers they have historically relied on for index-based and active strategies, including index mutual funds, institutional separate accounts and active mutual funds.3

A Growing Range of Use Cases

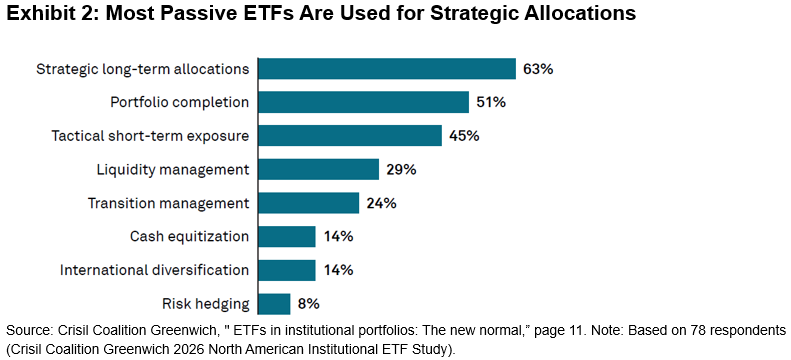
The study points to a clear shift in how ETFs are being applied. Nearly two-thirds (63%) of passive ETF assets in North American institutional asset owner portfolios are now categorized as long-term strategic allocations—the most common use cited—versus less than half (45%) for tactical short-term applications (see Exhibit 2).4 Holding periods reflect that view: 46% of allocators report average passive ETF holding periods of more than two years.5

Use cases are also extending beyond core equity beta. Institutional asset owners in the study describe using ETFs across fixed income segments and thematic strategies, and some report emerging interest in using ETFs to access private markets.6 Actively managed ETFs are in demand as well. More than 20% of institutions reported plans to increase active ETF allocations over the next three years.7

Who Is Using ETFs and What They Look For

ETF usage spans institutional asset owner types and asset bases. According to the study, over half (54%) of North American institutions now use ETFs.8 When looking across segments, 70% of insurance companies and 71% of endowments and foundations report allocating to ETFs, and adoption among public and corporate pensions continues to expand.9 Among these ETF users, the largest institutions represent the most significant investors; 62% of those with more than USD 10 billion in assets under management reported ETF holdings.10

When selecting an index-based ETF, decision makers look most closely at expense ratio, liquidity/trading volume, tracking error and benchmark construction. For active ETFs, similar criteria apply with an added emphasis on historical performance and asset manager reputation.11 Roadblocks remain, though, as the most common reason non-users cite for not investing in ETFs is lack of organizational approval. Still, more than half of non-users in the study reported they are actively considering ETF adoption.12

How Investment Universes Are Evaluated

Indices serve as the backbone for both passive and active ETF strategies, and the institutions surveyed reflect that in how they evaluate index providers. The top characteristics they look for are methodology consistency, rigor and transparency; cost efficiency for linked products; liquidity of underlying benchmarks; and historical track record.13 Those criteria align with the broader role index providers play in supporting transparency and governance across the market. As use cases extend into less-traveled corners of the market—including fixed income segments, thematic ideas and other specialized areas—the depth of index design and asset class expertise behind an ETF can become a more critical part of institutional allocators’ considerations.

A New Normal

The results of the Crisil Coalition Greenwich 2026 North American Institutional ETF Study reveal a market in which ETFs started as tactical tools and have now become a core part of institutions’ long-term investment strategies. Adoption has broadened, holding periods have lengthened and use cases continue to expand. To explore the results further, read the full report.


1 The Crisil Coalition Greenwich report “ETFs in institutional portfolios: The new normal” was sponsored by S&P Dow Jones Indices. Please see pages 2 and 3.

2 Please see page 7 of Crisil Coalition Greenwich’s “ETFs in institutional portfolios: The new normal.”

3 Please see pages 5 and 6 of Crisil Coalition Greenwich’s “ETFs in institutional portfolios: The new normal.”

4 Please see pages 2 and 11 of Crisil Coalition Greenwich’s “ETFs in institutional portfolios: The new normal.”

5 Please see page 11 of Crisil Coalition Greenwich’s “ETFs in institutional portfolios: The new normal.”

6 Please see pages 7, 12 and 15 of Crisil Coalition Greenwich’s “ETFs in institutional portfolios: The new normal.”

7 Please see page 14 of Crisil Coalition Greenwich’s “ETFs in institutional portfolios: The new normal.”

8 Please see page 3 of Crisil Coalition Greenwich’s “ETFs in institutional portfolios: The new normal.”

9 Please see page 5 of Crisil Coalition Greenwich’s “ETFs in institutional portfolios: The new normal.”

10 Please see pages 3 and 4 of Crisil Coalition Greenwich’s “ETFs in institutional portfolios: The new normal.”

11 Please see page 8 of Crisil Coalition Greenwich’s “ETFs in institutional portfolios: The new normal.”

12 Please see pages 2 and 17 of Crisil Coalition Greenwich’s “ETFs in institutional portfolios: The new normal.”

13 Please see page 10 of Crisil Coalition Greenwich’s “ETFs in institutional portfolios: The new normal.”

The posts on this blog are opinions, not advice. Please read our Disclaimers.
Anchoring Equity to Economic Activity: The Power of Revenue Weighting

Contributor Image
Wenli Bill Hao

Director, Factors and Dividends Indices, Product Management and Development

S&P Dow Jones Indices

Market-cap-weighted indices like the S&P 500® that offer a broad measure of the market have long served as the foundation of passive investing. With valuations at elevated levels and sector concentration—particularly in technology—near historic highs, we examine alternative weighting methods that may provide broader and complementary views.

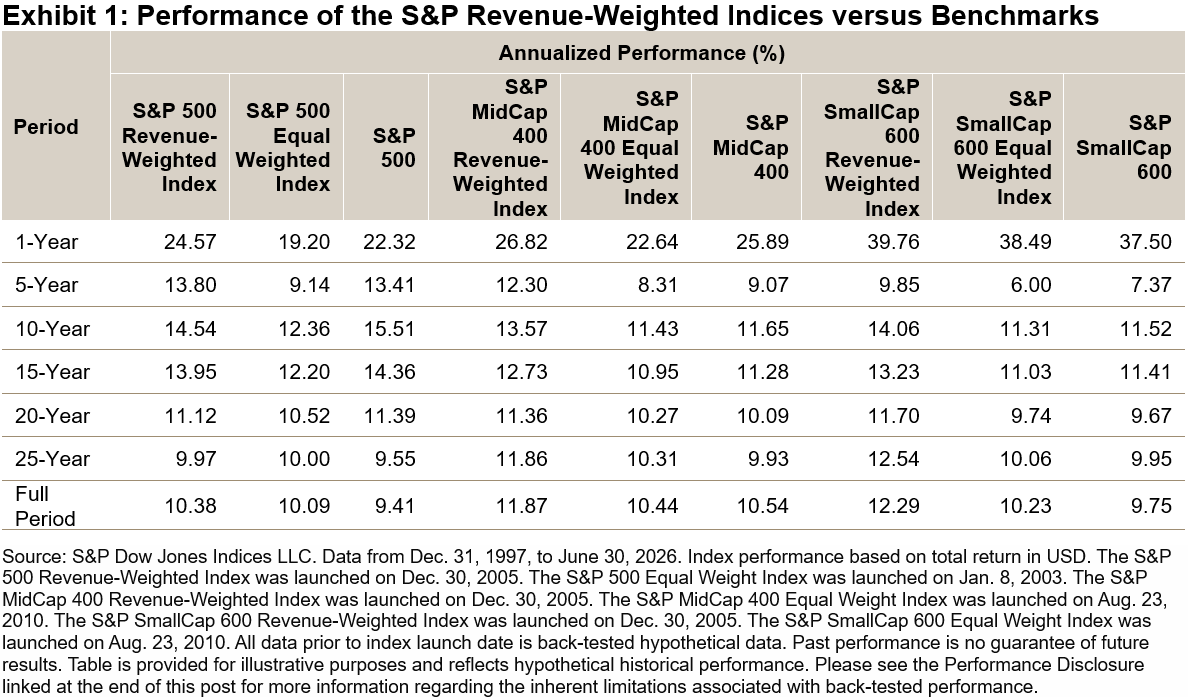
Revenue weighting offers a complementary approach: by weighting companies proportionally to their top-line sales, the S&P 500 Revenue-Weighted Index, S&P MidCap 400® Revenue-Weighted Index and S&P SmallCap 600® Revenue-Weighted Index1 anchor weights to economic activity rather than market value. These indices may exhibit broader sector diversification and lower valuation multiples, while maintaining the characteristics of passive investing.

In this blog, we review the historical performance, risk-adjusted returns, valuation characteristics and diversification effects of revenue-weighted index construction.

Long-Term Outperformance versus Benchmarks

The S&P 500 Revenue-Weighted Index has outperformed the S&P 500 as well as the S&P 500 Equal Weight Index across both short- and long-term periods. This trend extends to mid- and small-cap equities; the S&P MidCap 400 Revenue-Weighted Index and S&P SmallCap 600 Revenue-Weighted Index have also outperformed their respective equal- and market-cap-weighted benchmarks (see Exhibit 1).

Enhanced Historical Risk-Adjusted Performance

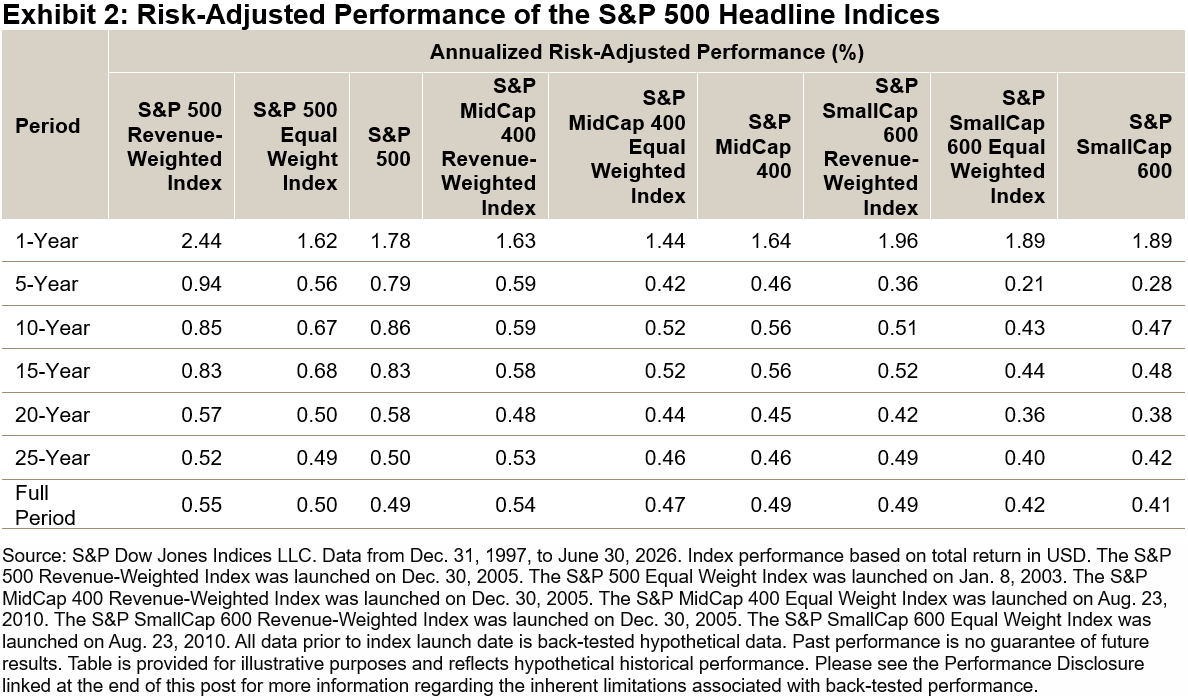
As illustrated in Exhibit 2, the revenue-weighted indices also showed superior risk-adjusted performance compared to their equal- and market-cap-weighted counterparts, across both short- and long-term horizons.

Lower Valuations Relative to Benchmark Universes

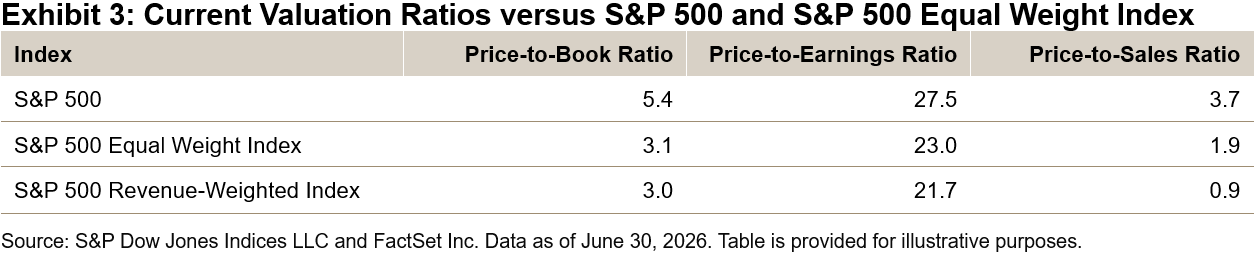
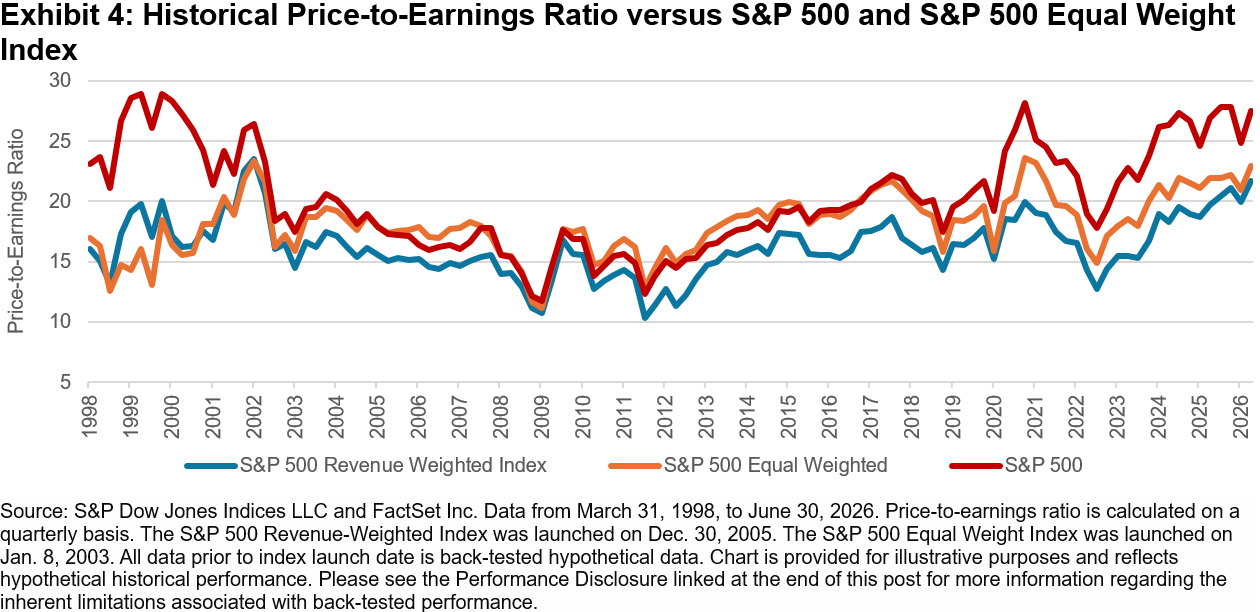
Exhibit 3 illustrates that, as of June 30, 2026, the S&P 500 Revenue-Weighted Index was trading at lower valuation ratios compared to both the S&P 500 and the S&P 500 Equal Weight Index. This trend has also been observed historically over the long term, as shown in Exhibit 4. Additionally, the mid-cap and small-cap revenue-weighted versions consistently demonstrated lower price multiples relative to their respective benchmarks.

Sector Diversification

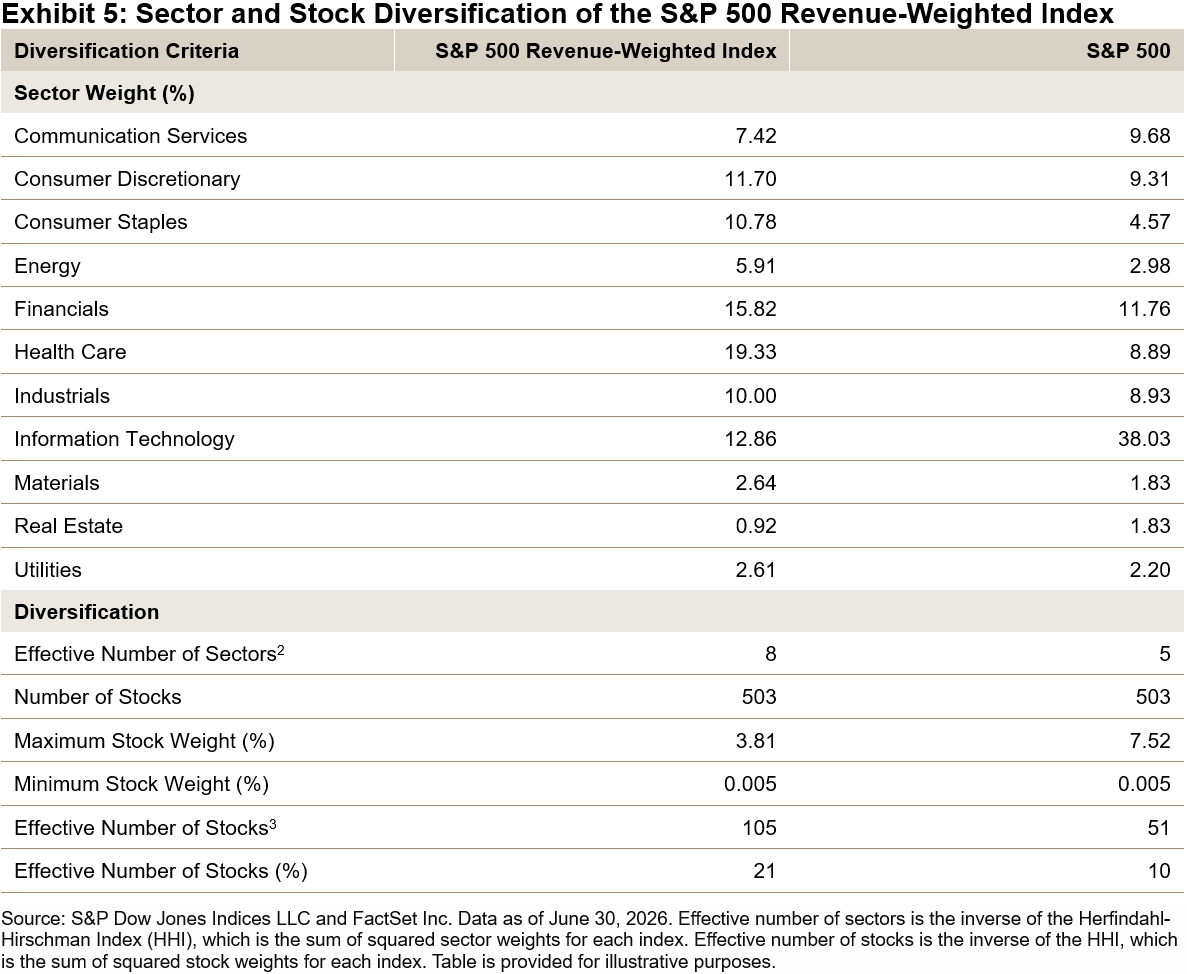
As illustrated in Exhibit 5, the Information Technology sector comprised 38.03% of the S&P 500 as of May 31, 2026—representing an all-time high. In comparison, the S&P 500 Revenue-Weighted Index demonstrated greater sector diversification, with less dispersion across sector and individual stock weights, and a higher effective number of sectors and stocks. While sector weights tend to be more balanced in mid- and small-cap indices, revenue weighting still provides a differentiated view relative to traditional benchmarks.

Conclusion

Revenue-weighted indices can be complementary to traditional market-cap-weighted indices. By anchoring company weights to revenue, these indices have historically preserved a broad equity view while reducing concentration and valuation risk. Over the back-tested history, the S&P 500 Revenue-Weighted Index, S&P MidCap 400 Revenue-Weighted Index and S&P SmallCap 600 Revenue-Weighted Index have exhibited strong total returns and risk-adjusted outperformance, along with a more pronounced value tilt and higher diversification.

1 Please refer to the S&P Revenue-Weighted Index Series Methodology for more details.

2 Effective number of sectors is the inverse of the Herfindahl-Hirschman Index (HHI), which is the sum of squared sector weights for each index.

3 Effective number of stocks is the inverse of the Herfindahl-Hirschman Index (HHI), which is the sum of squared stock weights for each index.

The posts on this blog are opinions, not advice. Please read our Disclaimers.

Tracking High Forecast Dividend Yield in Australia: S&P/ASX 200 High Yield Select Index

How are innovative dividend indices helping market participants make more informed decisions? Look under the hood of the S&P/ASX 200 High Yield Select Index, including how it screens to avoid potential yield traps, with S&P DJI’s Jason Ye and ausbiz’s Andrew Geoghegan.

The posts on this blog are opinions, not advice. Please read our Disclaimers.
Regimes, Reversals and Risk

Contributor Image
Anu Ganti

Head of U.S. Index Investment Strategy

S&P Dow Jones Indices

The S&P 500® gained 15% in Q2 2026, posting its best quarter since Q2 2020. The steady drumbeat of AI-related enthusiasm propelled the market upward despite numerous obstacles, including the war with Iran, rising inflation and fears of Fed rate hikes. However, the start of Q3 has been rocky, with a sharp sell-off in chipmakers, followed by a bounce back today, as investors struggle to assess the sustainability of the AI trade. Are these market oscillations ephemeral in nature or a sign of a regime shift?

Reflecting on the past year, the recipients of the rewards of investment in AI infrastructure have no longer been confined to the mega-cap adopters, but they are also moving toward rapidly growing memory chip suppliers housed in the semiconductors industry.1 These leaders include Sandisk Corporation, Micron Technology and stalwart Intel, which were the three top-performing stocks in The 500® YTD through June 30.

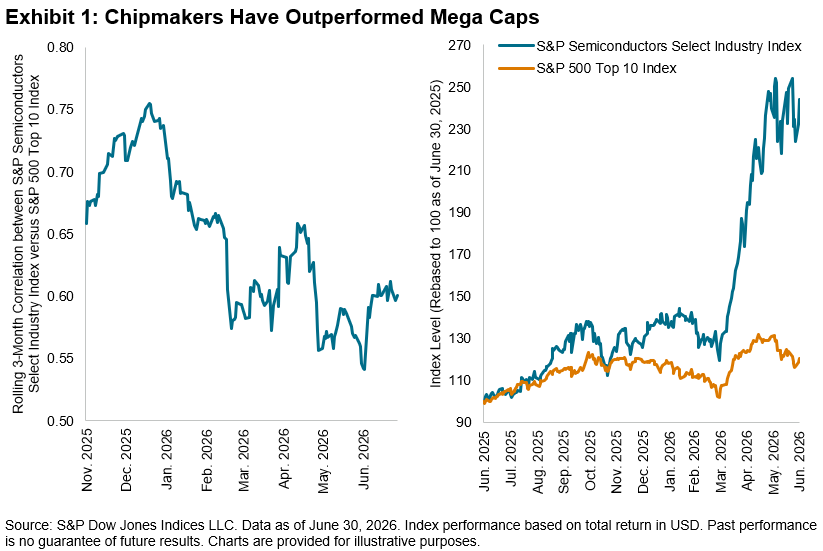
Naturally, the performance of mega caps versus chipmakers has diverged over the past year, with the S&P Semiconductors Select Industry Index’s gain of 144% trouncing the 20% gain for the S&P 500 Top 10 Index.2 Exhibit 1 shows that three-month performance correlations between the two indices fell steadily over the one-year period.

In a reversal from recent years characterized by large-cap strength, one of the consequences of the shifting performance among participants across the AI value chain has been the broadening of the rally toward smaller caps, with the S&P MidCap 400® and S&P SmallCap 600® up 14% and 20%, respectively, in Q2.

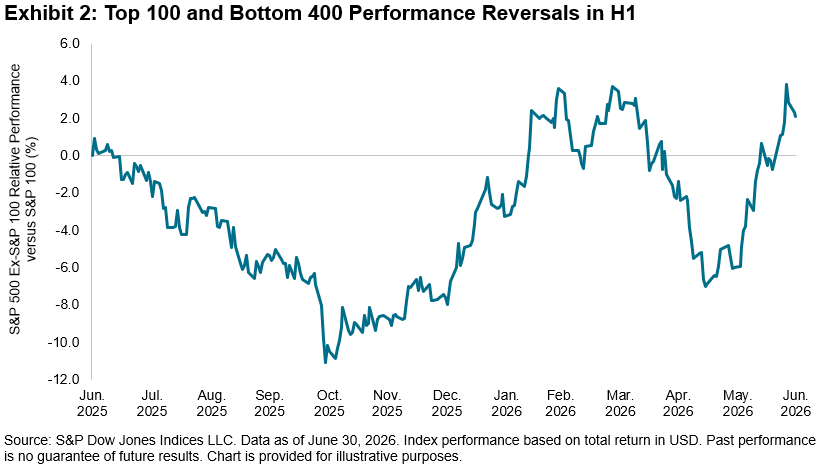
The rally expanded within large caps alone, with the S&P 500 Ex-S&P 100 Index, which not coincidentally includes Sandisk and other leading semiconductor companies like Western Digital, outperforming the S&P 100 by 2% YTD. But the path to outperformance was not linear, as illustrated in Exhibit 2, with the bottom 400 outperforming in Q1, followed by sharp underperformance as mega caps returned to favor and resuming outperformance in June as investors sought refuge among smaller, domestically oriented and defensive stocks.

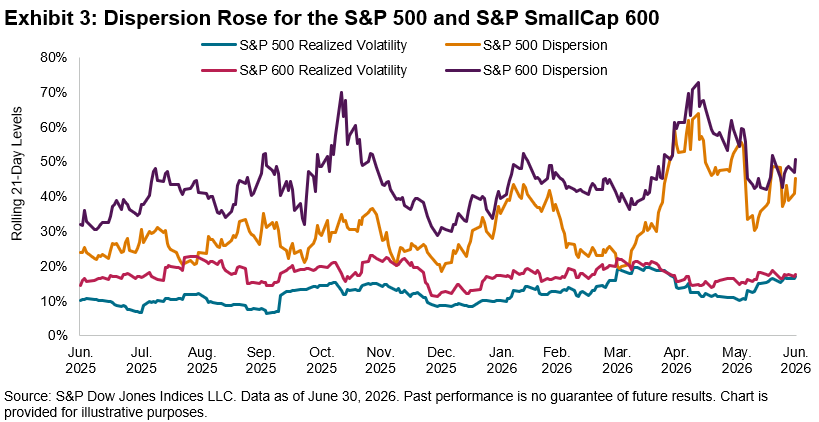
Despite these fluctuations, Exhibit 3 shows that index volatility has remained moderate, with a realized volatility of 17% for both the S&P 500 and S&P 600® for June 2026.3 Meanwhile, cross-sectional volatility—or dispersion, which measures how differently stocks are performing relative to each other—has risen to extreme levels. S&P 600 21-day dispersion reached a peak of 60% in April 2026, outpacing the prior high from November 2025 and the 55% level observed for the S&P 500.

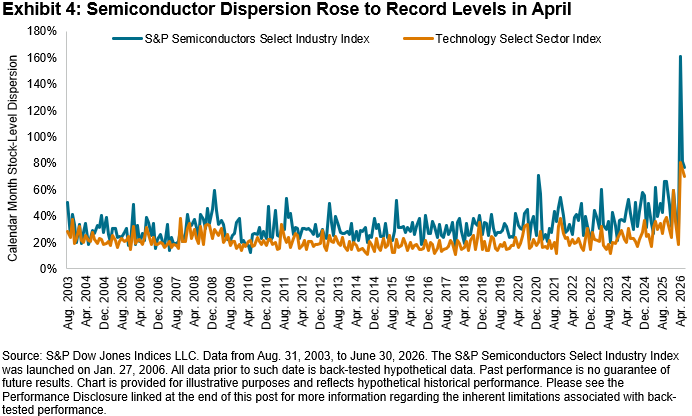
Offering a more granular view is Exhibit 4, which shows that the Technology Select Sector index’s calendar-month stock-level dispersion rose to 80% in April 2026. This level doubled to 161% for the S&P Semiconductors Select Industry Index. The lackluster reaction to Broadcom’s earnings beat and guidance, enthusiastic response to Micron’s blockbuster results, and most recently, the plunge in Samsung’s stock in spite of its earnings beat are prime examples of the increased scrutiny faced by these firms. The value of stock-selection skill rises when dispersion is high, which can mean fruitful conditions for skillful stock pickers to outperform.

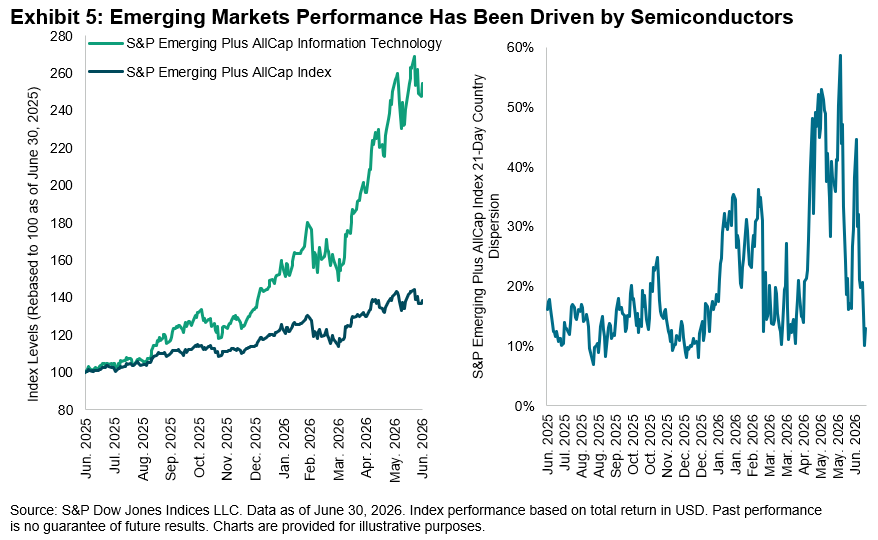
The impact of the AI boom has reverberated globally, most notably in emerging markets. We observe in Exhibit 5 that the S&P Emerging Plus AllCap Information Technology outperformed the S&P Emerging Plus AllCap Index4 by 116% since June 2025.

But the rewards have not been distributed equally across regions. Dispersion, which can also be measured at the country level, widened for the S&P Emerging Plus Index to a high of 58% in early June 2026. Countries with greater sensitivity to semiconductors like South Korea and Taiwan outperformed, although not without their share of jitters, just as we have witnessed in the U.S.

No one knows if the performance gyrations in semiconductors are a temporary blip or the sign of a new regime, but understanding the drivers of these reversals in performance and risk from a size, sector, industry and global lens may provide a nuanced perspective for market participants as they navigate H2.


1 See Ganti, Anu, “Cashing in the Chips?, S&P Dow Jones Indices LLC, June 2, 2026.

2 Performance from June 30, 2025, to June 30, 2026.

3 See Dispersion, Volatility & Correlation Dashboard, S&P Dow Jones Indices LLC, June 30, 2026.

4 Includes securities in emerging markets, plus South Korea.

The posts on this blog are opinions, not advice. Please read our Disclaimers.