













How are innovative dividend indices helping market participants make more informed decisions? Look under the hood of the S&P/ASX 200 High Yield Select Index, including how it screens to avoid potential yield traps, with S&P DJI’s Jason Ye and ausbiz’s Andrew Geoghegan.
The posts on this blog are opinions, not advice. Please read our Disclaimers.Tracking High Forecast Dividend Yield in Australia: S&P/ASX 200 High Yield Select Index
Regimes, Reversals and Risk
A New Take on Commodities: Inside the Dow Jones Commodity Index 3 Month Forward – Quarterly Reweight
SPIVA By the Numbers: A Global Perspective
The Rebalance | The Future of Indexing On-Chain with Kaiko
Tracking High Forecast Dividend Yield in Australia: S&P/ASX 200 High Yield Select Index
Regimes, Reversals and Risk

- Categories Equities
- Tags active management, dispersion, emerging markets, information technology, institutional investor, passive investing, S&P 100, S&P 500 Ex-S&P 100 Index, S&P 500 Top 10 Index, S&P MidCap 400, S&P Semiconductors Select Industry Index, S&P SmallCap 600, Semiconductors, Technology Select Sector Index, U.S. equities, US FA
The S&P 500® gained 15% in Q2 2026, posting its best quarter since Q2 2020. The steady drumbeat of AI-related enthusiasm propelled the market upward despite numerous obstacles, including the war with Iran, rising inflation and fears of Fed rate hikes. However, the start of Q3 has been rocky, with a sharp sell-off in chipmakers, followed by a bounce back today, as investors struggle to assess the sustainability of the AI trade. Are these market oscillations ephemeral in nature or a sign of a regime shift?
Reflecting on the past year, the recipients of the rewards of investment in AI infrastructure have no longer been confined to the mega-cap adopters, but they are also moving toward rapidly growing memory chip suppliers housed in the semiconductors industry.1 These leaders include Sandisk Corporation, Micron Technology and stalwart Intel, which were the three top-performing stocks in The 500® YTD through June 30.
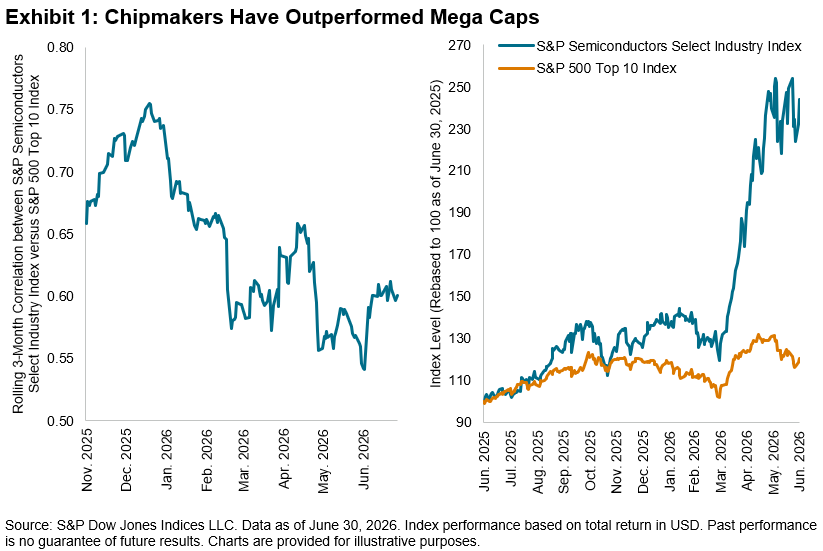
Naturally, the performance of mega caps versus chipmakers has diverged over the past year, with the S&P Semiconductors Select Industry Index’s gain of 144% trouncing the 20% gain for the S&P 500 Top 10 Index.2 Exhibit 1 shows that three-month performance correlations between the two indices fell steadily over the one-year period.
In a reversal from recent years characterized by large-cap strength, one of the consequences of the shifting performance among participants across the AI value chain has been the broadening of the rally toward smaller caps, with the S&P MidCap 400® and S&P SmallCap 600® up 14% and 20%, respectively, in Q2.
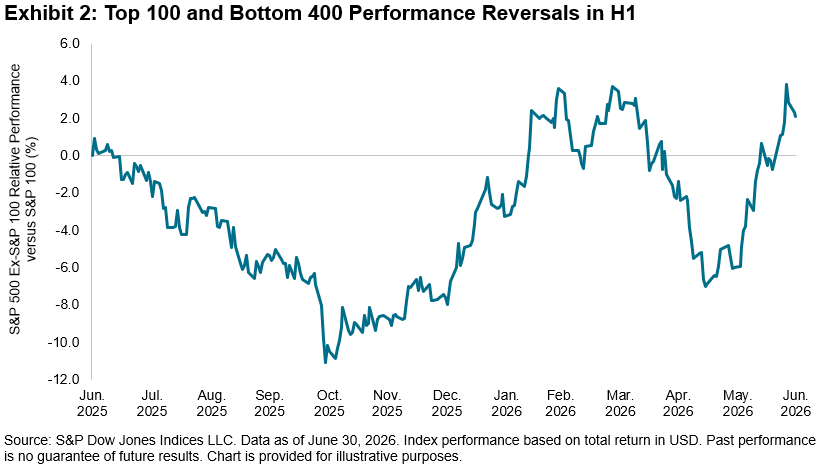
The rally expanded within large caps alone, with the S&P 500 Ex-S&P 100 Index, which not coincidentally includes Sandisk and other leading semiconductor companies like Western Digital, outperforming the S&P 100 by 2% YTD. But the path to outperformance was not linear, as illustrated in Exhibit 2, with the bottom 400 outperforming in Q1, followed by sharp underperformance as mega caps returned to favor and resuming outperformance in June as investors sought refuge among smaller, domestically oriented and defensive stocks. 3
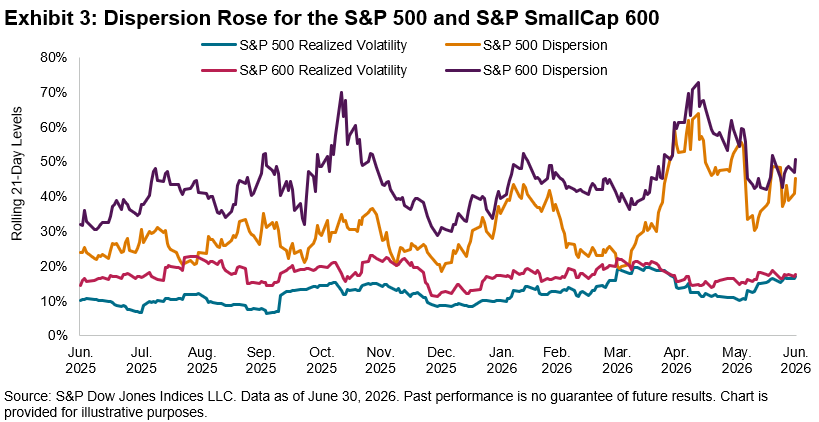
Despite these fluctuations, Exhibit 3 shows that index volatility has remained moderate, with a realized volatility of 17% for both the S&P 500 and S&P 600® for June 2026.4 Meanwhile, cross-sectional volatility—or dispersion, which measures how differently stocks are performing relative to each other—has risen to extreme levels. S&P 600 21-day dispersion reached a peak of 60% in April 2026, outpacing the prior high from November 2025 and the 55% level observed for the S&P 500.
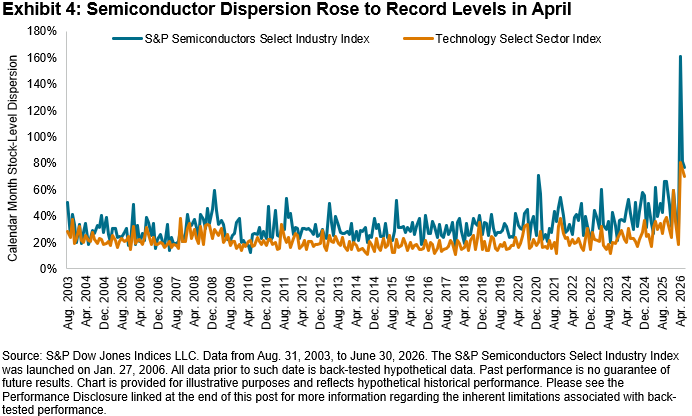
Offering a more granular view is Exhibit 4, which shows that the Technology Select Sector index’s calendar-month stock-level dispersion rose to 80% in April 2026. This level doubled to 161% for the S&P Semiconductors Select Industry Index. The lackluster reaction to Broadcom’s earnings beat and guidance, enthusiastic response to Micron’s blockbuster results, and most recently, the plunge in Samsung’s stock in spite of its earnings beat are prime examples of the increased scrutiny faced by these firms. The value of stock-selection skill rises when dispersion is high, which can mean fruitful conditions for skillful stock pickers to outperform.
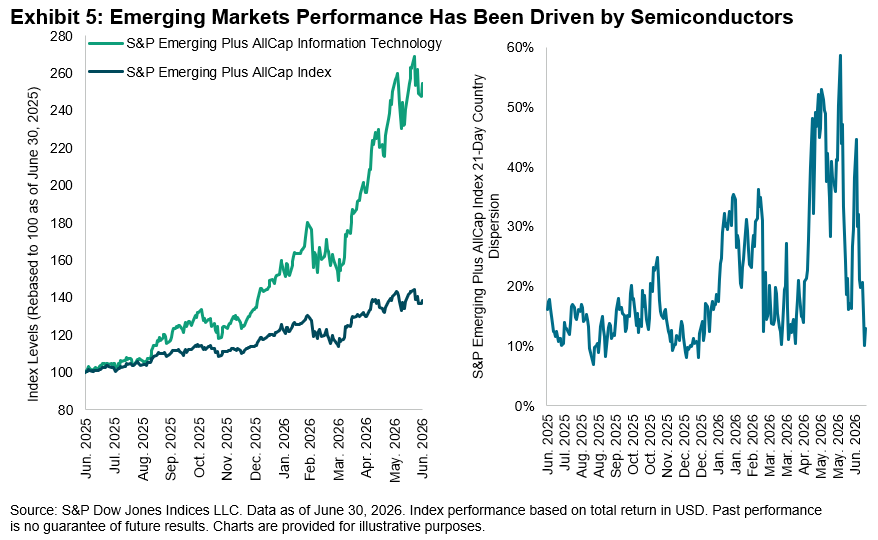
The impact of the AI boom has reverberated globally, most notably in emerging markets. We observe in Exhibit 5 that the S&P Emerging Plus AllCap Information Technology outperformed the S&P Emerging Plus AllCap Index5 by 116% since June 2025.
But the rewards have not been distributed equally across regions. Dispersion, which can also be measured at the country level, widened for the S&P Emerging Plus Index to a high of 58% in early June 2026. Countries with greater sensitivity to semiconductors like South Korea and Taiwan outperformed, although not without their share of jitters, just as we have witnessed in the U.S.
No one knows if the performance gyrations in semiconductors are a temporary blip or the sign of a new regime, but understanding the drivers of these reversals in performance and risk from a size, sector, industry and global lens may provide a nuanced perspective for market participants as they navigate H2.
1 See Ganti, Anu, “Cashing in the Chips?, S&P Dow Jones Indices LLC, June 2, 2026.
2 Performance from June 30, 2025, to June 30, 2026.
3 S&P 100 measures the performance of 100 companies selected from the S&P 500. Generally, the largest companies in the S&P 500 that have listed options are selected for index inclusion.
4 See Dispersion, Volatility & Correlation Dashboard, S&P Dow Jones Indices LLC, June 30, 2026.
5 Includes securities in emerging markets, plus South Korea.
This content may be AI-assisted and is composed, reviewed, edited, and approved by S&P Global.
The posts on this blog are opinions, not advice. Please read our Disclaimers.A New Take on Commodities: Inside the Dow Jones Commodity Index 3 Month Forward – Quarterly Reweight

In this blog, we introduce the Dow Jones Commodity Index 3 Month Forward – Quarterly Reweight (DJCI 3MQT). Launched in August 2025, the DJCI 3MQT is a variant of the Dow Jones Commodity Index (DJCI). The DJCI 3MQT has historically outperformed the S&P GSCI and the Bloomberg Commodity Index (BCOM): over the 10-year period ending June 30, 2026, the DJCI 3MQT outperformed the S&P GSCI by 175 bps and the BCOM by 330 bps.
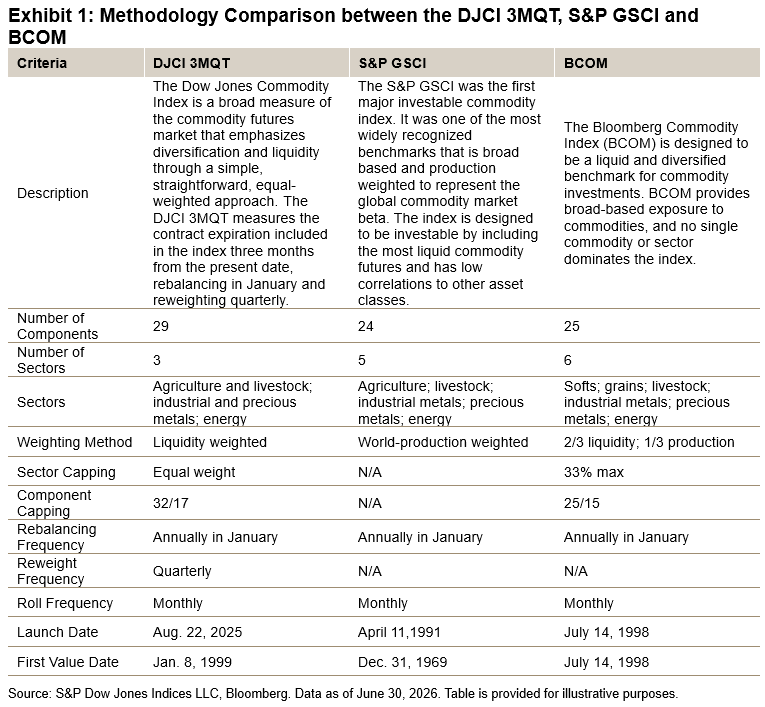
As of its January 2026 reconstitution, the DJCI 3MQT includes 29 commodity futures contracts, representing global commodities across three sectors: agriculture and livestock; energy; and metals. Like the S&P GSCI and BCOM, the DJCI 3MQT holds the front-month futures contract, rolls monthly and rebalances annually in January.
Unlike the S&P GSCI and BCOM, the DJCI 3MQT is liquidity weighted and reweights quarterly. Additionally, the DJCI 3MQT caps the maximum weight of any commodity component at 32%, with any remaining commodity components capped at 17%, and equally weights between commodity sectors. These weighting constraints are applied iteratively until all requirements are met.
Exhibit 1 shows a methodology comparison between the DJCI 3MQT, S&P GSCI and BCOM.1
Let’s explore how the DJCI 3MQT’s three unique methodology components—emphasis on liquidity, equal weighting between sectors and quarterly rebalancing—have historically enhanced performance and reduced volatility.
Emphasis on Liquidity
By emphasizing liquidity, the DJCI 3MQT offers a unique measurement of the commodities market. Liquidity, which is proxied by the total dollar value traded for constituent commodities, determines the weight and, therefore, the importance of the constituents within the index.
As commodities are real assets, it’s difficult for commodity producers to quickly change production or storage capacity to meet changes in demand. In contrast, financial market participants, such as hedgers and speculators, can quickly change their trading behavior to meet changes in demand. As such, the liquidity of commodities contracts, rather than their production data, more accurately mirrors the real-time importance of individual commodities.
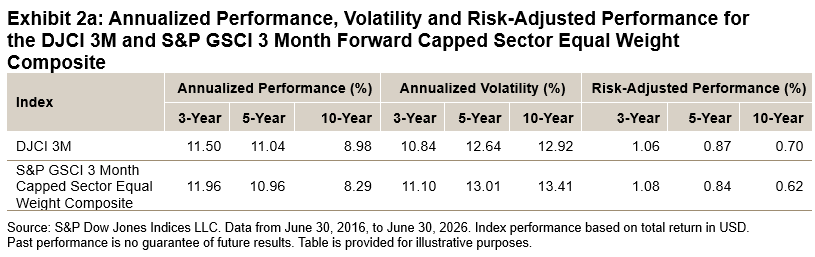
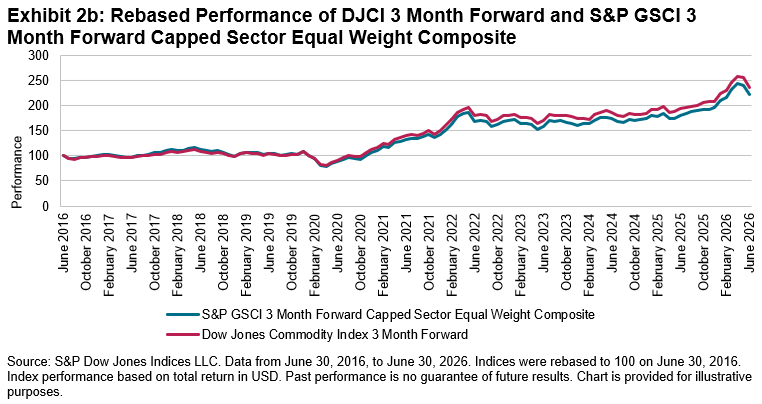
The historical effect of liquidity on index performance is clear. In Exhibit 2, we compare the Dow Jones Commodity Index 3 Month Forward (DJCI 3M) against the S&P GSCI 3 Month Forward Capped Sector Equal Weight Composite.2 These two indices are methodologically the same, other than the choice between liquidity or production. As of June 2026, the DJCI 3M had outperformed the S&P GSCI 3 Month Capped Sector Equal Weight Composite by 69 bps on a 10-year basis.
Equal Weighting between Sectors
Next, we turn to the second characteristic of the DJCI 3MQT—enhanced diversification. Compared to the S&P GSCI and BCOM, the DJCI 3MQT has historically had higher diversification through its overall constituent count (29 versus 24 and 25, respectively),3 as well as through its unique equal-weighted approach to commodity sectors and concentration limits on individual commodities.
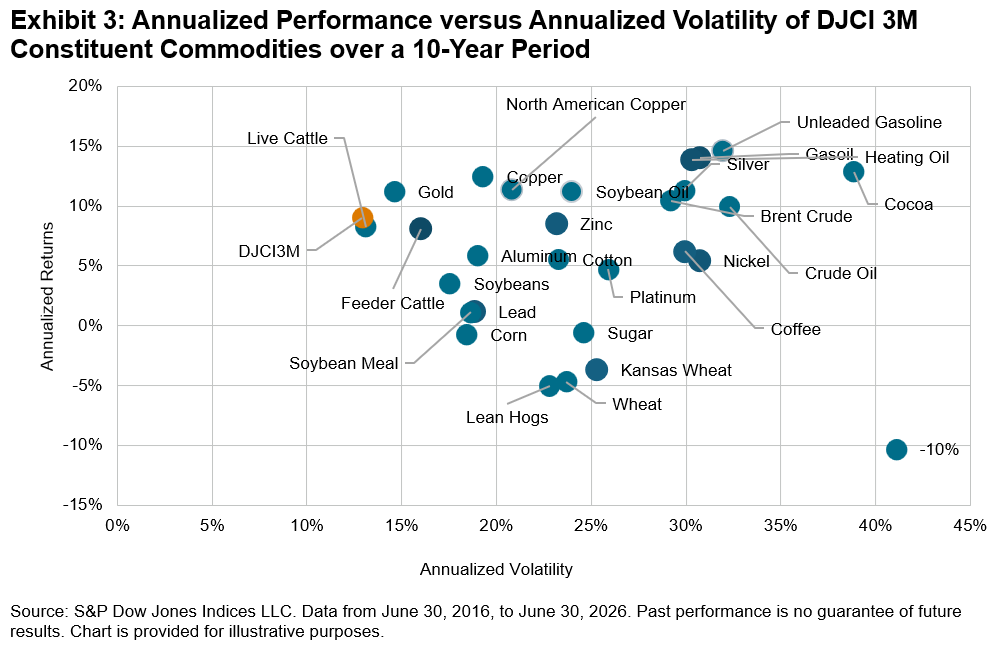
The effect of being highly diversified is demonstrated in Exhibit 3, which graphs the annualized performance against the annualized volatility of the DJCI 3M and its constituent commodities over the past 10 years.4 The DJCI 3M achieved higher annualized performance while exhibiting lower annualized volatility compared to its constituent commodities.
As of June 2026, the 10-year weighted average annualized performance of the DJCI 3M constituent commodities was 7.1%, and the 10-year annualized performance of the DJCI 3M was 9.0%. The 10-year weighted average annualized volatility of DJCI 3M constituent commodities was 23.9%, and the 10-year annualized volatility of the DJCI 3M was 12.9%. This demonstrates the essence of modern portfolio theory—that diversification may be the only “free lunch” in investing—as the DJCI 3M has both increased annualized performance and decreased annualized volatility compared to its individual constituents.
More Frequent Reweighting
Finally, we turn to the third characteristic of the DJCI 3MQT’s methodology: more frequent reweighting. The DJCI 3MQT reweights quarterly to its annual January rebalance weights. This reweighting enables the index to adhere to its intended, liquidity-based weights.
Without the quarterly reweight, the effective U.S. dollar weights of the constituent commodities float based on price changes; this unintentionally adds a momentum component to the index. However, commodities are often mean reverting, such that a momentum strategy can underperform.
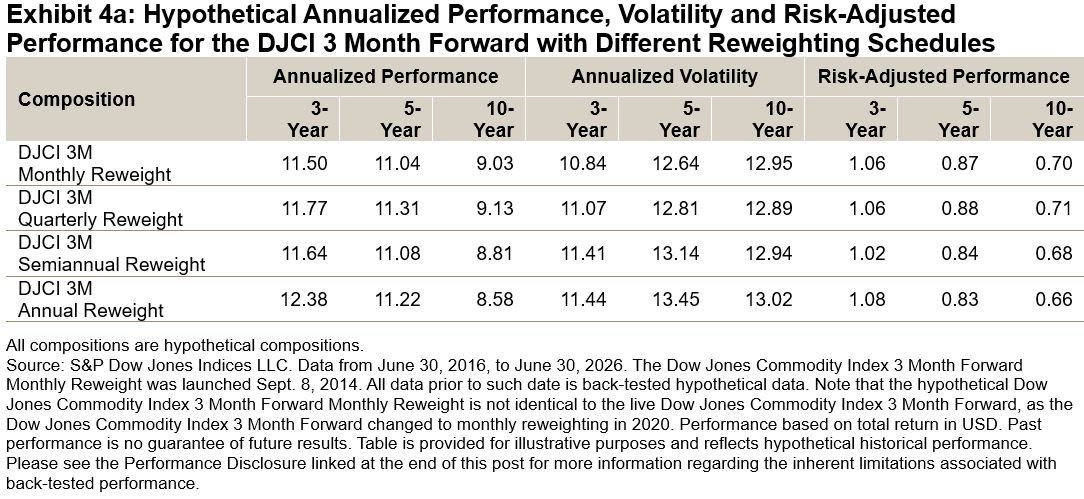
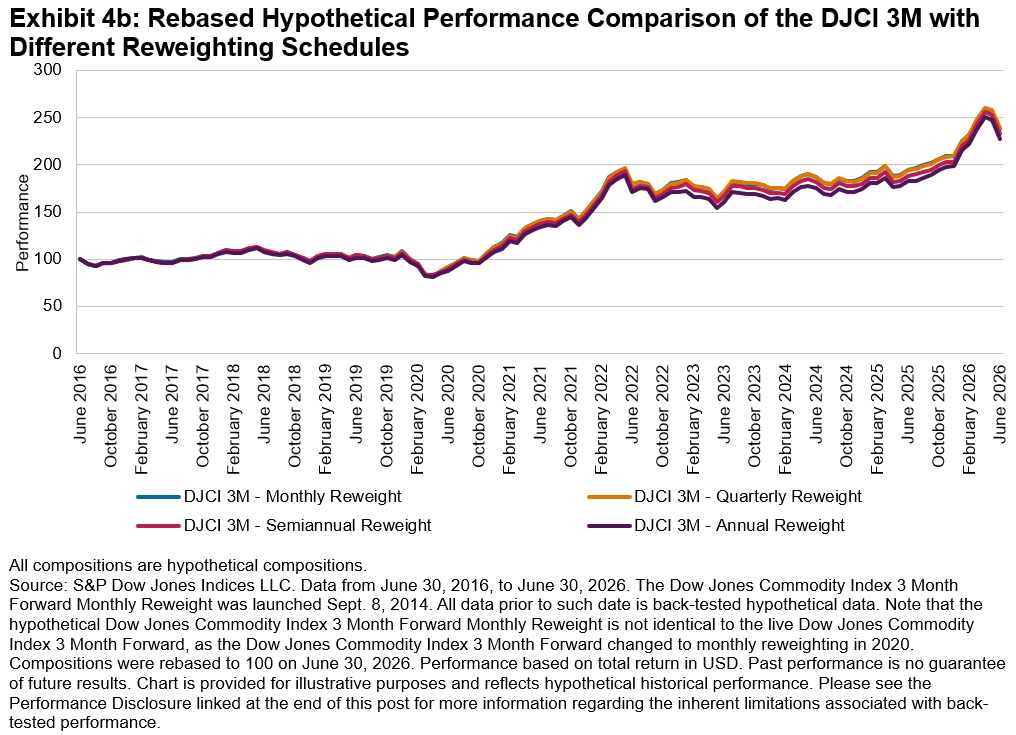
A potential positive effect of a more-frequent reweighting strategy is shown as a comparison in Exhibit 4, which outlines the performance of hypothetical compositions of the DJCI 3M with different reweighting schedules: monthly, quarterly, semiannually and annually. As of June 2026, the quarterly reweight version of the DJCI 3M outperformed the annual reweight (i.e., no reweight) version by 55 bps over the 10-year period.
For further reading, please see Why DJCI? and Dow Jones Commodity Index 3 Month Forward: A Simple Strategy to Measure Enhanced Roll Yield.
1 For more information, please see the Dow Jones Commodity Index Methodology.
2 There is no exact S&P GSCI corollary for the DJCI 3MQT, therefore the DJCI 3M is used as a proxy to isolate the impacts of liquidity weighting.
3 As of the indices’ respective January 2026 reconstitution
4 DJCI 3MQT single constituent commodities are not readily available. Therefore, the analysis in this exhibit is proxied with the DJCI 3M.
The posts on this blog are opinions, not advice. Please read our Disclaimers.SPIVA By the Numbers: A Global Perspective
How difficult is it to beat the benchmark in markets around the world? S&P DJI’s Tim Edwards takes viewers inside the latest SPIVA results and explores the challenges of active management over the long term.
The posts on this blog are opinions, not advice. Please read our Disclaimers.The Rebalance | The Future of Indexing On-Chain with Kaiko
The Rebalance is a video podcast series hosted by S&P DJI CEO Cathy Clay, exploring the trends, ideas and innovations shaping the future of capital markets. In this installment, Cathy sits down with Kaiko CEO Ambre Soubiran to discuss S&P DJI’s collaboration with Kaiko to tokenize the iBoxx USD Treasuries Index and bring a major financial benchmark on-chain as a native digital asset. Learn how trusted benchmarks, digital asset infrastructure and institutional standards are coming together to support the next generation of capital markets.
The posts on this blog are opinions, not advice. Please read our Disclaimers.