With flows into sustainable funds turning positive in early 20261—led by Europe—a key challenge may now be incorporating sustainability considerations without materially altering fixed income risk.
In sustainable fixed income index construction, screening is often used to improve the sustainability profile of an index, but it also tends to change the risk profile of the universe. In many cases, however, the objective is not to build a fundamentally different index strategy, but rather to incorporate sustainability within the benchmark while preserving a broadly similar risk/return profile. Screens alone will often not provide that desired proximity. Using the construction of the iBoxx Euro SRI Corporate Bond Custom Index (iBoxx SRI Index)—which is an index that incorporates sustainability screens created from the iBoxx € Corporates—as an example, this blog examines how sustainability-related exclusions reshape sector and credit exposures, and how structured weighting rules can help keep the resulting risk profile closely aligned with the benchmark.
Exclusions Impact
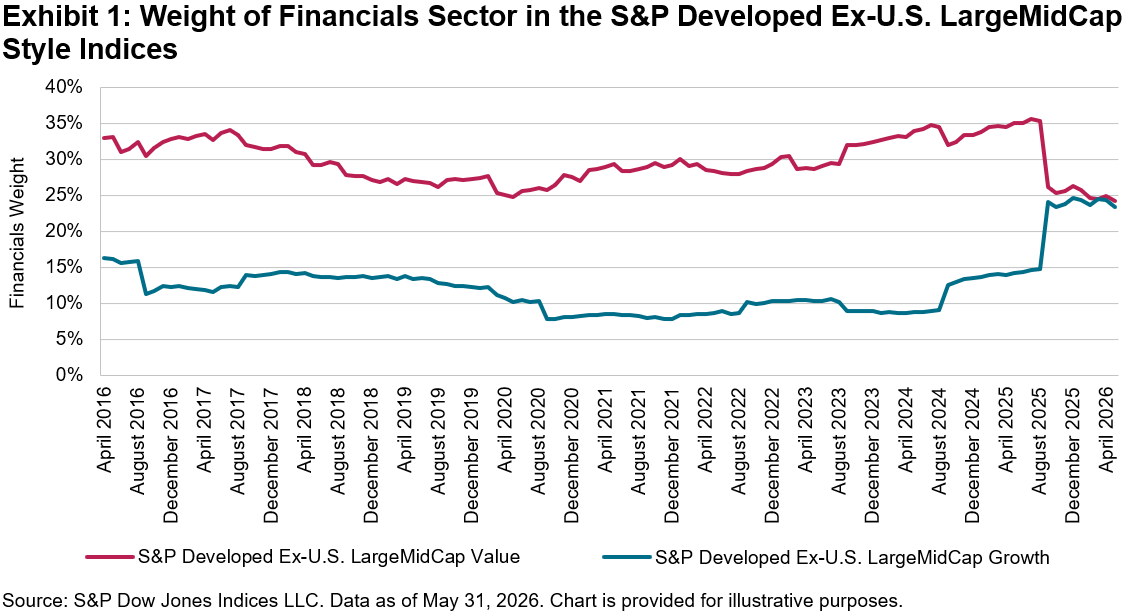
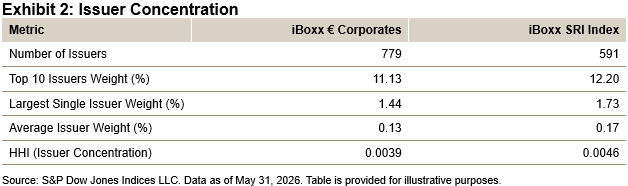
Principled sustainable and responsible investment (SRI) screening tends to remove a meaningful share of constituents from the underlying benchmark. As of May 31, 2026, the issuer count declined from 779 to 591—about a 25% reduction from the iBoxx € Corporates to the iBoxx SRI Index. This issuer reduction had clear sector effects: Energy weight fell sharply from 3.11% to 0.10% due to fossil fuel screens, while other sectors saw more modest declines. In a market cap-weighted framework, excluded sectors redistribute weight to remaining sectors proportionally, with Financials absorbing the largest share. Left unchecked, this mechanical effect can create unintended sector tilts.
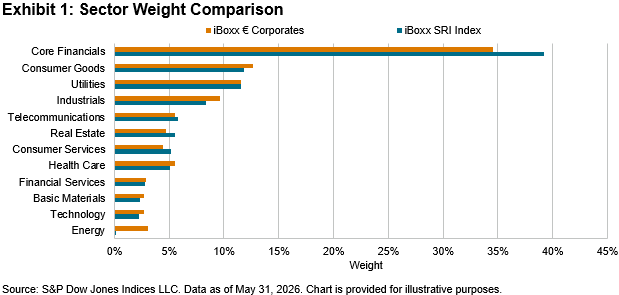
Index construction can help offset these shifts. In the iBoxx SRI Index, sector caps—particularly on Core Financials—limit excessive reallocation. Core Financials, at 39.24% as of May 2026, remained within defined bounds, showing that sector balance was maintained even as the eligible universe evolved.
Controlled Concentration
A smaller universe naturally increases concentration. The top 10 issuer weight rose from 11.13% to 12.20%, the largest issuer from 1.44% to 1.73% and the Herfindahl-Hirschman Index (HHI) from 0.39% to 0.46%. While increases are expected, overall concentration remained low. With 591 issuers and a 12.20% top 10 share, diversification remained strong. Rating-based issuer caps—ranging from 2.5% (BBB) to 10% (AAA)—systematically limit single-name concentration. The increase is measurable but controlled by design.
Credit Alignment
SRI strategies are often assumed to tilt toward higher-quality issuers, reflecting expectations around stronger governance. The data in Exhibit 3 show a more neutral outcome.
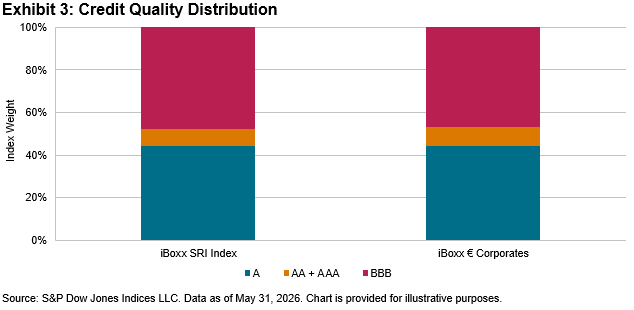
Credit quality remained closely aligned with the iBoxx € Corporates benchmark. A rated bonds were mostly unchanged (44.1% for the iBoxx SRI index versus 44.2% for the iBoxx € Corporates benchmark), BBB weight was slightly higher (48.0% versus 46.7%), and AA/AAA was marginally lower (7.9% versus 9.1%). Rather than improving credit quality, the SRI framework preserves a neutral profile consistent with the iBoxx € Corporates benchmark objectives. A minimum average rating constraint acts as a backstop, reducing BBB weights if needed to maintain overall quality. This alignment was reflected in broader metrics: yield (3.65% versus 3.66%) and duration (4.37 versus 4.42) remained essentially unchanged. Despite a reduction in the number of bonds (4,265 to 3,334), market depth remained sufficient to support benchmark-like liquidity.
Consistent Performance
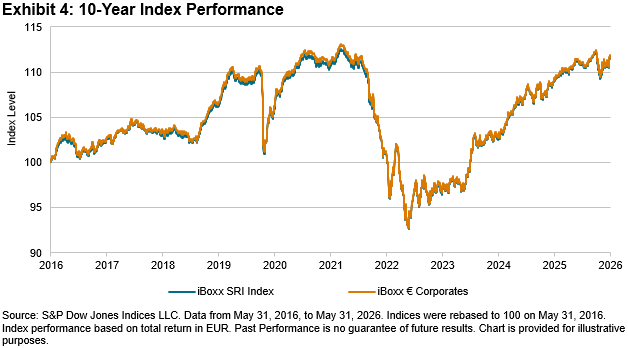
Over the past 10 years, the iBoxx SRI Index has closely tracked its benchmark, with no material performance divergence. Both indices followed the same macro cycles—from pre-2020 rate compression to the 2022 drawdown and subsequent recovery—remaining closely aligned throughout. The co-movement is intentional, reflecting a methodology for the iBoxx SRI Index that seeks to preserve the benchmark’s risk/return profile while applying sustainability screens.
Sustainability exclusions reshape sector and issuer composition—as intended—but this need not alter the risk profile. As shown, index construction plays a key role in preserving diversification and benchmark-like characteristics. One key point is whether the index methodology manages these tradeoffs systematically, focusing on sustainability goals without unintended benchmark deviations.
1 Segal, Mark, “Sustainable Fund Flows Return to Positive Territory, Driven by Rebound in Europe: Morningstar,” ESG Today, May 28, 2026.
This content may be AI-assisted and is composed, reviewed, edited, and approved by S&P Global.
The posts on this blog are opinions, not advice. Please read our Disclaimers.