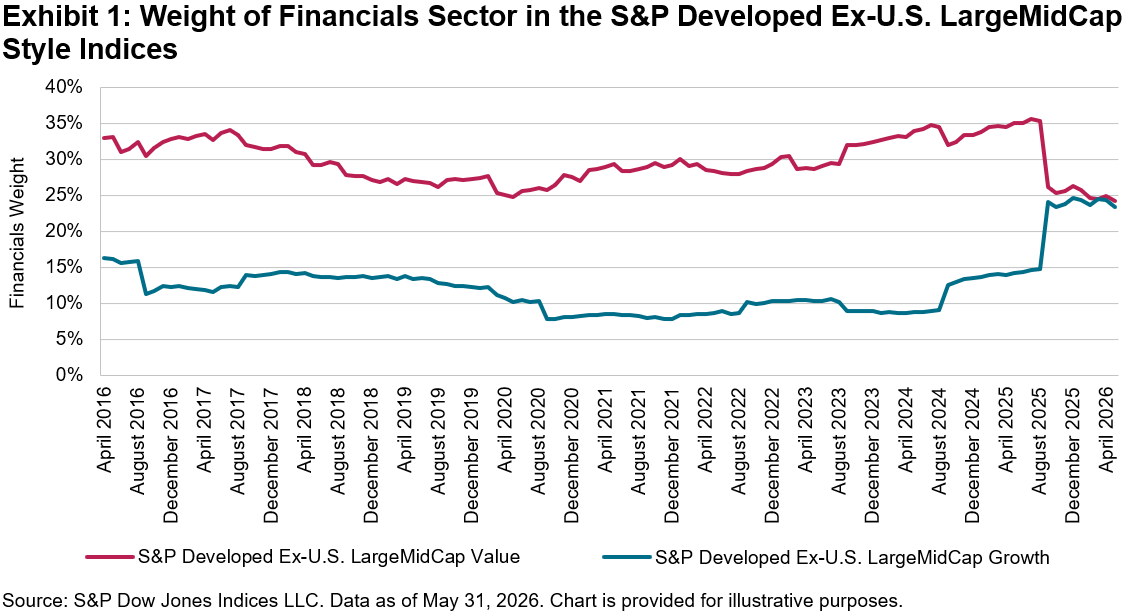
The Financials sector has traditionally been categorized as value (i.e., stocks considered undervalued but with stable fundamentals) instead of growth (i.e., stocks with higher valuations but that are expected to grow faster than the market). Historical data supported this perception until recently (see Exhibit 1). By the end of May 2026, the weight gap for the Financials sector between the S&P Developed Ex-U.S. LargeMidCap Value and S&P Developed Ex‑U.S. LargeMidCap Growth narrowed to less than 1% (24.3% versus 23.4%, respectively), after being around 21% one year prior (35.1% versus 14.3%, respectively). This change shows a notable convergence between styles.
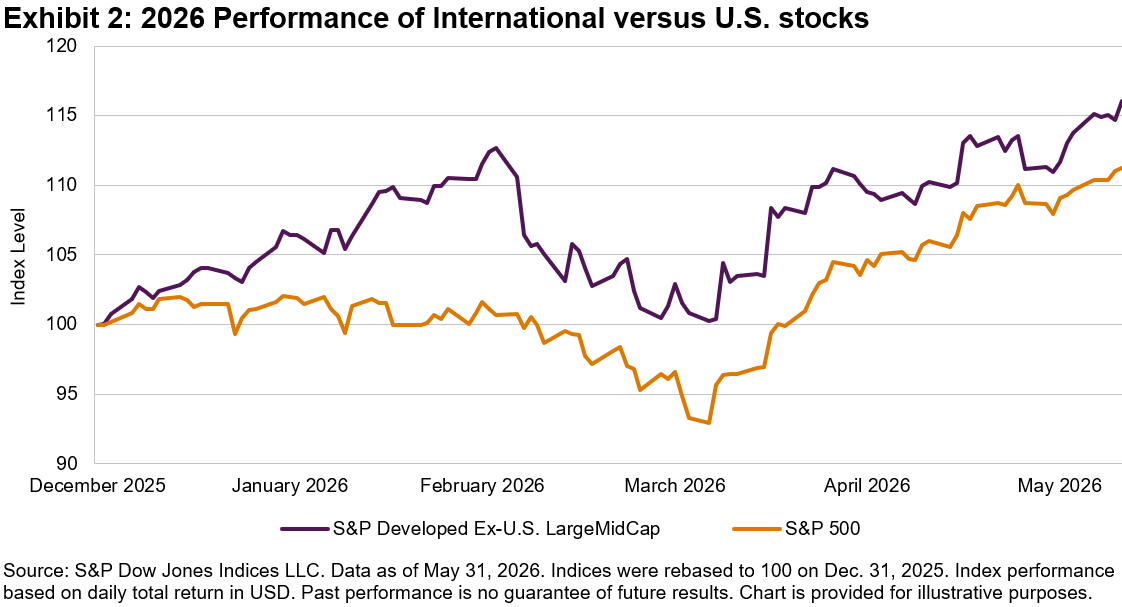
The recent performance of international equities played a key role in this convergence. Driven by diversification away from U.S. equities, international equities have seen renewed interest. After posting one of its strongest annual performances in 2025 (up 35.1%), the S&P Developed Ex-U.S. LargeMidCap’s outperformance persisted this year; by the end of May 2026, the index was up 16.1% YTD, while the S&P 500® was up 11.3% YTD (see Exhibit 2). Financials, the largest GICS® sector within the index by weight, has been the primary driver of this performance. It surged 52.0% in 2025 and was up 32.8% YTD by May 31, 2026.
To understand why this performance altered the sector’s style profile, it is helpful to revisit how S&P Dow Jones Indices determines the style of an individual stock. According to the S&P Global BMI Methodology, a growth score-to-value score ratio is calculated for each stock. The style scores are calculated using standardized fundamental data of the company, as noted in a previous blog. Depending on the score, the float-adjusted market cap of a stock is assigned completely to the growth or value version of the index or is distributed proportionally based on its relative distance to the average value and growth scores. Exhibit 3 illustrates this classification.
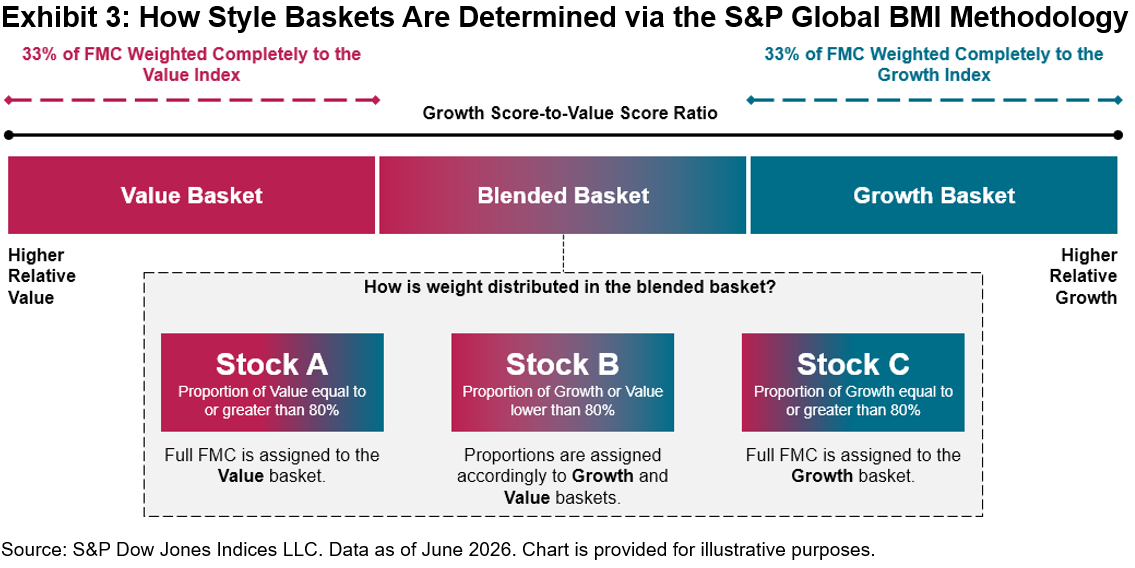
With that framework in mind, the style reclassification is explained by two main factors. First, three of the four value factors (book-to-price, cash-flow-to-price and sales-to-price) are directly affected by share price movements. Since price appears in the denominator of these ratios, sharp price appreciation weakens the value score, assuming that balance sheet fundamentals do not rise at the same pace.
On the other hand, the growth score focuses on the growth of earnings and sales. In recent years, European banks have seen an improvement in profitability, while major Japanese banks reached record profit levels in 2025 for a second consecutive year.
Together, these developments have created a style reclassification effect. On one hand, valuation‑based value signals weakened as bank share prices surged. On the other hand, rising earnings and improving performance profiles strengthened growth factors.
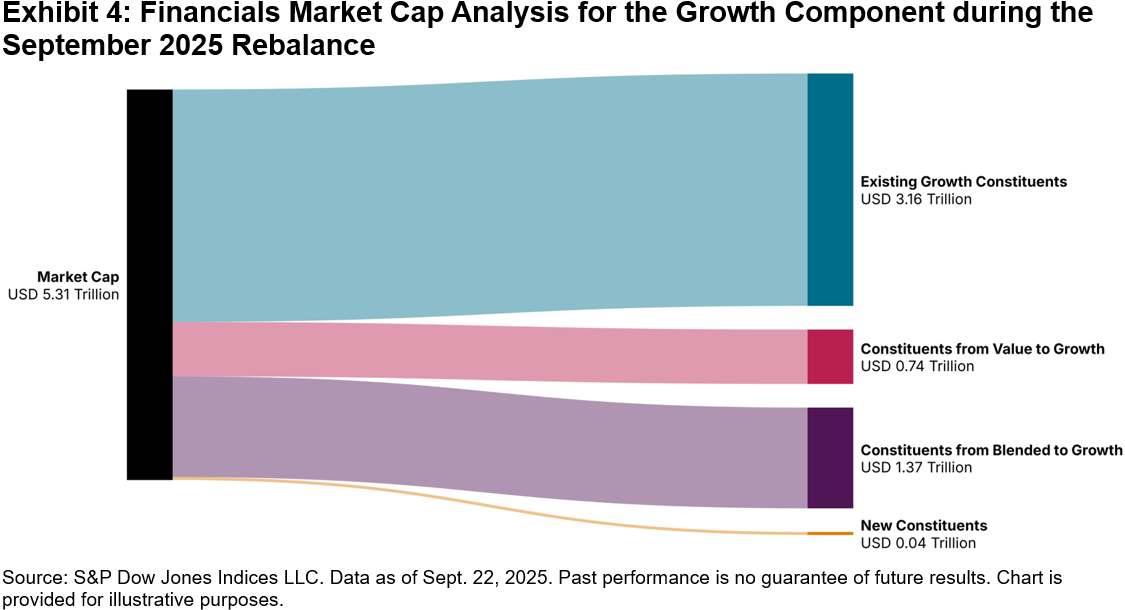
This shift was clearly visible during the September 2025 rebalance. Compared to the prior year, the weight of Financials in the S&P Developed Ex‑U.S. LargeMidCap Growth increased from 12.5% to 24.0%, while its weight in the S&P Developed Ex-U.S. LargeMidCap Value declined from 32.3% to 26.1%. During this period, 19 stocks transitioned from being categorized as blended to growth, and 11 companies switched from value to growth, adding approximately USD 2.1 trillion in market capitalization to the S&P Developed Ex‑U.S. LargeMidCap Growth (see Exhibit 4).
Large banks have not only driven index performance; they have also contributed to the migration across styles. BBVA, Royal Bank of Canada, UniCredit and Mitsubishi UFJ, which were part of the S&P Developed Ex-U.S. LargeMidCap Value before the September 2025 rebalance, represented 4.9% of the S&P Developed Ex‑U.S. LargeMidCap Growth’s total weight in May 2026.
In brief, the strong performance of international Financials in recent years, driven by both rising share prices and improved fundamentals, has altered the long-standing perception of the sector as exclusively value oriented. Internationally, Financials has become more balanced in terms of style, converging between growth and value weights.
The posts on this blog are opinions, not advice. Please read our Disclaimers.