Get Indexology® Blog updates via email.

In This List

Harnessing the Power of Multiple Factors: Inside the S&P 500 Quality, Value & Momentum Multi-Factor Index

S&P Global Dividend Aristocrats in Focus: S&P World Ex-Australia High Yield Dividend Aristocrats Select Index

Measuring the Managers

The Dow: 130 Years as the Original Index Icon

The Market Measure: In the Shadows of Giants

Harnessing the Power of Multiple Factors: Inside the S&P 500 Quality, Value & Momentum Multi-Factor Index

Contributor Image
Wenli Bill Hao

Director, Factors and Dividends Indices, Product Management and Development

S&P Dow Jones Indices

Single-factor indices have historically outperformed over the long term, but their performance tends to be cyclical, varying with macroeconomic conditions. This has driven demand for multi-factor indices, which combine factors such as quality, value and momentum to leverage their low correlations. By diversifying across multiple factors, these indices seek to enhance long-term risk-adjusted performance and provide more stability.

In this blog, we introduce the S&P 500® Quality, Value & Momentum Multi-Factor Index and explore its construction, review its historical performance, analyze sector composition and assess its factor weights to provide a comprehensive overview of its characteristics.

YTD Outperformance

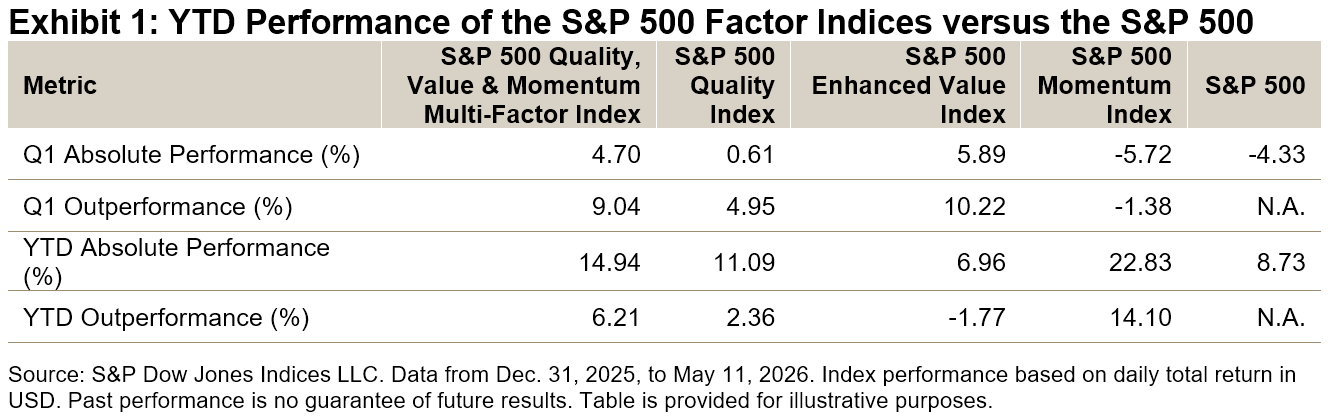
The S&P 500 Quality, Value & Momentum Multi-Factor Index outperformed the S&P 500 in Q1 and YTD 2026 (see Exhibit 1). Despite increased volatility in Q1, it proved resilient, outperforming the S&P 500 by about 9%. As markets rebounded from March lows, the multi-factor strategy maintained its outperformance, while indices like the S&P 500 Enhanced Value Index lagged.
Methodology Overview

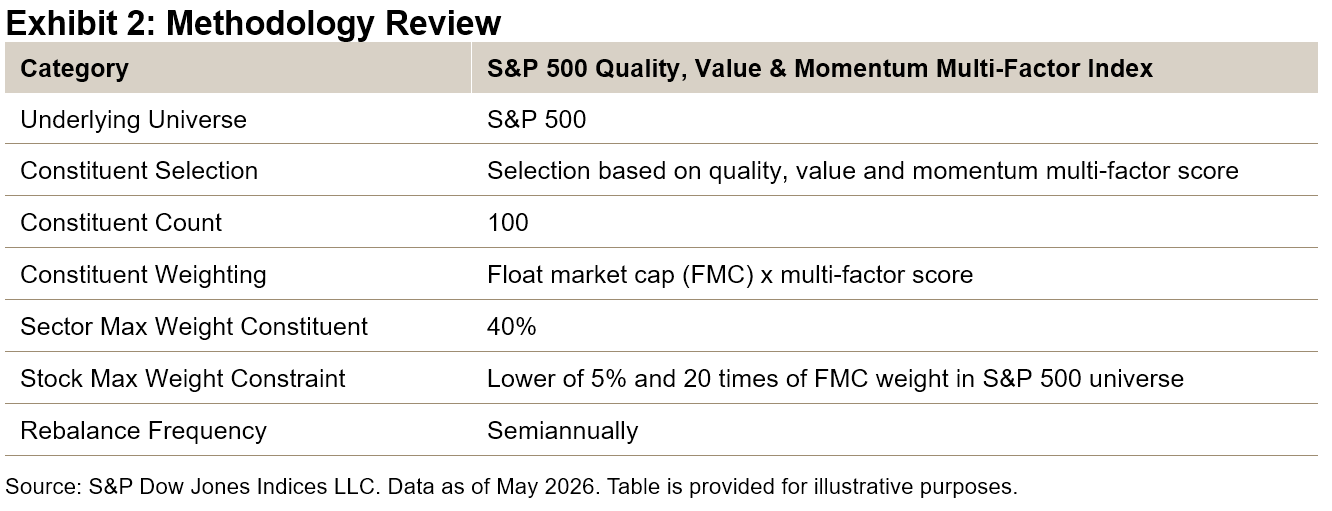
The S&P 500 Quality, Value & Momentum Multi-Factor Index uses a bottom-up approach, selecting the top 20% of S&P 500 stocks based on a composite multi-factor score1 (see Exhibit 2). This score averages individual quality, value and momentum scores, targeting a concentrated group of “all-rounders”—stocks that exhibit strength across multiple factors.

Constituents are weighted by the product of their market capitalization and multi-factor score, balancing size and factor strength.2 The index is rebalanced semiannually in June and December to maintain its targeted multi-factor scores and adapt to changing market conditions.
Harnessing Complementary Factors

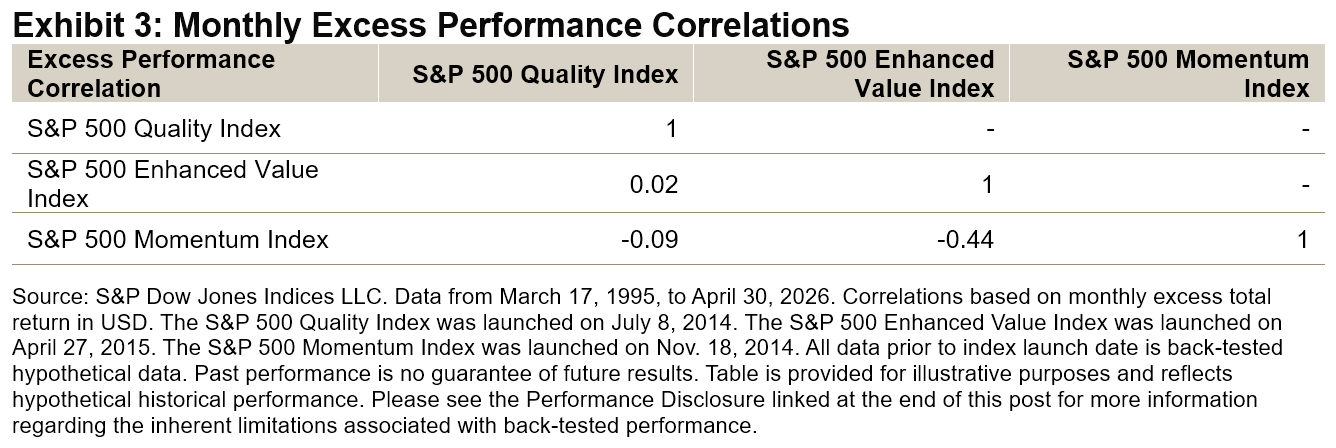
Factor combinations are generally grounded in economic rationale. Quality, value and momentum have historically tended to respond complementarily across different phases of the business cycle: quality is defensive and tends to outperform during economic slowdowns; value is procyclical, performing well during recoveries; and momentum benefits from persistent market trends. As shown in Exhibit 3, the excess performance of the S&P 500 Quality Index, S&P 500 Enhanced Value Index and S&P 500 Momentum Index exhibited low or even negative correlations, underscoring their diversification potential.
Performance Comparison

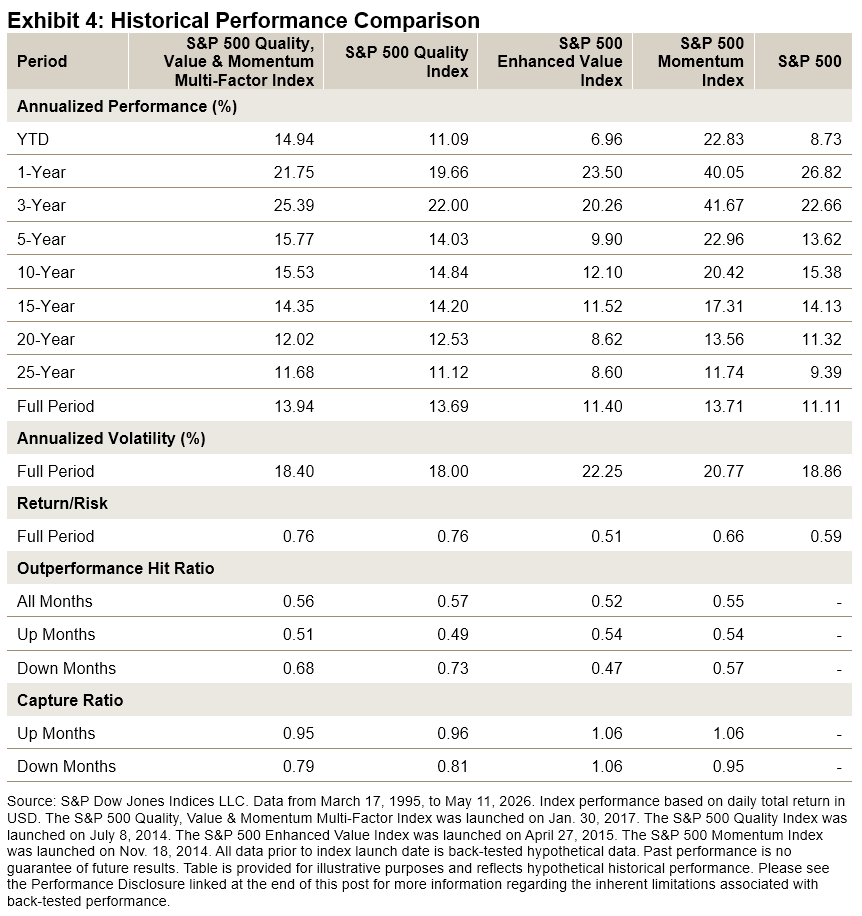
The S&P 500 Quality, Value & Momentum Multi-Factor Index consistently outperformed the benchmark over both short and longer back-tested horizons, in total and risk-adjusted performance. It also exhibited greater resilience than single-factor strategies, as evidenced by the performance hit ratio and capture ratios (see Exhibit 4), highlighting the historical advantage of combining complementary factors to reduce cyclicality.
Sector Composition

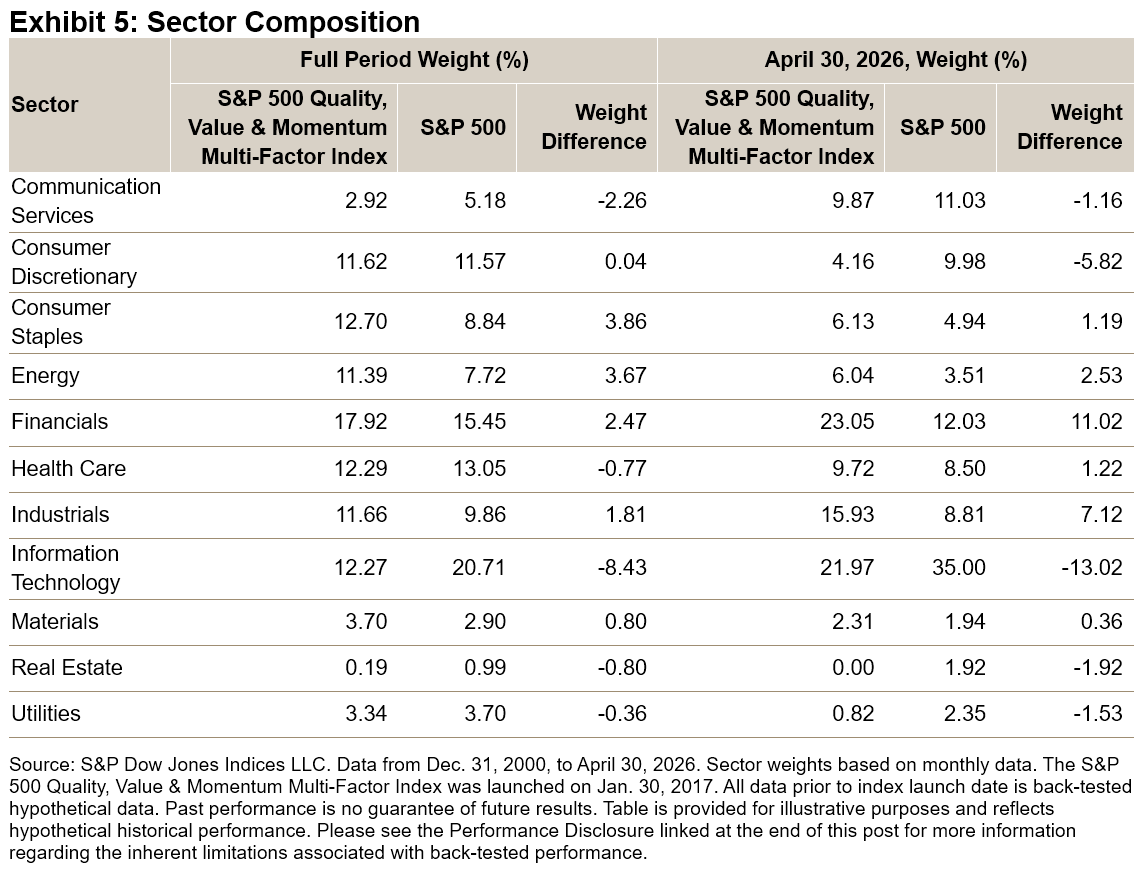
Exhibit 5 shows the sector weights of the S&P 500 Quality, Value & Momentum Multi-Factor Index versus the S&P 500. The S&P 500 Quality, Value & Momentum Multi-Factor Index has historically overweighted Consumer Staples, Energy, Financials and Industrials, while underweighting Information Technology and Communication Services. This sector tilt contributes to the index’s distinct risk and performance profile compared to the S&P 500.
Factor Z-Scores

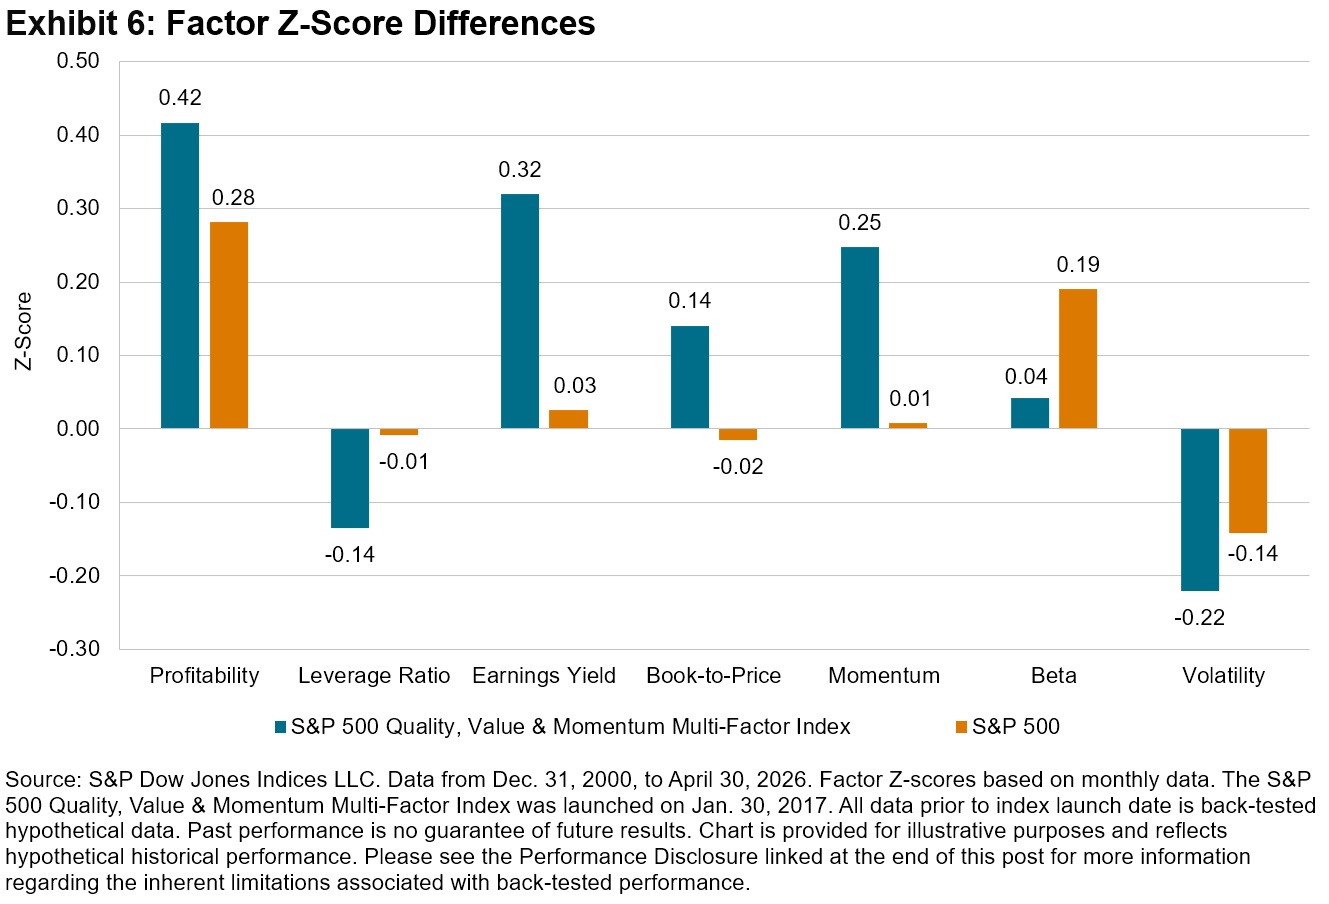
Exhibit 6 highlights the factor Z-score differences between the S&P 500 Quality, Value & Momentum Multi-Factor Index and the S&P 500, using FactSet Risk Model Z-scores. As expected, the S&P 500 Quality, Value & Momentum Multi-Factor Index had higher Z-scores in quality (higher profitability and lower leverage), value (earnings yield and the book-to-price ratio) and momentum. It also shows spill-over into lower beta and lower volatility.
Conclusion

The S&P 500 Quality, Value & Momentum Multi-Factor Index showcases a diversified approach that can help with navigating varying market conditions. By blending complementary factors, the index aims to enhance risk-adjusted performance and reduce cyclicality, providing an alternative to traditional single-factor or market-cap-weighted strategies.

1 Andrew Innes, “The Merits and Methods of Multi-Factor Investing,” S&P Dow Jones Indices LLC, April 2018.

2 For more detailed information, please refer to the S&P 500 Quality, Value & Momentum Multi-Factor Indices Methodology.

The posts on this blog are opinions, not advice. Please read our Disclaimers.

S&P Global Dividend Aristocrats in Focus: S&P World Ex-Australia High Yield Dividend Aristocrats Select Index

How are dividend indices helping income seekers around the world make more informed decisions? S&P DJI’s Jason Ye joins ausbiz’s Andrew Geoghegan for a closer look at what it takes to be a Dividend Aristocrat and how the S&P World Ex-Australia High Yield Dividend Aristocrats Select Index tracks quality dividend growers. 

The posts on this blog are opinions, not advice. Please read our Disclaimers.
Measuring the Managers

Contributor Image
Anu Ganti

Head of U.S. Index Investment Strategy

S&P Dow Jones Indices

The measurement of active manager performance versus benchmarks is not new. The earliest study dates back to more than 90 years ago, when Alfred Cowles found that “statistical tests of the best individual records failed to demonstrate that they exhibited skill, and indicated that they more probably were results of chance.”1

Forty years later, by the 1970s, financial markets increasingly became dominated by professional investors rather than the retail investors of Cowles’ day. In “The Loser’s Game,” Charles Ellis found that “contrary to their oft articulated goal of outperforming the market averages, investment managers are not beating the market: The market is beating them.”2

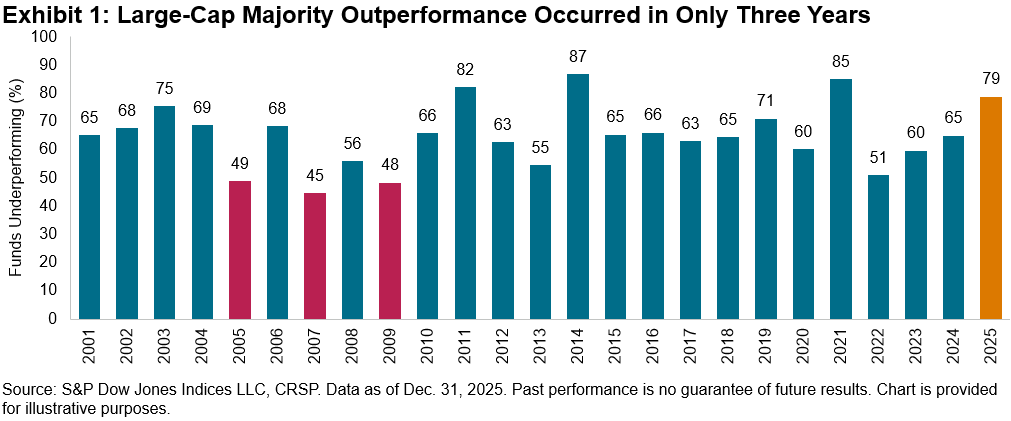
Less than 30 years later, the SPIVA® Scorecard launched in 2002, and it continues to serve as the de facto scorekeeper of the long-standing active versus passive debate. Beating the market is a tall order,3 with only three years of majority outperformance versus the S&P 500® over a 25-year history. For our largest and most closely watched category, 2025 was no exception, with 79% of all active large-cap U.S. equity funds underperforming the S&P 500.4

It is important to note that the underperformance rates shown in Exhibit 1 use the opportunity set available at the beginning of the period as the denominator to account for survivorship bias. We take a simple count of the funds that have survived and beat the index and then report the index outperformance percentage. Therefore, merged or liquidated funds are counted as underperformers.

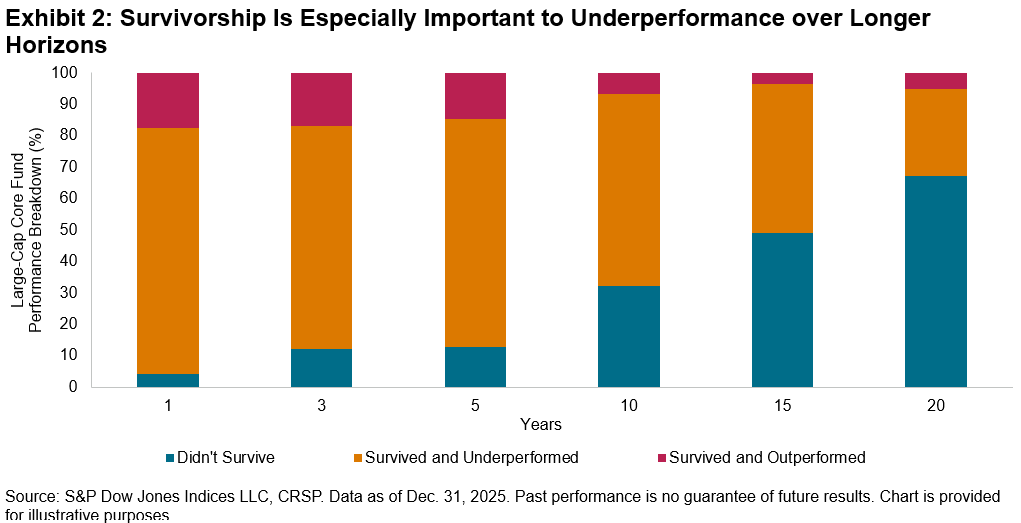
To better understand the impact of survivorship on underperformance, Exhibit 2 shows the breakdown of Large-Cap Core fund performance into three categories: funds that did not survive, funds that survived and underperformed and those that survived and outperformed. Over a one-year period, 82.5% of Large-Cap Care funds underperformed The 500®. Notably, most of this underperformance came from funds that survived but still underperformed, an indication of the challenges of benchmark outperformance regardless of the treatment of merged or liquidated funds.

Over a 20-year period, however, most of the category’s underperformance came from funds that did not survive, highlighting the importance that survivorship plays over longer time horizons. These trends are also indicative of the competitive nature of the business of active management, where winners tend to be rewarded with inflows by asset owners, but losers are generally punished with terminations and are less likely to survive over longer periods.5

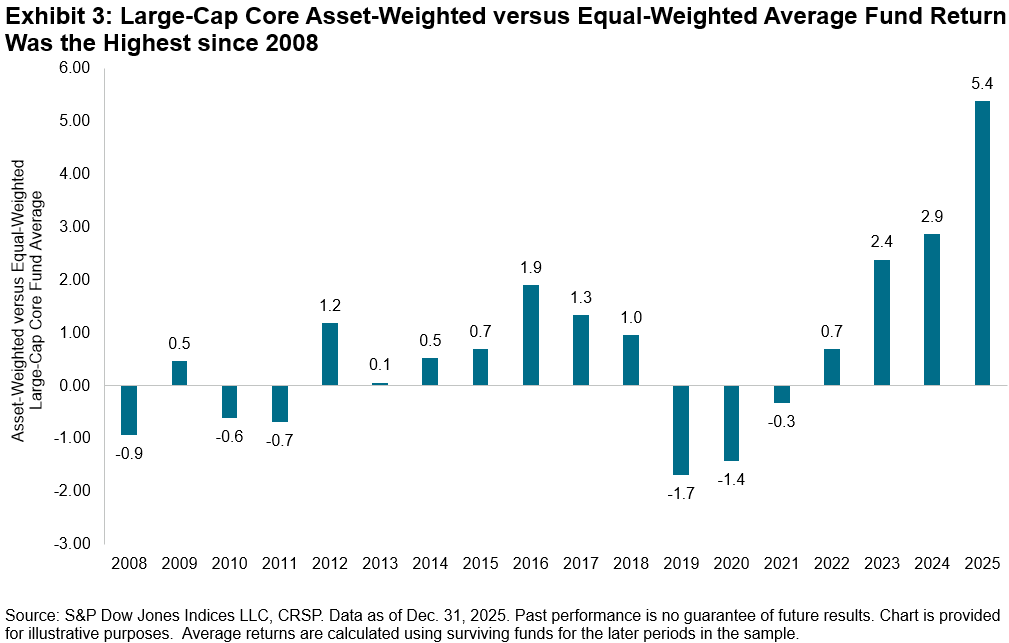
Another feature of our methodology of calculating fund underperformance is that funds of all sizes are treated equally. However, our scorecards show both equal- and asset-weighted average performance for comparison purposes. We observe in Exhibit 3 that the difference in 2025 of 5.4% between Large-Cap Core’s asset-weighted average return of 19.7% and the corresponding equal-weighted average return of 14.3% was the highest since 2008. The fact that larger funds have performed better in recent years, perhaps due to economies of scale or an information advantage, is typical, but unusually heightened compared to history.

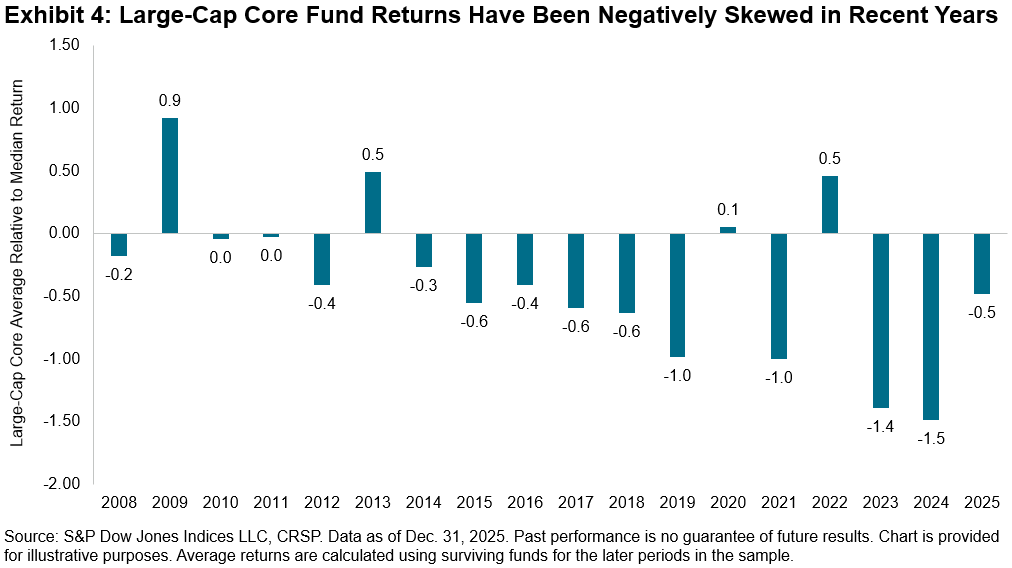
While larger funds have been among the winners in recent years, a negative skew has accompanied the cross section of fund returns. In other words, when a fund’s performance differed significantly from the median, it was more likely to be a significant underperformer. Exhibit 4 shows one measure of the historical skewness of fund excess returns for the Large-Cap Core category—specifically comparing the average return to the median return (reported as the second quartile breakpoint). While the skew was lower than in the prior two years, 2025 continued to witness an average return lower than the median.

Thanks to the rich data set backed by a robust methodology that SPIVA offers, including underperformance rates, survivorship statistics, equal and asset-weighted average returns, quartile breakpoints and more, readers across the globe can measure active manager performance versus the appropriate market benchmarks in a holistic manner. As the scorecard has evolved to expand to 11 regions with coverage across equities and fixed income, the message remains consistent regardless of geography or asset class: Most active managers underperform most of the time.  Alfred Cowles would not be surprised.

1 Cowles 3rd, Alfred, “Can Stock Market Forecasters Forecast?” Econometrica, July 1933.

2 Ellis, Charles D., “The Loser’s Game,” Financial Analysts Journal, July/August 1975.

3 For more detail on why active underperformance happens, see Ganti, Anu R., and Craig J. Lazzara, “Shooting the Messenger,” S&P Dow Jones Indices LLC, Nov. 22, 2022.

4 Ganti, Anu R. et al., “SPIVA U.S. Year-End 2025 Scorecard,” S&P Dow Jones Indices LLC, March 3, 2026.

5 Over consecutive five-year periods, in almost every single reported equity and fixed income category, the worst-performing quartile saw the highest proportion of funds that were subsequently merged or liquidated.  See Ganti, Anu R. et al., “U.S. Persistence Scorecard: Year-End 2025,” S&P Dow Jones Indices, May 7, 2026.

The posts on this blog are opinions, not advice. Please read our Disclaimers.
The Dow: 130 Years as the Original Index Icon

The Dow’s longevity has been earned through sustained attention to governance, methodology and relevance. Explore how this global index icon’s continued evolution helps it track a changing market. 

The posts on this blog are opinions, not advice. Please read our Disclaimers.
The Market Measure: In the Shadows of Giants

How has index concentration shifted historically and why might a diversified, cap-weighted benchmark like the S&P 500 already be tracking tomorrow’s market giants? S&P DJI’s Ben Vörös sits down with Tim Edwards to discuss Tim’s latest research, In the Shadows of Giants, and examine whether the dominance of a few large companies may be a signal of risk or opportunity for market participants. 

The posts on this blog are opinions, not advice. Please read our Disclaimers.