Get Indexology® Blog updates via email.

In This List

Latin Markets: Still Dancing to the Same Beat

Forecasting Tomorrow’s Dividends: Introducing the S&P/TSX Composite High Dividend Growth Index

SPIVA Special Report: Heroes in Haystacks

S&P Momentum Indices Shine in April Rally

Beyond Mega Caps: Navigating Concentration and Diversification in Crypto Index Construction

Latin Markets: Still Dancing to the Same Beat

Contributor Image
Sara Pineros

Quantitative Analyst, Index Investment Strategy

S&P Dow Jones Indices

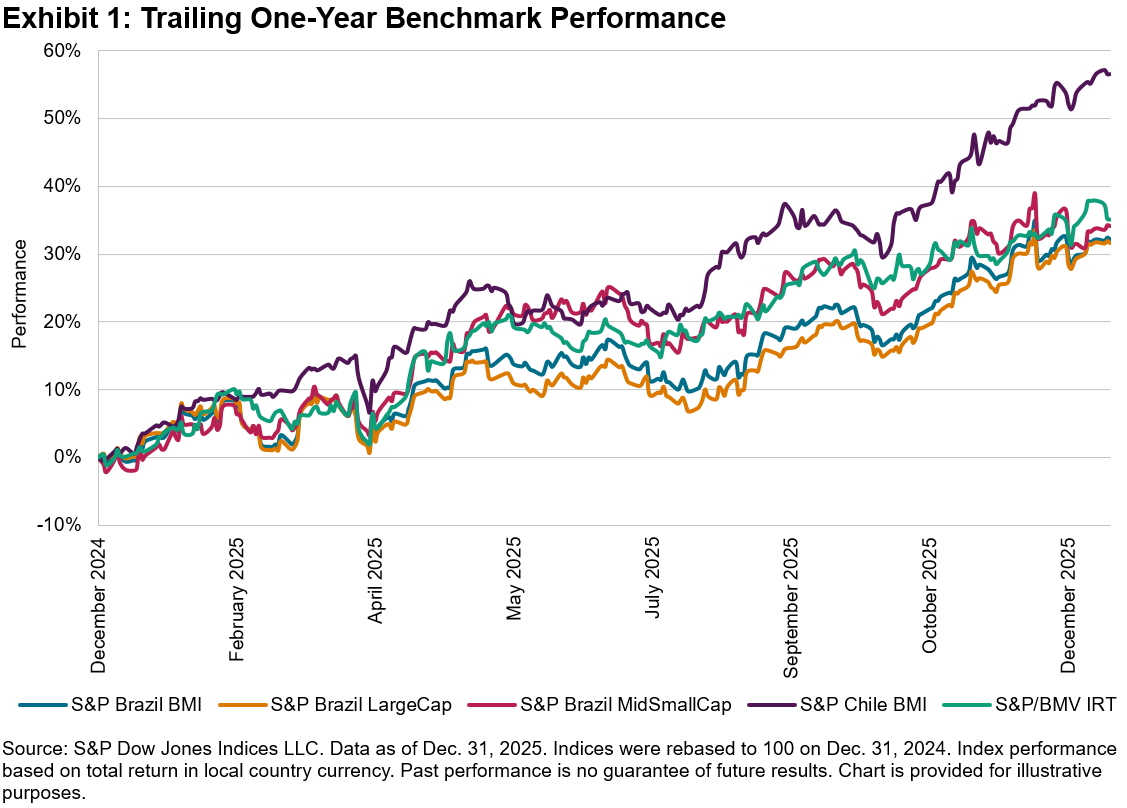
Just as Latin American musicians dominated global charts in 2025, the region’s equities delivered quite the performance last year. While markets navigated shifting interest rates and economic transitions, Latin America stood out as a top-performing region worldwide. The S&P Latin America BMI hit a high note, surging by 53.8% for the year, outperforming the S&P Global BMI by 31.8% in U.S. dollar terms.

As Exhibit 1 illustrates, this growth was widespread. Chile was the clear standout, with the S&P Chile BMI rising 56.6%, followed by Mexico’s S&P/BMV IRT at 35.2%. Brazil also experienced a robust recovery from its 2024 slump, with the S&P Brazil BMI up 32.2%.

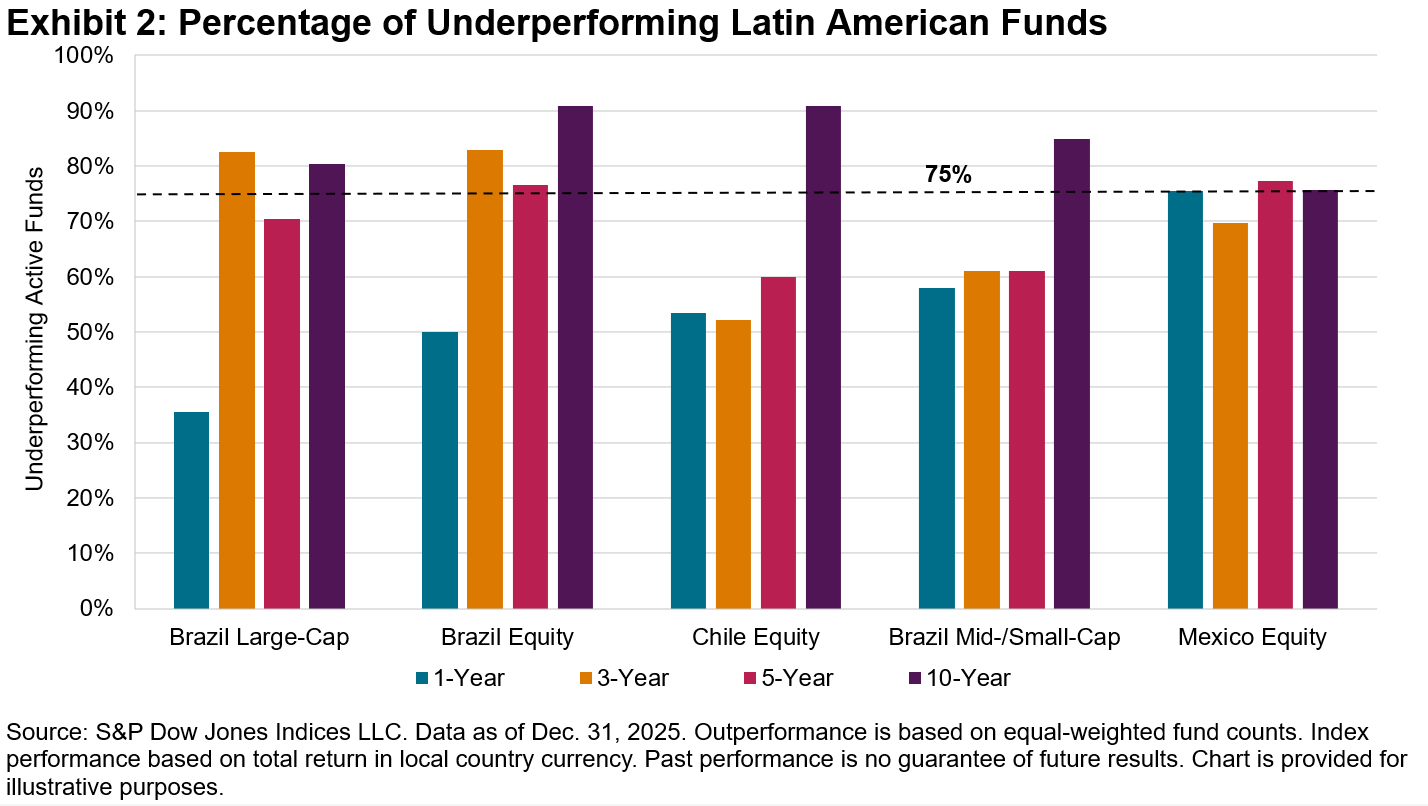
Did active funds sing in tune with the broad rally or end up off-key? The results, detailed in the SPIVA Latin America Year-End 2025 Scorecard, were mixed. While active large-cap equity funds in Brazil fared relatively well, the majority of active funds in all other regional categories failed to capture the full extent of the 2025 surge. As Exhibit 2 shows, over a 10-year horizon, high underperformance (over 75%) remained the undeniable norm across all categories.

To understand why active managers struggled in some countries but succeeded in others in the short term, we can start by looking at market skew and leadership concentration.

In 2025, Latin American markets experienced notable disparities in performance distributions. In Mexico, for example, the S&P/BMV IRT exhibited moderately positive skew. Only 10 stocks (27.0%) outperformed the benchmark, meaning active managers faced a high probability of selecting underperformers. Chile showed a similar, albeit slightly less skewed outcome, with the strongest performers heavily concentrated among the highest-weighted stocks.

Brazil offered a fascinating case study in active management dynamics. While the broader Brazilian equity market saw a relative absence of positive skewness, with over half of its components (51.6%) outperforming the S&P Brazil BMI, the S&P Brazil LargeCap told a different story.

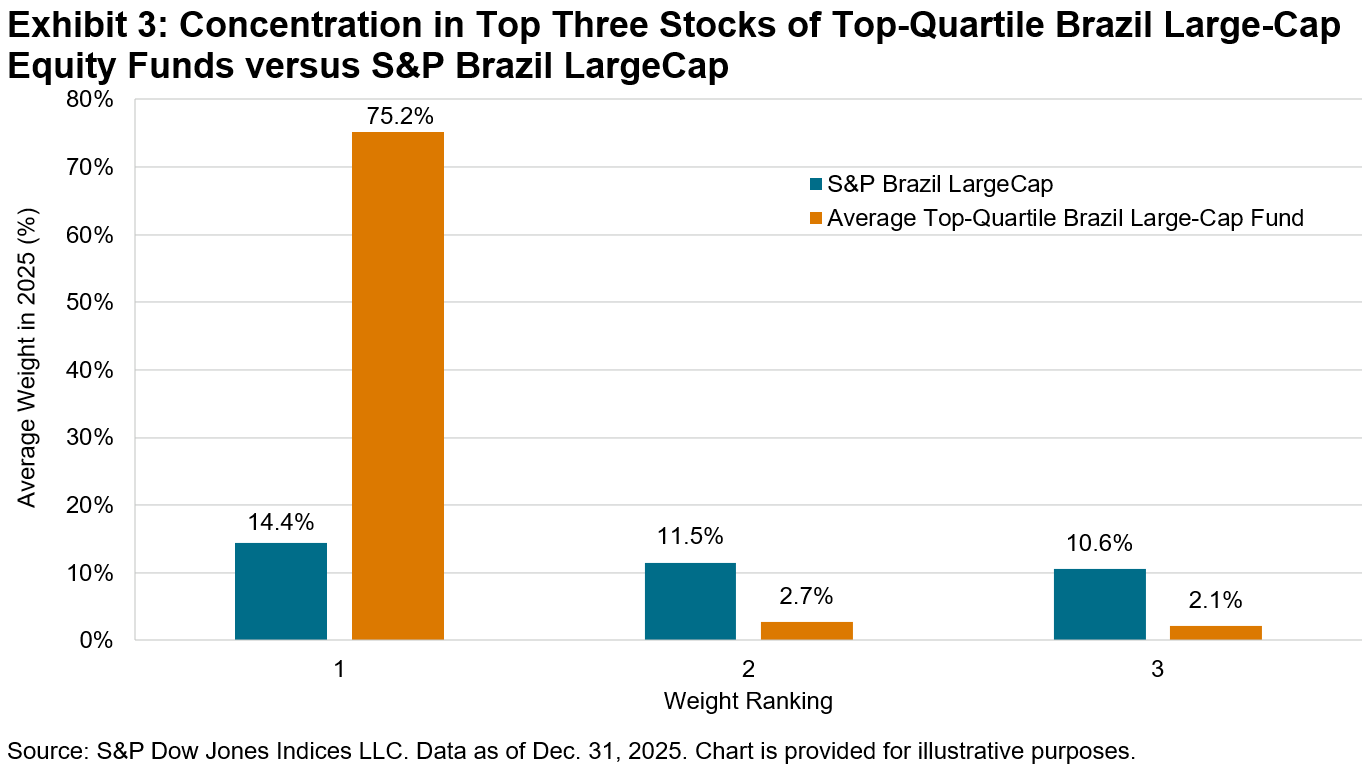
Typically, when a few mega-cap stocks drive a market’s index performance, active funds struggle to keep pace due to portfolio diversification tendencies that shift them away from significant concentration. In 2025, however, Brazil proved to be an exception. Active Brazil Large-Cap funds posted their best results since 2021, aided by highly concentrated positions. While the S&P Brazil LargeCap’s top three constituents accounted for 36.5% of its weight, the average total weight of the top three holdings among top-quartile Brazil Large-Cap equity funds was 80.0%, as shown in Exhibit 3. Perhaps even more remarkably, the average weight of the largest holding in top-quartile Brazil Large-Cap equity funds was 75.2%, illustrating a tilt toward massive single-stock concentration in the pursuit of outperformance.

While riding the momentum of a few large stocks provided a winning ticket for Brazilian large-cap managers in 2025, history serves as a cautionary tale. Relying heavily on a concentrated handful of stocks has carried significant risk when market leadership rotates.

The newly released Latin America Persistence Scorecard Year-End 2025 highlights this exact challenge, answering a critical question: Can these pockets of outperformance be attributed to genuine skill, or are they the result of fleeting luck?

If outperformance were driven by repeatable skill, we would expect it to persist. Instead, the data shows that active management success is overwhelmingly short-lived. Among the 405 funds across Brazil, Chile and Mexico that placed in the top quartile in 2021, a mere 1.2% managed to remain in the top tier over the following four years.

Looking closely at the equity markets, the drop-off was stark. For broad Brazil Equity funds, only 1 out of 81 top-quartile funds from 2021 (1.2%) maintained its status through 2025. In Chile and Mexico, the persistence rate completely vanished; not a single top-quartile equity fund from 2021 maintained its ranking over the subsequent four years.

Furthermore, the data highlighted the possible severe long-term consequences of getting caught on the wrong side of market concentration. Over two consecutive five-year periods, for example, 57.1% of top-quartile Chile Equity funds did not just lose their top-tier status; they fell to the bottom quartile or were liquidated entirely.

Ultimately, 2025 was a record-breaking year for Latin American equities in an absolute sense. Yet, from a relative perspective, the underlying mechanics of skew and concentration proved difficult for most active managers to navigate. The past year may have offered brief pockets of active success in markets like Brazil, but the long-standing results from the SPIVA and Persistence Scorecards continue to remind us that the song remains the same; over the long term, luck has proven fleeting, and consistent outperformance has remained rare.

The posts on this blog are opinions, not advice. Please read our Disclaimers.

Forecasting Tomorrow’s Dividends: Introducing the S&P/TSX Composite High Dividend Growth Index

Contributor Image
George Valantasis

Director, Factors and Dividends

S&P Dow Jones Indices

Introduction

As an industry leader in dividend index development, S&P Dow Jones Indices (S&P DJI) is committed to launching new and innovative dividend indices across global markets. The newly launched S&P/TSX Composite High Dividend Growth Index reflects this, representing the first application of the S&P Global Market Intelligence Dividend Forecasting Dataset within the S&P/TSX Composite Index universe. The index employs a distinct methodology, selecting companies that have demonstrated stable or growing dividends over the past five years and are projected to deliver the highest dividend yield growth going forward.

In this blog, we will explore the index’s methodology, historical outperformance, enhanced dividend yield and growth, as well as sector allocations versus the S&P/TSX Composite Index.

Methodology Overview

To be eligible for selection, constituents must have maintained or grown their dividends for at least five consecutive years, and they must also be projected to continue to do so over the next 12 months.

The index selects the top 50 constituents exhibiting the highest forecast dividend yield growth, determined by subtracting the 12-month historical yield from the 12-month forecast yield. Constituents are then weighted according to their forecast dividend yield, subject to stock and sector constraints.1

Performance Comparison

Using back-tested data starting April 2010, the S&P/TSX Composite High Dividend Growth Index outperformed the S&P/TSX Composite Index, both on an absolute and risk-adjusted basis (see Exhibit 2). Additionally, the index has demonstrated asymmetric capture ratios, participating in over 93% of the benchmark’s upside while the downside capture ratio was less than 78%.

Beyond its strong downside capture, the index has shown notable downside protection during historical drawdown periods over the back-tested period, outperforming the S&P/TSX Composite Index in five out of six major drawdowns, with the exception of the March 2020 COVID-19 downturn. On average, the S&P/TSX Composite High Dividend Growth Index experienced a drawdown of -9.4%, compared to -13.4% for the S&P/TSX Composite Index, equating to less than 70% of the benchmark’s downside.

Dividend Comparison

A distinctive feature of the index methodology is its selection of constituents based on forecast dividend yield growth, rather than DPS growth. This important distinction has historically resulted in the index reflecting a combination of both strong current yield and anticipated future dividend growth (see Exhibits 4 and 5).

As of April 30, 2026, the S&P/TSX Composite High Dividend Growth Index had a yield of 3.76%, standing 1.60% above the S&P/TSX Composite Index’s yield of 2.16%. This yield premium exceeds the historical average spread of 1.12% by 38 bps.

Over the full back-tested period, the S&P/TSX Composite High Dividend Growth Index posted a 7.2% annualized dividend growth rate, outpacing the S&P/TSX Composite Index’s 5.4% and the 2.6% CPI inflation rate. The index showed robust dividend growth well above inflation, which may lead to an increase in purchasing power over time.

As of April 30, 2026, the S&P/TSX Composite High Dividend Growth Index is significantly overweight the Real Estate and Utilities sectors, while notably underweight in Financials and Materials. This weighting pattern is consistent with the long-term average, although current sector overweights and underweights are more pronounced than those seen over the long term.

Conclusion

S&P DJI is pleased to introduce this innovative methodology to the S&P/TSX Composite Index. With its distinctive approach, the index has shown outperformance and defensive characteristics, as well as higher dividend yield and growth relative to the S&P/TSX Composite Index over the back-tested period. The index serves as a new tool to track companies with a proven record of dividend growth, strong current dividend yields and projected future dividend growth.

1 See the S&P/TSX Canadian Indices Methodology for more information.

The posts on this blog are opinions, not advice. Please read our Disclaimers.

SPIVA Special Report: Heroes in Haystacks

Can Hero Funds save portfolios? S&P DJI’s Joe Nelesen takes a closer look at our special SPIVA report examining the performance of multi-asset portfolios of funds versus weighted blends of indices. 

The posts on this blog are opinions, not advice. Please read our Disclaimers.

S&P Momentum Indices Shine in April Rally

Contributor Image
Wenli Bill Hao

Director, Factors and Dividends Indices, Product Management and Development

S&P Dow Jones Indices

Momentum strategies, which tend to be known for performing well in trending markets, experienced a historically strong rebound in April. The S&P 500® Momentum Index, S&P MidCap 400® Momentum Index and S&P SmallCap 600® Momentum Index all posted double-digit gains, surpassing their respective benchmarks (see Exhibit 1). Notably, the April performance of the S&P 500 Momentum Index was the largest monthly gain since its inception in 1994.

In this blog, we will review the methodology, performance characteristics and attribution of the S&P Momentum Indices, with particular focus on the S&P 500 Momentum Index, S&P MidCap 400 Momentum Index and S&P SmallCap 600 Momentum Index.

Index Methodology

The S&P Momentum Indices typically utilize 12-month risk-adjusted price momentum to select stocks ranked in the top quintile of their eligible universes (see Exhibit 2).1 To account for short-term reversal effects, the most recent month is excluded when calculating price momentum.2 Employing risk-adjusted momentum instead of raw price momentum may help mitigate the negative impacts of idiosyncratic risk associated with raw momentum and can also reduce downside risks.3

The constituents of the S&P Momentum Indices are weighted by the product of their FMC and momentum score, subject to individual security and sector weight constraints. This approach effectively balances market weight with targeted factor exposure. The indices are rebalanced semiannually, with a 20% buffer rule to help reduce turnover.

A Short- and Long-Term View of Performance

Exhibit 3 demonstrates that all three S&P Momentum Indices have historically outperformed their respective benchmarks based on both absolute and risk-adjusted returns, in both the short and long term.

Over the past year, the S&P 500 Momentum Index, S&P MidCap 400 Momentum Index and S&P SmallCap 600 Momentum Index outperformed their benchmarks by 11.74%, 10.55% and 3.14%, respectively.

Furthermore, these indices have shown favorable capture ratios, delivering higher or similar gains during up markets4 and experiencing smaller declines during down markets.

Top Performance Contributors

Exhibit 4 highlights the top five contributors to the performance of these three S&P Momentum Indices over the one-year period ending April 30, 2026. Broadcom, Lumentum and TTM Technologies were the leading performers in the S&P 500 Momentum Index, S&P MidCap 400 Momentum Index and S&P SmallCap 600 Momentum Index, respectively.

Sectors

Exhibit 5 displays the active sector weights for the S&P Momentum Indices as of April 30, 2026. The S&P 500 Momentum Index overweighed the Information Technology sector by 14.01% relative to the S&P 500. Within the Information Technology sector, it was notably overweight in the Semiconductors and Semiconductor Equipment industry group by 20.61% and underweight in the Software and Services industry group by 7.29%. The S&P MidCap 400 Momentum Index and S&P SmallCap 600 Momentum Index held overweight positions of 15.92% and 5.97%, respectively, in the Industrials sector. All three indices exhibited large underweights in the Consumer Discretionary and Financials sectors.

Conclusion

The April rally underscored the resilience of the S&P Momentum Indices. Their strong performance, driven by a robust risk-adjusted methodology and favorable sector weights, highlights their potential as a systematic approach to reflecting market trends. With their historical outperformance, favorable capture ratios and disciplined rebalancing, these indices provide another tool for navigating the market.


1 Please refer to the S&P Momentum Indices Methodology for more details.

2 Jegadeesh, Narasimhan and Sheridan Titman, “Returns to Buying Winners and Selling Losers: Implications for Stock Market Efficiency,” The Journal of Finance, Vol. 48, No. 1, March 1993.

3 Fan, Minyou, Kearney Fearghal, Youwei Li and Jiadong Liu, “Momentum and the Cross-section of Stock Volatility,” Journal of Economic Dynamics and Control, Volume 144, November 2022.

4 The market is defined as the monthly performance of the underlying benchmarks from March 31, 1995, to April 30, 2026.


The posts on this blog are opinions, not advice. Please read our Disclaimers.

Beyond Mega Caps: Navigating Concentration and Diversification in Crypto Index Construction

Contributor Image
Felipe Diaz

Analyst, Global Exchanges & Digital Assets

S&P Dow Jones Indices

Cryptocurrency investing straddles two seemingly contradictory truths: market leadership changes fast, yet overall exposure remains dominated by a handful of top assets. From 2018 to 2025, Bitcoin and Ethereum—two mega caps¹—held a combined average weight of 78% in the S&P Cryptocurrency Broad Digital Asset (BDA) Index, while the top five constituents made up roughly 86% of the total index weight.

Outside that group, turnover has been notable: six of today’s top 10 assets in the S&P Cryptocurrency BDA Index either weren’t in the top 10 in 2017 or didn’t yet exist, and Bitcoin Cash’s weight collapsed from 9.4% to 0.5% over the same window.

Managing Turnover in a Fast-Moving Market

To reflect this shifting universe without excessive turnover, S&P DJI’s multi-coin strategies rebalance quarterly. For the S&P Top N Indices (targeting 5, 10, 20 or 30 constituents), a key design consideration is the 80/120 buffer rule built into the S&P Digital Assets Index Methodology: assets ranking in the top 80% of the target count are automatically included, while current constituents ranking within the top 120% receive priority for the remaining slots. This protects existing constituents from being swapped out due to the minor, short-term price fluctuations typical of crypto.

Choosing among Weighting Approaches

With the universe defined, market participants can select among indices ranging from market cap to equal weight. While some prefer cap weighting, others prefer equal weighting to give relatively greater representation to smaller cryptocurrencies.

Diversification, however, generally isn’t cost-free. The S&P Cryptocurrency Top 5 Equal Weight Index underperformed its cap-weighted benchmark by more than 14% annualized since March 2018 and showed higher volatility. While established equity factors (value, growth, quality) don’t yet cleanly translate to crypto, the result here is consistent with a size bias: equal weighting mechanically underweights mega caps and overweights altcoins, which tend to be smaller and more volatile. Altcoins have often rallied hardest during liquidity-driven runs (as seen during the 2021 and 2023 recoveries) and fallen hardest during drawdowns. In 2022, the S&P Cryptocurrency Top 5 Equal Weight Index suffered a 74% drawdown versus 66% for its cap-weighted counterpart.

As a middle ground, the S&P Cryptocurrency Top 20 Select 35/20 Capped Index caps the largest constituent at 35%, with all remaining constituents capped at 20%—a familiar traditional finance mechanism applied to crypto. Yet the cost of diversification is visible here too: over seven years, the capped version underperformed its uncapped benchmark by 9.6% annualized (34% versus 44%) with higher realized volatility (77% versus 71%).

Looking Ahead

Mega-cap dominance has historically rewarded concentrated, cap-weighted exposure—and because the cap-weighted S&P Cryptocurrency BDA Index has historically carried approximately 86% of its weight in its five largest assets, it has behaved in practice much like a mega-cap-tilted portfolio. Should maturing regulation and broader adoption erode that concentration, altcoins may play a larger role in index design, and structural differences may be seen across the Top 10, Top 20, and 35/20 capped strategies that imply changes in liquidity, volatility and risk.

¹ Mega caps here refer to Bitcoin and Ethereum, the only two assets to hold top two positions consistently since 2017.

The posts on this blog are opinions, not advice. Please read our Disclaimers.