Get Indexology® Blog updates via email.

In This List

Digging into the Divide in Global Financials

S&P/ASX Sustainability Screened Dividend Opportunities Index: 2025 Performance Review

The Drone Identity: Beyond Defense

The Dow Jones Dividend 100 Indices Shine in a Strong Start to the Year

Why Do U.S. Equities and the S&P 500 Matter in South Korea?

Digging into the Divide in Global Financials

Contributor Image
Euan Smith

Quantitative Analyst, Index Investment Strategy

S&P Dow Jones Indices

Since the beginning of 2025, the global Financials sector has experienced a significant shift. For several years, across the developed world, the sector had been sailing in roughly the same direction, though generally the U.S. at a higher rate of knots. In 2025, market winds blew the S&P 500 Financials (Sector) and the S&P World Ex-U.S. Financials (Sector) Index in significantly different directions. This piece unpacks the drivers of this divergence.

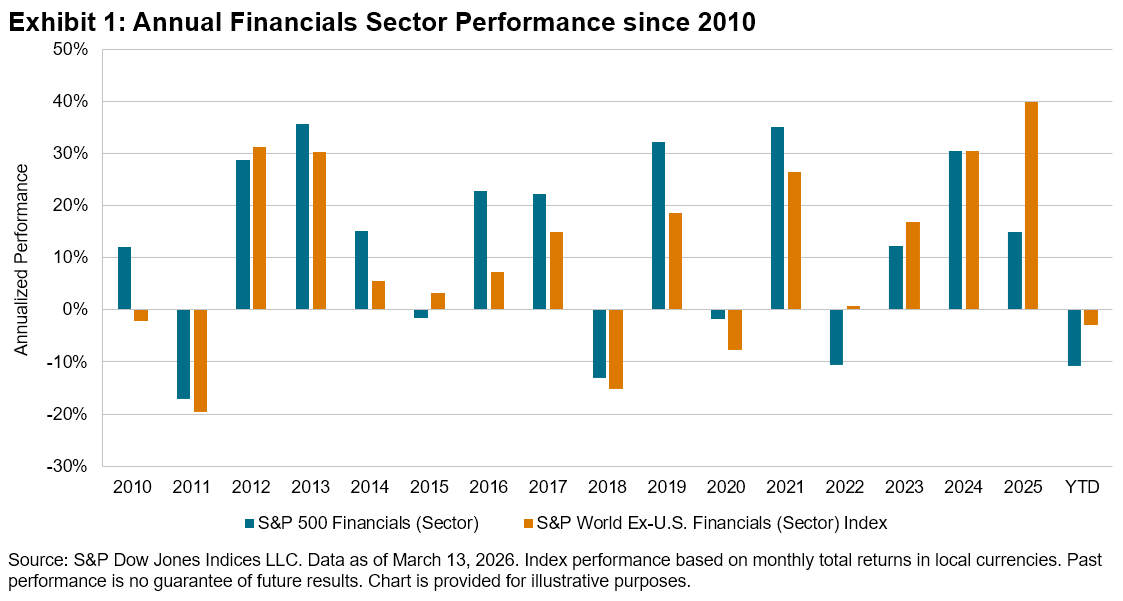
Exhibits 1 and 2 highlight the recent change. Exhibit 1 shows annual index performance since 2010. In 11 of the 15 years prior to 2025, the U.S. Financials sector outperformed the ex-U.S. sector, and on occasions where the latter outperformed it was never by more than 12%. However, in 2025, the S&P World Ex-U.S. Financials Index outperformed by nearly 25%, and so far in 2026, it is over 7% ahead.

Correlations between the sectors have fallen recently, as shown in Exhibit 2.

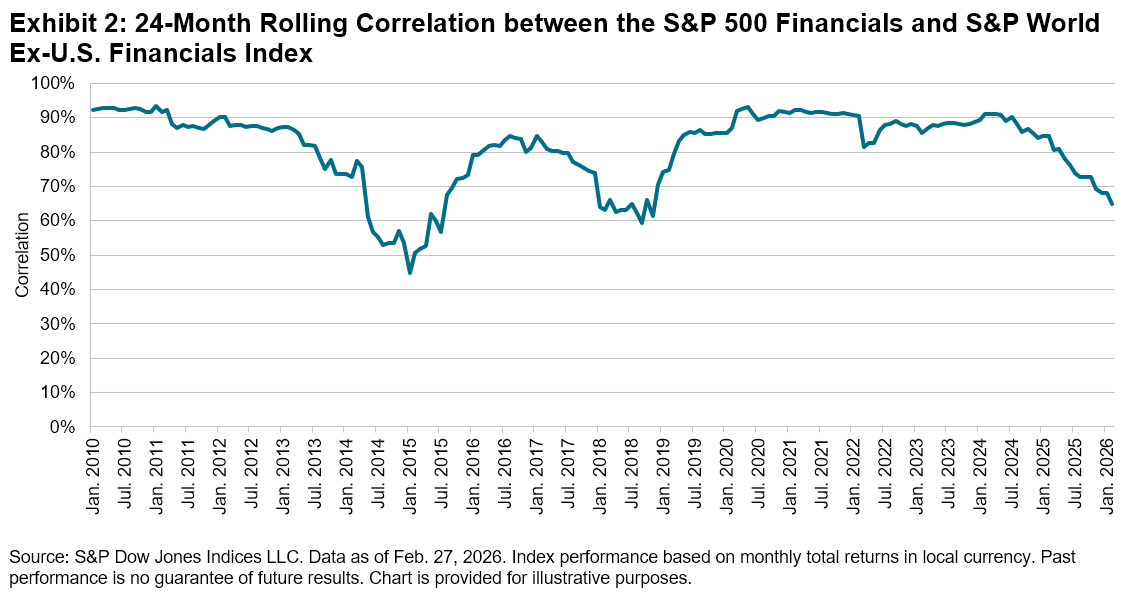
Fluctuations are normal and correlations have been lower since 2010, but this, combined with the recent performance, demonstrates a clear change, which begs the question—why? Observing fundamental performance and index composition begins to provide an answer.

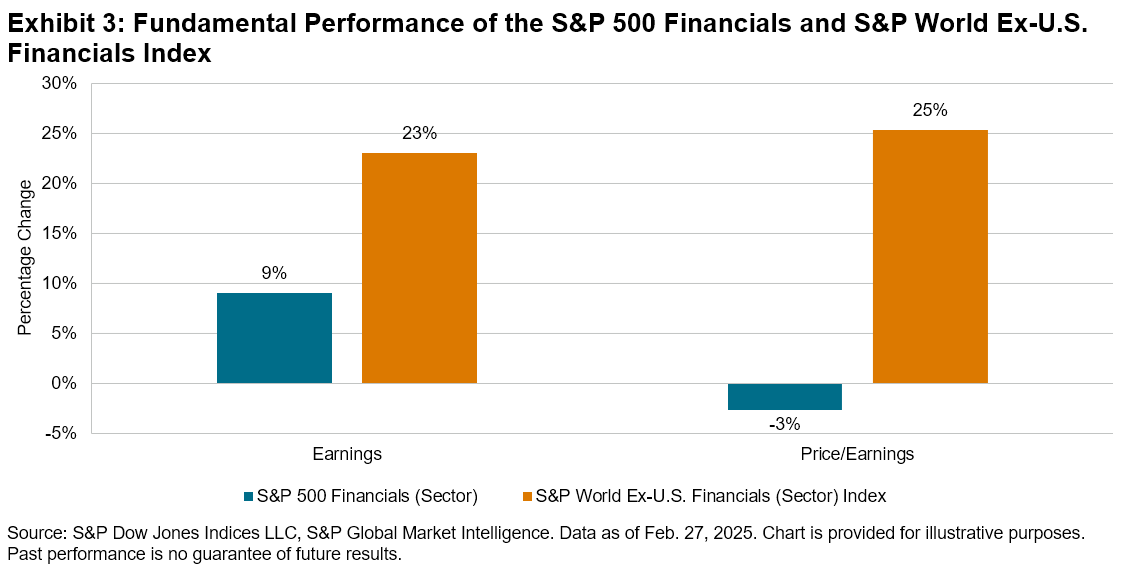
Exhibit 3 shows changes in both earnings and P/E since the start of 2025. Both indices saw solid earnings growth, especially the S&P World Ex-U.S. Financials Index at 23% compared to 9% for the S&P 500 Financials. The far larger differentiator, however, was that ex-U.S. P/E multiples saw large expansion, while in the U.S. they contracted slightly.

The performance divergence coincided with the U.S. tariff announcements in mid-February 2025, making them possible contributors to this sentiment shift. However, a more favorable monetary environment and increasing profitability may have also been drivers. Clearly though, market sentiment toward the ex-U.S. Financials sector has shifted significantly, resulting in a rerating relative to their U.S. peers since early 2025.

Despite this, the S&P World Ex-U.S. Financials Index is still a long way from parity with the S&P 500 Financials. Currently, P/E levels are around 14.3 for the S&P World Ex-U.S. Financials Index compared to 17.3 for the S&P 500 Financials.

These indices reflect more than just different macro measurements of the same sector. Owing to the differences in the makeup of the Financials sector globally, they have distinct GICS industry weights, as demonstrated in Exhibit 4.

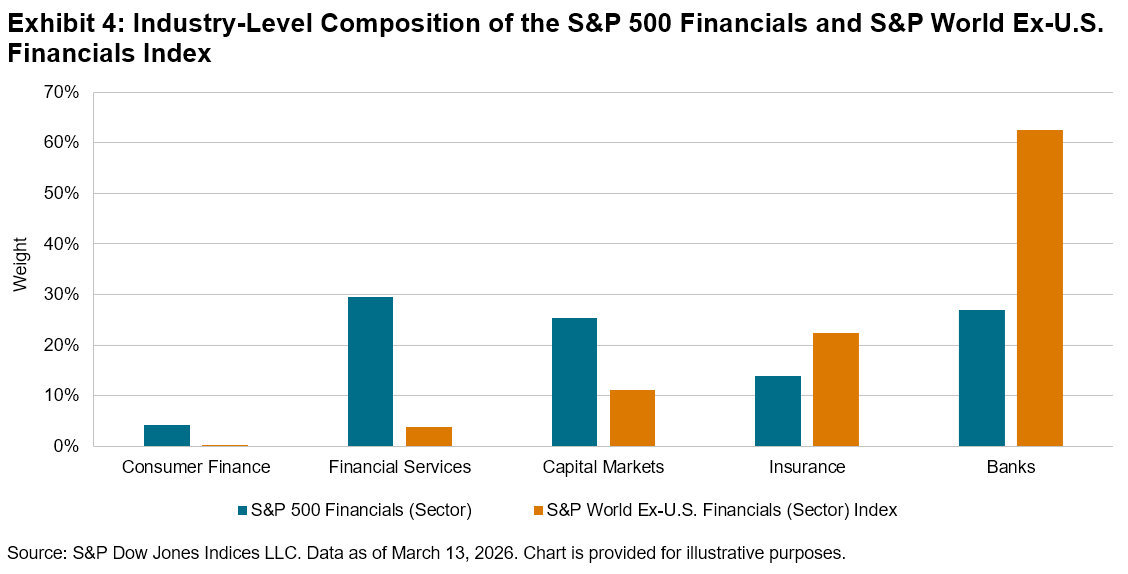
Within the S&P 500 Financials, the sector is diversified across industries, with significant weights in the Capital Markets, Financial Services and Banks industries, spanning a range of companies from investment banks to cryptocurrency exchanges. In contrast, the S&P World Ex-U.S. Financials Index is dominated by the Banks industry.

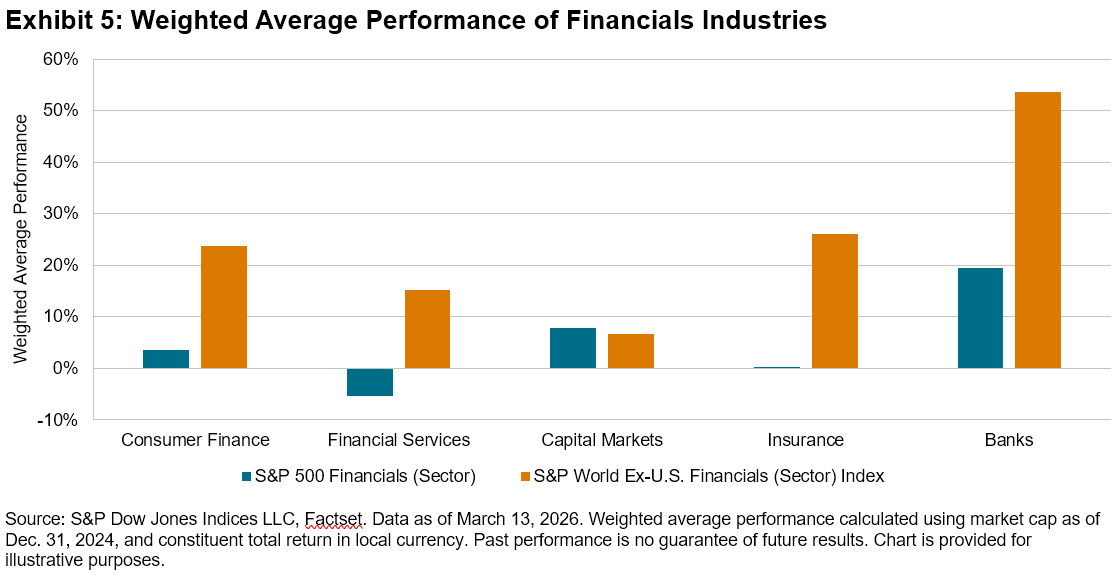
Differences in industry weights give each index distinct sensitivities to market trends, causing potential performance differences. Exhibit 5 shows that, since early 2025, Banks have been the top-performing industry in both regions, benefitting the S&P World Ex-U.S. Financials Index. Additionally, four out of five S&P World Ex-U.S. Financials Index industries outperformed their S&P 500 Financials equivalents, demonstrating the impact of sentiment changes.

Whether 2025 was an anomaly or the beginning of a new regime for Financials remains uncertain. Sustained outperformance of the Banks industry or a lasting shift in sentiment due to geopolitical events could benefit the S&P World Ex-U.S. Financials Index. Conversely, performance may revert to the historical dominance of the S&P 500 Financials. In this uncertain landscape, sector indices provide a valuable perspective on how these dynamics unfold.

The posts on this blog are opinions, not advice. Please read our Disclaimers.

S&P/ASX Sustainability Screened Dividend Opportunities Index: 2025 Performance Review

Contributor Image
Izzy Wang

Associate Director, Factors and Dividends

S&P Dow Jones Indices

The S&P/ASX Sustainability Screened Dividend Opportunities Index delivered a standout performance in 2025, establishing itself as the best performer among all the S&P Factor Indices in the Australian equity landscape. The index posted a robust calendar year return of 21.22%, outpacing the S&P/ASX 300 by 10.9% (see Exhibit 1).

In addition to its recent outperformance, the S&P/ASX Sustainability Screened Dividend Opportunities Index consistently outperformed the S&P/ASX 300 over the mid and long term as well. As Exhibit 2 shows, it outperformed the S&P/ASX 300 over the 1-, 3-, 5- and 10-year periods, and over the full 14-year back-tested history since Jan. 31, 2012. Since its launch on Oct. 17, 2022, the index has achieved an excess annual return of 4.43% compared to the S&P/ASX 300.

Index Construction

The construction of the S&P/ASX Sustainability Screened Dividend Opportunities Index is underpinned by a transparent, rules-based approach that reflects both income and sustainability considerations (see Exhibit 3).1 The process begins by considering all stocks in the S&P/ASX 300 universe, excluding REITs. First, all stocks go through eligibility screens that include market size, liquidity and earnings-per-share (EPS) filters to avoid illiquid and unprofitable stocks. Second, the eligible stocks go through a series of sustainability screens to exclude companies involved in traditional energy, including oil & gas and thermal coal, and controversial businesses such as gambling, alcohol, tobacco, etc. After the eligibility and sustainability screens, the 50 stocks with the highest 12-month forecast dividend yield will be selected as index constituents. Constituents are weighted by the product of float-adjusted market cap and dividend yield, subject to single-stock and sector caps.

Sector Characteristics

A closer look at the sector composition of the S&P/ASX Sustainability Screened Dividend Opportunities Index reveals both commonalities with and distinctions from other high dividend strategies. Exhibit 4 compares the index’s sector weights with those of the S&P/ASX 300 and with the average of two other S&P/ASX indices that focus on high dividend yield.2

Like many dividend-focused indices, the S&P/ASX Sustainability Screened Dividend Opportunities Index tends to overweight Financials, Materials and Industrials—sectors that have historically provided robust dividend streams and stable earnings. Conversely, it is underweight in Health Care and Information Technology relative to the S&P/ASX 300.

While high dividend strategies often have significant allocations to Energy and Utilities—sectors known for high dividend payouts—the S&P/ASX Sustainability Screened Dividend Opportunities Index had no weight in these sectors in 2025. This exclusion is a direct result of the sustainability criteria.

Performance Attribution

The index’s outperformance in 2025 was driven by a combination of allocation and stock selection effects. Exhibit 5 shows the sector attribution analysis of the S&P/ASX Sustainability Screened Dividend Opportunities Index against the S&P/ASX 300.

One of the most significant contributors was the index’s underweight position in Health Care and Information Technology. Facing considerable headwinds in the Australian market during 2025, Health Care and Information Technology were two sectors within the S&P/ASX 300 that posted negative performance for the year. Given that the sectors collectively accounted for around 12% of the S&P/ASX 300’s average sector weight, the near-zero exposure in the S&P/ASX Sustainability Screened Dividend Opportunities Index helped to boost its performance in 2025. In addition to sector differences, stock selection within Financials and Consumer Discretionary also played a crucial role.

The S&P/ASX Sustainability Screened Dividend Opportunities Index has historically demonstrated that incorporating sustainability screens could lead to distinctive characteristics compared to pure high dividend yield indices, which may contribute to the index performance. The S&P/ASX Sustainability Screened Dividend Opportunities Index is a unique benchmark for tracking high dividend yield stocks in the ASX market while incorporating sustainability considerations.

1 For more detailed information, please see the index methodology.

2 The S&P/ASX Dividend Opportunities Index and S&P/ASX 200 High Dividend Index

The posts on this blog are opinions, not advice. Please read our Disclaimers.

The Drone Identity: Beyond Defense

Contributor Image
Srineel Jalagani

Senior Director, Thematic Indices

S&P Dow Jones Indices

The idea of unmanned flying machines has existed in human imagination for millennia. However, drones as we know them today only became a practical reality in the late 20th century with systems such as the Predator drone that was developed in the 1990s.

Drone technology has evolved rapidly from its early military origins. Currently, drones are also being used far beyond defense in logistics, infrastructure inspection, agriculture, environmental monitoring and emergency response. Their ability to collect data and reach difficult terrain has made them increasingly valuable across industries.

As drones become more central to industry and national security, benchmarks like the S&P Kensho Drones Index can help track the growth of this ecosystem. The S&P Kensho Drones Index measures U.S. companies involved in the development and deployment of remotely operated or autonomous aerial and marine drones. Importantly, the index goes beyond drone manufacturers to include firms that supply critical technologies enabling drone capabilities. Sensors, edge-computing chips, communications hardware and navigation systems form the backbone of drones and support their expanding use across civilian and military markets.1

The S&P Kensho Drones Index has been one of the strongest performers recently within the S&P Kensho New Economies framework, which tracks 25 themes shaping the Fourth Industrial Revolution (see the S&P Thematics Dashboard for additional information). The index was up roughly 21% YTD as of March 6, 2026, pushing its 12-month gain to around 75%, placing it near the top of the S&P Kensho New Economies leaderboard.

This YTD gain has been broad-based, with roughly three-quarters of index constituents (18) contributing positively to performance. By GICS industry, the largest contributions came from Aerospace & Defense, Electronic Components & Equipment and Energy Equipment & Services. The presence of Energy Equipment & Services firms highlights the growing role of industrial drone applications.

Three Energy companies, Oceaneering International, Forum Energy Technologies and TechnipFMC, accounted for three of the five largest contributors to the index’s YTD performance. These three companies operate subsea robotic systems used for pipeline inspection, subsea maintenance and deepwater oil & gas operations. Their strong contributions highlight how drone and robotic technologies are increasingly embedded in traditional industrial sectors such as Energy.

Notably, the broader Oil & Gas Equipment & Services industry has recently broken out of its three-year trading range. This industry’s momentum has supported the performance of Energy-focused companies within the S&P Kensho Drones Index.

The benefits of the index’s diversification across the drone value chain become even clearer when looking at earlier periods of performance. During the period from April 2025 to October 2025, when the index gained roughly 80%, performance was driven primarily by defense companies benefiting from geopolitical tensions and multi-year government defense spending commitments. While the underlying drivers may vary over time, they remain linked by a common thread (i.e., the expanding role of drones and autonomous systems across defense, industrial and commercial markets).

Several structural forces have recently strengthened the growth of the drone industry.

  • Policy Support and Regulatory Expansion: Governments are increasingly prioritizing domestically produced and trusted drone technologies.2 In the U.S., legislation such as the FY2026 NDAA3 requires key components to be sourced from the U.S. or allied countries, while expanding Beyond Visual Line of Sight (BVLOS)4 rules are enabling drones to operate over longer distances and unlocking new infrastructure and industrial use cases.
  • Hardware Innovation: Advances in chips, batteries and sensors are expanding drone capabilities. Edge-computing chips enable real-time onboard processing5 improved batteries extend flight times and new sensing technologies support more advanced inspection and monitoring tasks.
  • AI as the Intelligence Multiplier: AI is turning drones into autonomous systems capable of navigation, analysis and decision-making in real time. AI also enables drones to operate as part of connected networks6 with satellites, ground robots and other autonomous platforms.

As drones become embedded across defense and industrial systems, the S&P Kensho Drones Index seeks to track this evolving ecosystem across aerial and marine drone technologies and their enabling components.

1 Please see the S&P Kensho Indices Methodology for more information.

2 European Union, “Action Plan on Drone and Counter Drone Security,” Feb. 11, 2026.

3 House Armed Services Committee, “The FY26 NDAA.”

4 Federal Aviation Administration, “BVLOS Fact Sheet.”

5 Micron, “Edge AI in the sky,” September 2025.

6 McKinsey, “Future defense tech: Multidomain stacks to build affordable mass,” Feb. 12, 2026.

The posts on this blog are opinions, not advice. Please read our Disclaimers.

The Dow Jones Dividend 100 Indices Shine in a Strong Start to the Year

Contributor Image
Wenli Bill Hao

Director, Factors and Dividends Indices, Product Management and Development

S&P Dow Jones Indices

As market volatility continues in the U.S., the Dow Jones U.S. Dividend 100 Index and Dow Jones International Dividend 100 Index have emerged as standout performers. Year-to-date (YTD) as of Feb. 28, 2026, both indices have posted double-digit gains (see Exhibit 1).

Notably, the Dow Jones U.S. Dividend 100 Index has outperformed its benchmark universe by 14.81% YTD. This outperformance has largely been driven by its overweights in the Energy and Consumer Staples sectors, as well as its underweight in Information Technology. The index’s top four holdings—Lockheed Martin, ConocoPhillips, Verizon and Chevron—have each posted returns exceeding 20% in 2025, helping drive index-level performance.

In this blog, we will examine their index methodology, historical performance and key characteristics.

Methodology Overview

What differentiates the Dow Jones Dividend 100 Indices—and has contributed to their long-term outperformance—is their emphasis on dividend consistency combined with a multi-factor selection process that blends two dividend metrics with two quality measures. The methodology begins by excluding companies that have not paid dividends for at least 10 consecutive years. Next, eligible stocks are ranked by their indicated annualized dividend (IAD) yield, with those falling below the median IAD yield removed (see Exhibit 2).

From the remaining pool, the top 100 companies are selected based on a composite score that combines the following four factors: free cash flow to total debt, return on equity, IAD yield and five-year dividend growth rate. For the Dow Jones International Dividend 100 Index, an additional screen is applied, removing the bottom half of stocks with the highest three-year price volatility before final selection.2

The selected constituents are weighted by capped float-adjusted market capitalization, with stock and sector caps in place that aim to reduce concentration risk and enhance diversification.

Performance History

Over the long term, including back-tested results, the Dow Jones Dividend 100 Indices have outperformed their benchmark universes, both in absolute total return and risk-adjusted terms. The Dow Jones International Dividend 100 Index has outperformed over short-, medium- and long-term horizons. Similarly, the Dow Jones U.S. Dividend 100 Index has outperformed across both short- and long-term periods.

In addition to outperformance, both indices have exhibited lower risk and reduced drawdowns compared to their benchmark universes (see Exhibit 3).

Enhanced Dividend Yield and Dividend Growth

The Dow Jones Dividend 100 Indices have consistently posted higher dividend yields compared to their respective benchmarks (see Exhibit 4). Over the period from Dec. 31, 2006, to Dec. 31, 2025, the Dow Jones U.S. Dividend 100 Index averaged a yield of 3.82%, significantly higher than the 1.75% yield of the Dow Jones U.S. Broad Stock Market Index. Similarly, the Dow Jones International Dividend 100 Index posted an average yield of 4.42%, outperforming the Dow Jones Global ex-U.S. Index, which averaged 2.99%.

By prioritizing dividend growth, strong fundamentals and high yield as primary selection criteria, the indices also posted significantly higher dividend growth rates than their respective benchmark universes over the 10-year period from Dec. 31, 2015, to Dec. 31, 2025. Importantly, these elevated dividend growth rates have historically outpaced long-term inflation rates in their respective markets, providing a potential hedge against inflation and helping to preserve purchasing power over time.

Quality and Value Tilts

The Dow Jones Dividend 100 Indices have tended to exhibit favorable value and quality characteristics relative to their respective benchmarks (see Exhibit 6). In valuation terms, as of Feb. 28, 2026, both dividend indices are trading at a discount relative to their respective benchmarks, while exhibiting comparable or higher profitability.

Conclusion

The Dow Jones U.S. Dividend 100 Index and Dow Jones International Dividend 100 Index have shown sustained dividend payment and dividend growth historically. From March 31, 2005, to Feb. 28, 2026, including back-tested analysis, they have outperformed their respective benchmarks in both absolute and risk-adjusted terms, while exhibiting lower risk and drawdowns. Furthermore, their distinct quality and value characteristics—such as higher profitability and discounted valuations—may help market participants navigate changing market conditions with greater confidence.

1 For the Dow Jones International Dividend 100 Index, we note we use the Dow Jones Global ex-U.S. Index as its benchmark comparison, as it also includes small-cap constituents, while its universe indices are the Dow Jones Global ex-U.S. Large-Cap and Dow Jones Global ex-U.S. Mid-Cap.

2 Please refer to the methodology of the Dow Jones Dividend 100 Indices for more details.

The posts on this blog are opinions, not advice. Please read our Disclaimers.

Why Do U.S. Equities and the S&P 500 Matter in South Korea?

S&P DJI’s Sue Lee examines the importance of the S&P 500 in the global equity opportunity set, key diversification and sector composition differences between notable U.S. equity and Korean benchmarks and the challenges faced by active managers in the U.S. and South Korea to outperform this iconic index. 

The posts on this blog are opinions, not advice. Please read our Disclaimers.