Get Indexology® Blog updates via email.

In This List

S&P/ASX Sustainability Screened Dividend Opportunities Index: 2025 Performance Review

The Drone Identity: Beyond Defense

The Dow Jones Dividend 100 Indices Shine in a Strong Start to the Year

Why Do U.S. Equities and the S&P 500 Matter in South Korea?

Unveiling the Dow Jones Japan Select Dividend Index

S&P/ASX Sustainability Screened Dividend Opportunities Index: 2025 Performance Review

Contributor Image
Izzy Wang

Associate Director, Factors and Dividends

S&P Dow Jones Indices

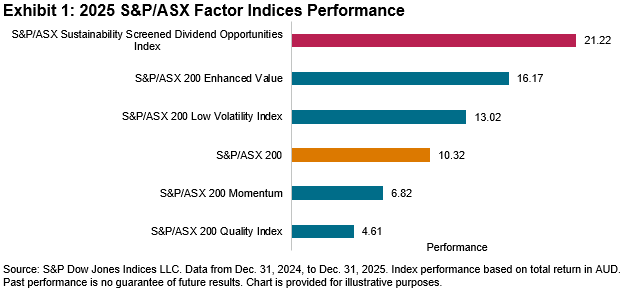
The S&P/ASX Sustainability Screened Dividend Opportunities Index delivered a standout performance in 2025, establishing itself as the best performer among all the S&P Factor Indices in the Australian equity landscape. The index posted a robust calendar year return of 21.22%, outpacing the S&P/ASX 300 by 10.9% (see Exhibit 1).

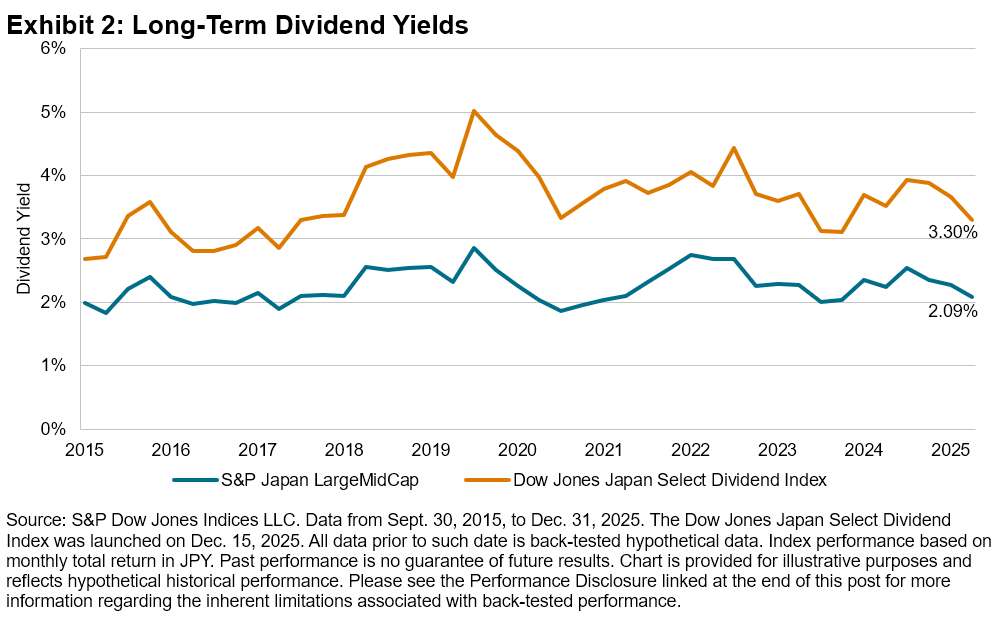
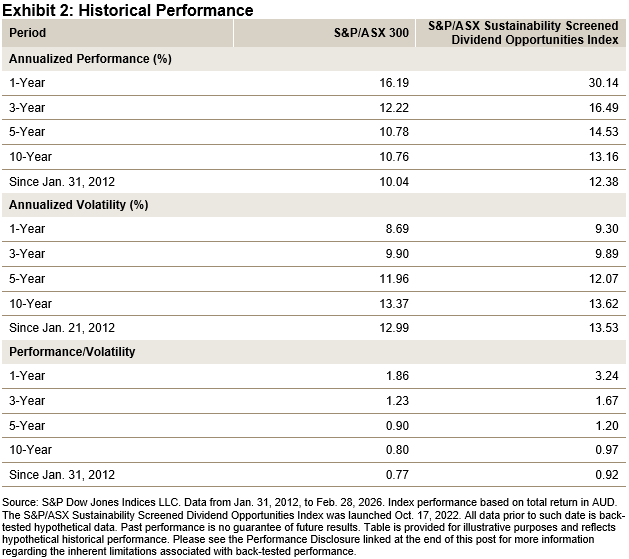
In addition to its recent outperformance, the S&P/ASX Sustainability Screened Dividend Opportunities Index consistently outperformed the S&P/ASX 300 over the mid and long term as well. As Exhibit 2 shows, it outperformed the S&P/ASX 300 over the 1-, 3-, 5- and 10-year periods, and over the full 14-year back-tested history since Jan. 31, 2012. Since its launch on Oct. 17, 2022, the index has achieved an excess annual return of 4.43% compared to the S&P/ASX 300.

Index Construction

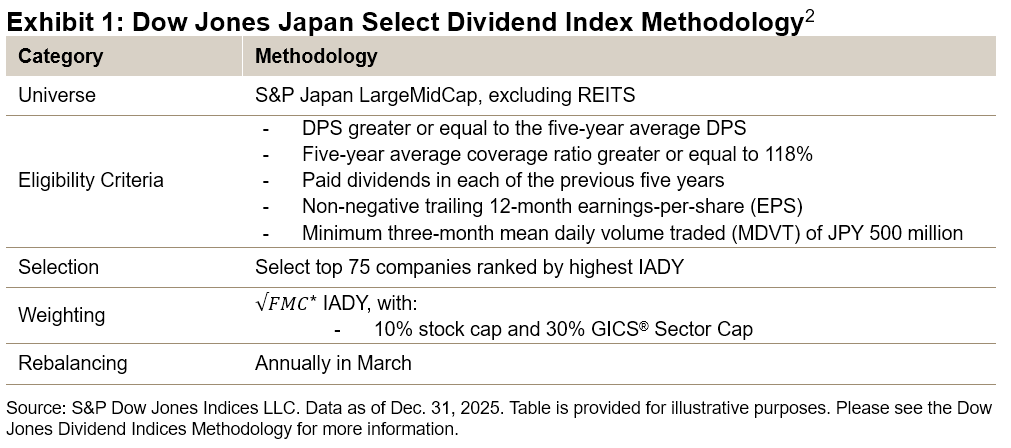
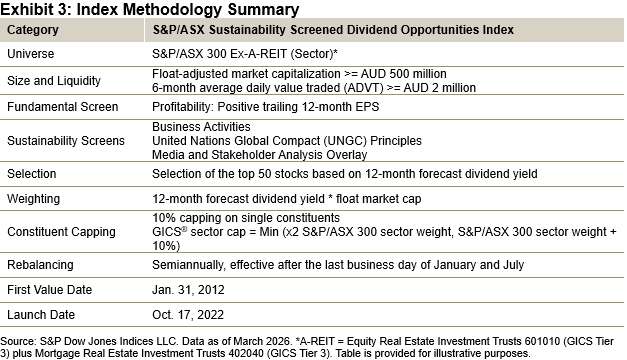
The construction of the S&P/ASX Sustainability Screened Dividend Opportunities Index is underpinned by a transparent, rules-based approach that reflects both income and sustainability considerations (see Exhibit 3).1 The process begins by considering all stocks in the S&P/ASX 300 universe, excluding REITs. First, all stocks go through eligibility screens that include market size, liquidity and earnings-per-share (EPS) filters to avoid illiquid and unprofitable stocks. Second, the eligible stocks go through a series of sustainability screens to exclude companies involved in traditional energy, including oil & gas and thermal coal, and controversial businesses such as gambling, alcohol, tobacco, etc. After the eligibility and sustainability screens, the 50 stocks with the highest 12-month forecast dividend yield will be selected as index constituents. Constituents are weighted by the product of float-adjusted market cap and dividend yield, subject to single-stock and sector caps.

Sector Characteristics

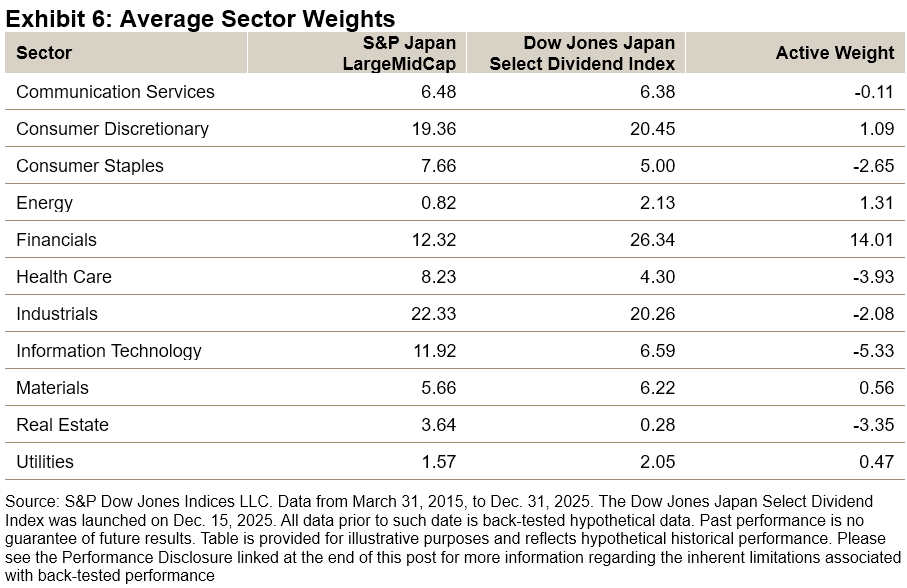
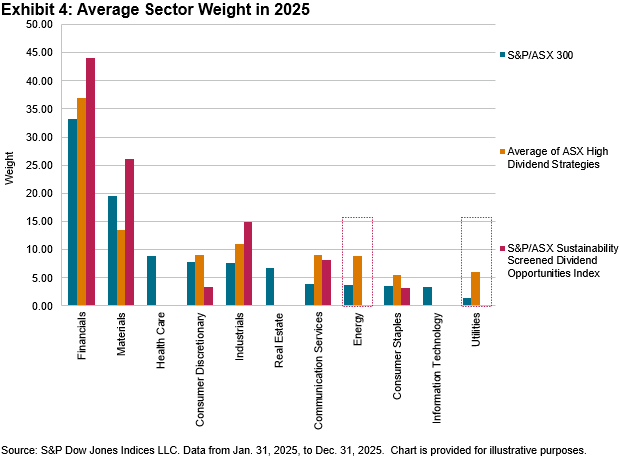
A closer look at the sector composition of the S&P/ASX Sustainability Screened Dividend Opportunities Index reveals both commonalities with and distinctions from other high dividend strategies. Exhibit 4 compares the index’s sector weights with those of the S&P/ASX 300 and with the average of two other S&P/ASX indices that focus on high dividend yield.2

Like many dividend-focused indices, the S&P/ASX Sustainability Screened Dividend Opportunities Index tends to overweight Financials, Materials and Industrials—sectors that have historically provided robust dividend streams and stable earnings. Conversely, it is underweight in Health Care and Information Technology relative to the S&P/ASX 300.

While high dividend strategies often have significant allocations to Energy and Utilities—sectors known for high dividend payouts—the S&P/ASX Sustainability Screened Dividend Opportunities Index had no weight in these sectors in 2025. This exclusion is a direct result of the sustainability criteria.

Performance Attribution

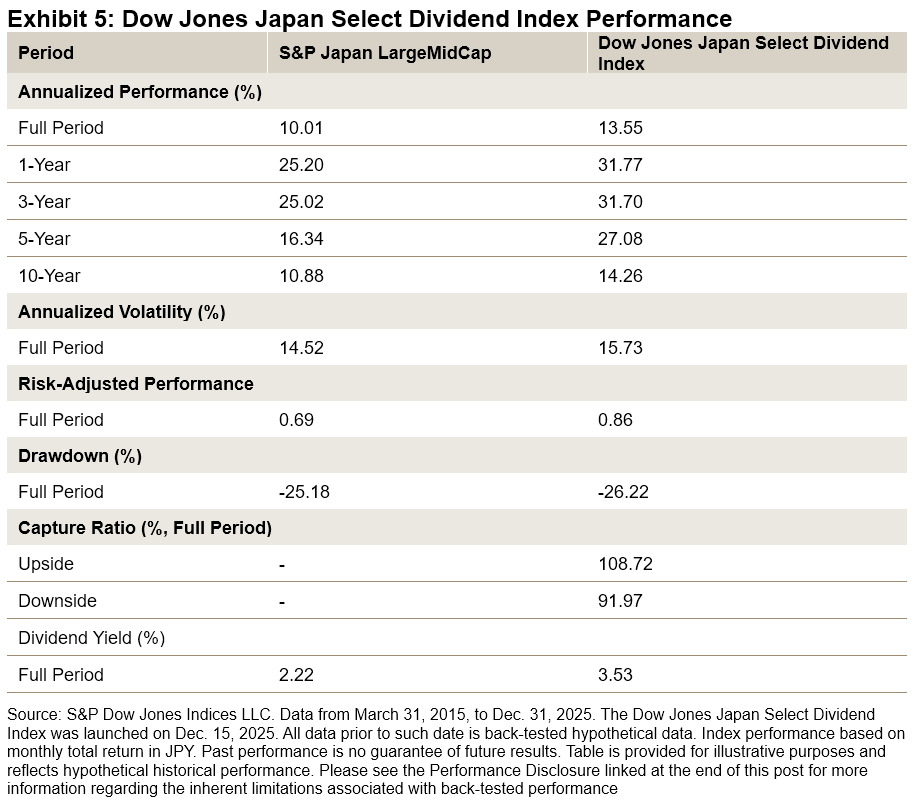
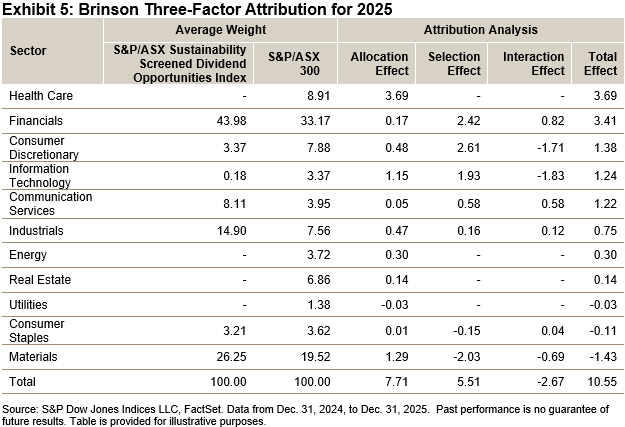
The index’s outperformance in 2025 was driven by a combination of allocation and stock selection effects. Exhibit 5 shows the sector attribution analysis of the S&P/ASX Sustainability Screened Dividend Opportunities Index against the S&P/ASX 300.

One of the most significant contributors was the index’s underweight position in Health Care and Information Technology. Facing considerable headwinds in the Australian market during 2025, Health Care and Information Technology were two sectors within the S&P/ASX 300 that posted negative performance for the year. Given that the sectors collectively accounted for around 12% of the S&P/ASX 300’s average sector weight, the near-zero exposure in the S&P/ASX Sustainability Screened Dividend Opportunities Index helped to boost its performance in 2025. In addition to sector differences, stock selection within Financials and Consumer Discretionary also played a crucial role.

The S&P/ASX Sustainability Screened Dividend Opportunities Index has historically demonstrated that incorporating sustainability screens could lead to distinctive characteristics compared to pure high dividend yield indices, which may contribute to the index performance. The S&P/ASX Sustainability Screened Dividend Opportunities Index is a unique benchmark for tracking high dividend yield stocks in the ASX market while incorporating sustainability considerations.

1 For more detailed information, please see the index methodology.

2 The S&P/ASX Dividend Opportunities Index and S&P/ASX 200 High Dividend Index

The posts on this blog are opinions, not advice. Please read our Disclaimers.

The Drone Identity: Beyond Defense

Contributor Image
Srineel Jalagani

Senior Director, Thematic Indices

S&P Dow Jones Indices

The idea of unmanned flying machines has existed in human imagination for millennia. However, drones as we know them today only became a practical reality in the late 20th century with systems such as the Predator drone that was developed in the 1990s.

Drone technology has evolved rapidly from its early military origins. Currently, drones are also being used far beyond defense in logistics, infrastructure inspection, agriculture, environmental monitoring and emergency response. Their ability to collect data and reach difficult terrain has made them increasingly valuable across industries.

As drones become more central to industry and national security, benchmarks like the S&P Kensho Drones Index can help track the growth of this ecosystem. The S&P Kensho Drones Index measures U.S. companies involved in the development and deployment of remotely operated or autonomous aerial and marine drones. Importantly, the index goes beyond drone manufacturers to include firms that supply critical technologies enabling drone capabilities. Sensors, edge-computing chips, communications hardware and navigation systems form the backbone of drones and support their expanding use across civilian and military markets.1

The S&P Kensho Drones Index has been one of the strongest performers recently within the S&P Kensho New Economies framework, which tracks 25 themes shaping the Fourth Industrial Revolution (see the S&P Thematics Dashboard for additional information). The index was up roughly 21% YTD as of March 6, 2026, pushing its 12-month gain to around 75%, placing it near the top of the S&P Kensho New Economies leaderboard.

This YTD gain has been broad-based, with roughly three-quarters of index constituents (18) contributing positively to performance. By GICS industry, the largest contributions came from Aerospace & Defense, Electronic Components & Equipment and Energy Equipment & Services. The presence of Energy Equipment & Services firms highlights the growing role of industrial drone applications.

Three Energy companies, Oceaneering International, Forum Energy Technologies and TechnipFMC, accounted for three of the five largest contributors to the index’s YTD performance. These three companies operate subsea robotic systems used for pipeline inspection, subsea maintenance and deepwater oil & gas operations. Their strong contributions highlight how drone and robotic technologies are increasingly embedded in traditional industrial sectors such as Energy.

Notably, the broader Oil & Gas Equipment & Services industry has recently broken out of its three-year trading range. This industry’s momentum has supported the performance of Energy-focused companies within the S&P Kensho Drones Index.

The benefits of the index’s diversification across the drone value chain become even clearer when looking at earlier periods of performance. During the period from April 2025 to October 2025, when the index gained roughly 80%, performance was driven primarily by defense companies benefiting from geopolitical tensions and multi-year government defense spending commitments. While the underlying drivers may vary over time, they remain linked by a common thread (i.e., the expanding role of drones and autonomous systems across defense, industrial and commercial markets).

Several structural forces have recently strengthened the growth of the drone industry.

  • Policy Support and Regulatory Expansion: Governments are increasingly prioritizing domestically produced and trusted drone technologies.2 In the U.S., legislation such as the FY2026 NDAA3 requires key components to be sourced from the U.S. or allied countries, while expanding Beyond Visual Line of Sight (BVLOS)4 rules are enabling drones to operate over longer distances and unlocking new infrastructure and industrial use cases.
  • Hardware Innovation: Advances in chips, batteries and sensors are expanding drone capabilities. Edge-computing chips enable real-time onboard processing5 improved batteries extend flight times and new sensing technologies support more advanced inspection and monitoring tasks.
  • AI as the Intelligence Multiplier: AI is turning drones into autonomous systems capable of navigation, analysis and decision-making in real time. AI also enables drones to operate as part of connected networks6 with satellites, ground robots and other autonomous platforms.

As drones become embedded across defense and industrial systems, the S&P Kensho Drones Index seeks to track this evolving ecosystem across aerial and marine drone technologies and their enabling components.

1 Please see the S&P Kensho Indices Methodology for more information.

2 European Union, “Action Plan on Drone and Counter Drone Security,” Feb. 11, 2026.

3 House Armed Services Committee, “The FY26 NDAA.”

4 Federal Aviation Administration, “BVLOS Fact Sheet.”

5 Micron, “Edge AI in the sky,” September 2025.

6 McKinsey, “Future defense tech: Multidomain stacks to build affordable mass,” Feb. 12, 2026.

The posts on this blog are opinions, not advice. Please read our Disclaimers.

The Dow Jones Dividend 100 Indices Shine in a Strong Start to the Year

Contributor Image
Wenli Bill Hao

Director, Factors and Dividends Indices, Product Management and Development

S&P Dow Jones Indices

As market volatility continues in the U.S., the Dow Jones U.S. Dividend 100 Index and Dow Jones International Dividend 100 Index have emerged as standout performers. Year-to-date (YTD) as of Feb. 28, 2026, both indices have posted double-digit gains (see Exhibit 1).

Notably, the Dow Jones U.S. Dividend 100 Index has outperformed its benchmark universe by 14.81% YTD. This outperformance has largely been driven by its overweights in the Energy and Consumer Staples sectors, as well as its underweight in Information Technology. The index’s top four holdings—Lockheed Martin, ConocoPhillips, Verizon and Chevron—have each posted returns exceeding 20% in 2025, helping drive index-level performance.

In this blog, we will examine their index methodology, historical performance and key characteristics.

Methodology Overview

What differentiates the Dow Jones Dividend 100 Indices—and has contributed to their long-term outperformance—is their emphasis on dividend consistency combined with a multi-factor selection process that blends two dividend metrics with two quality measures. The methodology begins by excluding companies that have not paid dividends for at least 10 consecutive years. Next, eligible stocks are ranked by their indicated annualized dividend (IAD) yield, with those falling below the median IAD yield removed (see Exhibit 2).

From the remaining pool, the top 100 companies are selected based on a composite score that combines the following four factors: free cash flow to total debt, return on equity, IAD yield and five-year dividend growth rate. For the Dow Jones International Dividend 100 Index, an additional screen is applied, removing the bottom half of stocks with the highest three-year price volatility before final selection.2

The selected constituents are weighted by capped float-adjusted market capitalization, with stock and sector caps in place that aim to reduce concentration risk and enhance diversification.

Performance History

Over the long term, including back-tested results, the Dow Jones Dividend 100 Indices have outperformed their benchmark universes, both in absolute total return and risk-adjusted terms. The Dow Jones International Dividend 100 Index has outperformed over short-, medium- and long-term horizons. Similarly, the Dow Jones U.S. Dividend 100 Index has outperformed across both short- and long-term periods.

In addition to outperformance, both indices have exhibited lower risk and reduced drawdowns compared to their benchmark universes (see Exhibit 3).

Enhanced Dividend Yield and Dividend Growth

The Dow Jones Dividend 100 Indices have consistently posted higher dividend yields compared to their respective benchmarks (see Exhibit 4). Over the period from Dec. 31, 2006, to Dec. 31, 2025, the Dow Jones U.S. Dividend 100 Index averaged a yield of 3.82%, significantly higher than the 1.75% yield of the Dow Jones U.S. Broad Stock Market Index. Similarly, the Dow Jones International Dividend 100 Index posted an average yield of 4.42%, outperforming the Dow Jones Global ex-U.S. Index, which averaged 2.99%.

By prioritizing dividend growth, strong fundamentals and high yield as primary selection criteria, the indices also posted significantly higher dividend growth rates than their respective benchmark universes over the 10-year period from Dec. 31, 2015, to Dec. 31, 2025. Importantly, these elevated dividend growth rates have historically outpaced long-term inflation rates in their respective markets, providing a potential hedge against inflation and helping to preserve purchasing power over time.

Quality and Value Tilts

The Dow Jones Dividend 100 Indices have tended to exhibit favorable value and quality characteristics relative to their respective benchmarks (see Exhibit 6). In valuation terms, as of Feb. 28, 2026, both dividend indices are trading at a discount relative to their respective benchmarks, while exhibiting comparable or higher profitability.

Conclusion

The Dow Jones U.S. Dividend 100 Index and Dow Jones International Dividend 100 Index have shown sustained dividend payment and dividend growth historically. From March 31, 2005, to Feb. 28, 2026, including back-tested analysis, they have outperformed their respective benchmarks in both absolute and risk-adjusted terms, while exhibiting lower risk and drawdowns. Furthermore, their distinct quality and value characteristics—such as higher profitability and discounted valuations—may help market participants navigate changing market conditions with greater confidence.

1 For the Dow Jones International Dividend 100 Index, we note we use the Dow Jones Global ex-U.S. Index as its benchmark comparison, as it also includes small-cap constituents, while its universe indices are the Dow Jones Global ex-U.S. Large-Cap and Dow Jones Global ex-U.S. Mid-Cap.

2 Please refer to the methodology of the Dow Jones Dividend 100 Indices for more details.

The posts on this blog are opinions, not advice. Please read our Disclaimers.

Why Do U.S. Equities and the S&P 500 Matter in South Korea?

S&P DJI’s Sue Lee examines the importance of the S&P 500 in the global equity opportunity set, key diversification and sector composition differences between notable U.S. equity and Korean benchmarks and the challenges faced by active managers in the U.S. and South Korea to outperform this iconic index. 

The posts on this blog are opinions, not advice. Please read our Disclaimers.

Unveiling the Dow Jones Japan Select Dividend Index

Contributor Image
Kevin Multhaup

Senior Analyst, Factors and Dividends Indices

S&P Dow Jones Indices

Japanese dividend payouts are meaningfully higher in cash terms than they were a decade ago, bringing Japan more in line with other developed markets. Importantly, dividend growth is now increasingly anchored in formal dividend policy. This shift matters for market participants seeking both yield and exposure to Japanese equity markets by setting expectations around dividend sustainability.

Much of this evolution has been due to improved corporate governance and stewardship standards in the 2010s as well as the normalization of payout ratios, and capital efficiency reforms introduced by the Tokyo Stock Exchange in 2023.1 These reforms have sharpened management’s focus on the cost of capital and share price performance. As a result, dividend increases, progressive dividend policies and share buybacks have become more common. Many companies now explicitly commit to maintaining or increasing dividends, contributing to greater stability in Japan’s dividend market.

On Dec. 15, 2025, the Dow Jones Japan Select Dividend Index was launched to track companies with higher dividend yields and more sustainable dividend profiles in Japan.

Index Construction and Methodology

The Dow Jones Japan Select Dividend Index methodology (see Exhibit 1) follows the established approach of the Dow Jones Select Dividend Index Series. The starting universe is the S&P Japan LargeMidCap, excluding REITs. From this broad universe, a series of eligibility screens is applied to identify consistent dividend payments, adequate dividend coverage and higher yields.

Stocks passing these screens are then ranked by indicated annual dividend yield (IADY) with the top 75 selected subject to a buffer to reduce turnover. Constituents are weighted using the square root of free-float market capitalization (FMC) multiplied by IADY.

Dividend Yield Characteristics

As shown in Exhibit 2, the long-term average dividend yield of the index since 2015 is 3.53%, approximately 130 bps higher than the benchmark universe.

As of year-end 2025, the index had a dividend yield of 3.30%, around 120 b above the benchmark, although slightly below its long-term average differential.

A Decade of Dividend Growth in Japan

The Japanese market has witnessed significant dividend growth over the past decade. As illustrated in Exhibit 3, dividends gained prominence following the reforms of the 2010s, leading to larger and more consistent dividend payments, resulting in a widening between the total return (incorporating dividends) and price return versions of the benchmark, based on back-tested analysis.

Exhibit 4 reveals that the Dow Jones Japan Select Dividend Index had an average annual dividend growth rate of 12.62% during this period, surpassing the benchmark universe by approximately 260 bps and significantly outpacing Japanese inflation. Irrespective of this growth continuing into the future, it underscores Japan’s market dynamics aligning more closely with developed market standards.

Long-Term Outperformance

Back-tested results show that the Dow Jones Japan Select Dividend Index has outperformed its benchmark universe on both long- and short-term horizons, while also delivering higher risk-adjusted performance. The index has provided a degree of defensiveness, with a downside capture ratio of 92%, while participating in rising markets as reflected by its upside capture ratio.

Sector Weights

Over the long term, the index’s GICS sector weights have been concentrated in Financials, Industrials and Consumer Discretionary. Financials represent the largest active overweight, at 14.01%. Industrials and Consumer Discretionary also carry meaningful weights in the Japanese benchmark, resulting in relatively low active positions.

The largest active underweights are in Information Technology and Health Care, reflecting the index’s focus on income-oriented sectors rather than growth-oriented industries.

Conclusion

By systematically targeting high-yielding companies with demonstrated dividend stability, the Dow Jones Japan Select Dividend Index reflects Japan’s evolving income landscape. Based on back-tested data, its combination of high dividend yields, strong dividend growth and long-term risk-adjusted performance highlights the growing relevance of dividend strategies within Japanese equities.

1 Japan Exchange Group – Follow-up of Market Restructuring

2 Dow Jones Dividend Indices Methodology

The posts on this blog are opinions, not advice. Please read our Disclaimers.