


Look inside the S&P 500 FC 7% Index, an innovative index that seeks to provide optimized exposure to the S&P 500 via BofA’s Fast Convergence technology by using intraday volatility signals to adjust component allocations to systematically increase stability and limit exposure to large drawdowns.
The posts on this blog are opinions, not advice. Please read our Disclaimers.S&P 500 FC 7% Index: The Gold Standard of Indices Meets Today’s Technology
Tech Tantrums
The Dow Hits 50,000!
S&P Global Dividend 100 Index: Where High Yield Meets Quality
How AI Is Transforming Index Construction: Introducing the S&P 3AI Indices
S&P 500 FC 7% Index: The Gold Standard of Indices Meets Today’s Technology
Tech Tantrums

The past week has been turbulent for Big Tech, with disappointing reactions to earnings from Microsoft, Amazon and Alphabet, while Apple and Meta emerged relatively unscathed after announcing their results. Concerns about growing capital expenditures on AI1 among these giants have led to renewed bubble fears among market participants.
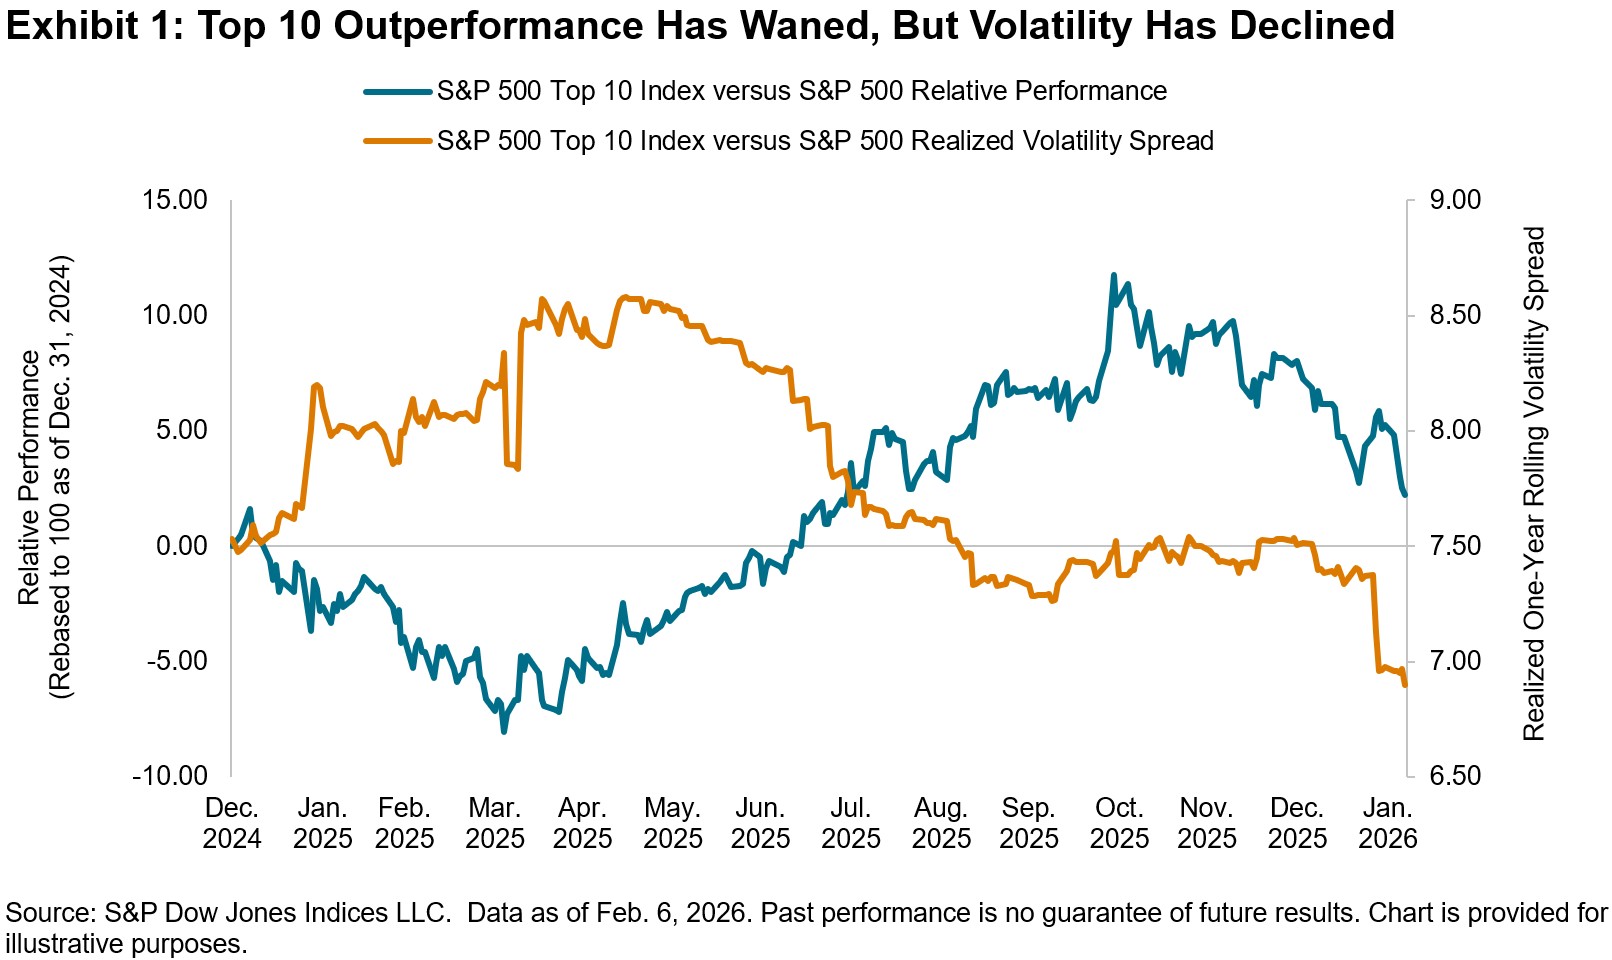
In an environment characterized by such jitters, we would expect performance among mega caps to suffer, and it indeed has, with the S&P 500® Top 10 Index down 5% relative to the S&P 500 YTD as of Feb. 6, 2026. What is more surprising though is that the realized volatility of the top 10 index, while still higher than The 500®, has declined in relative terms.
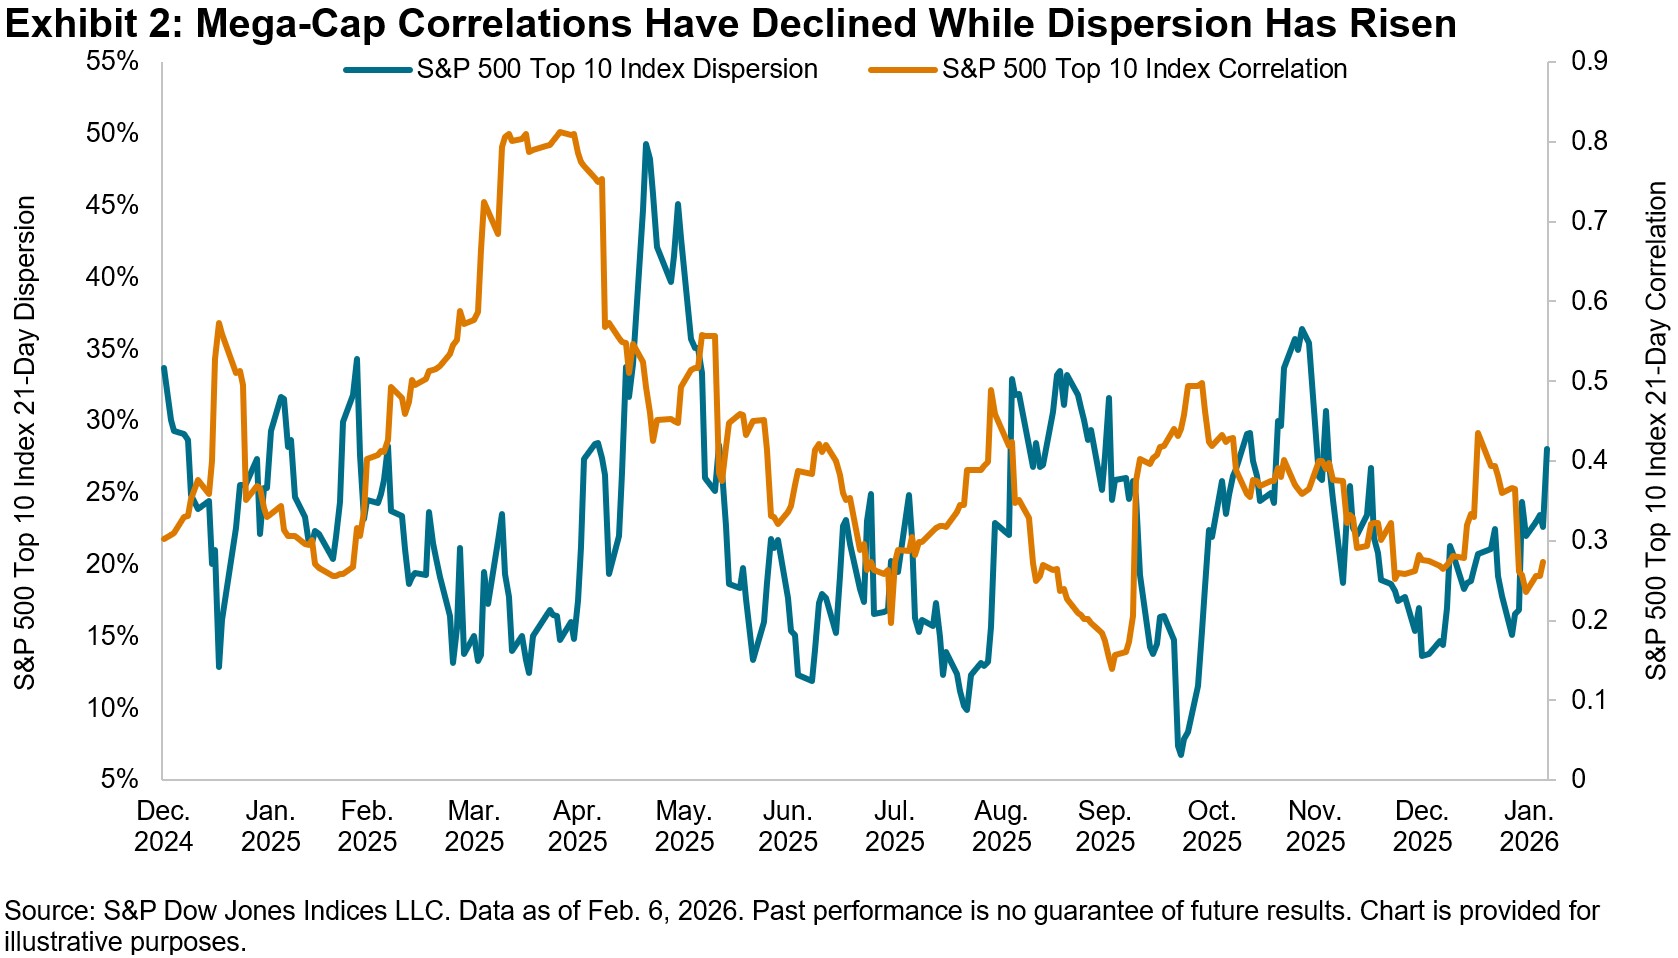
Volatility manifests itself in both dispersion and correlation, each of which we explore in Exhibit 2 for the S&P 500 Top 10 Index to offer some perspective. Although the dispersion of the top 10 index has risen so far this year, correlations have declined steadily, which has helped dampen the realized index volatility of the mega caps. This is in contrast to early April 2025, when correlations spiked to 0.8, while dispersion remained relatively low, as Tech titans were buffeted across the board by trade-related tensions.
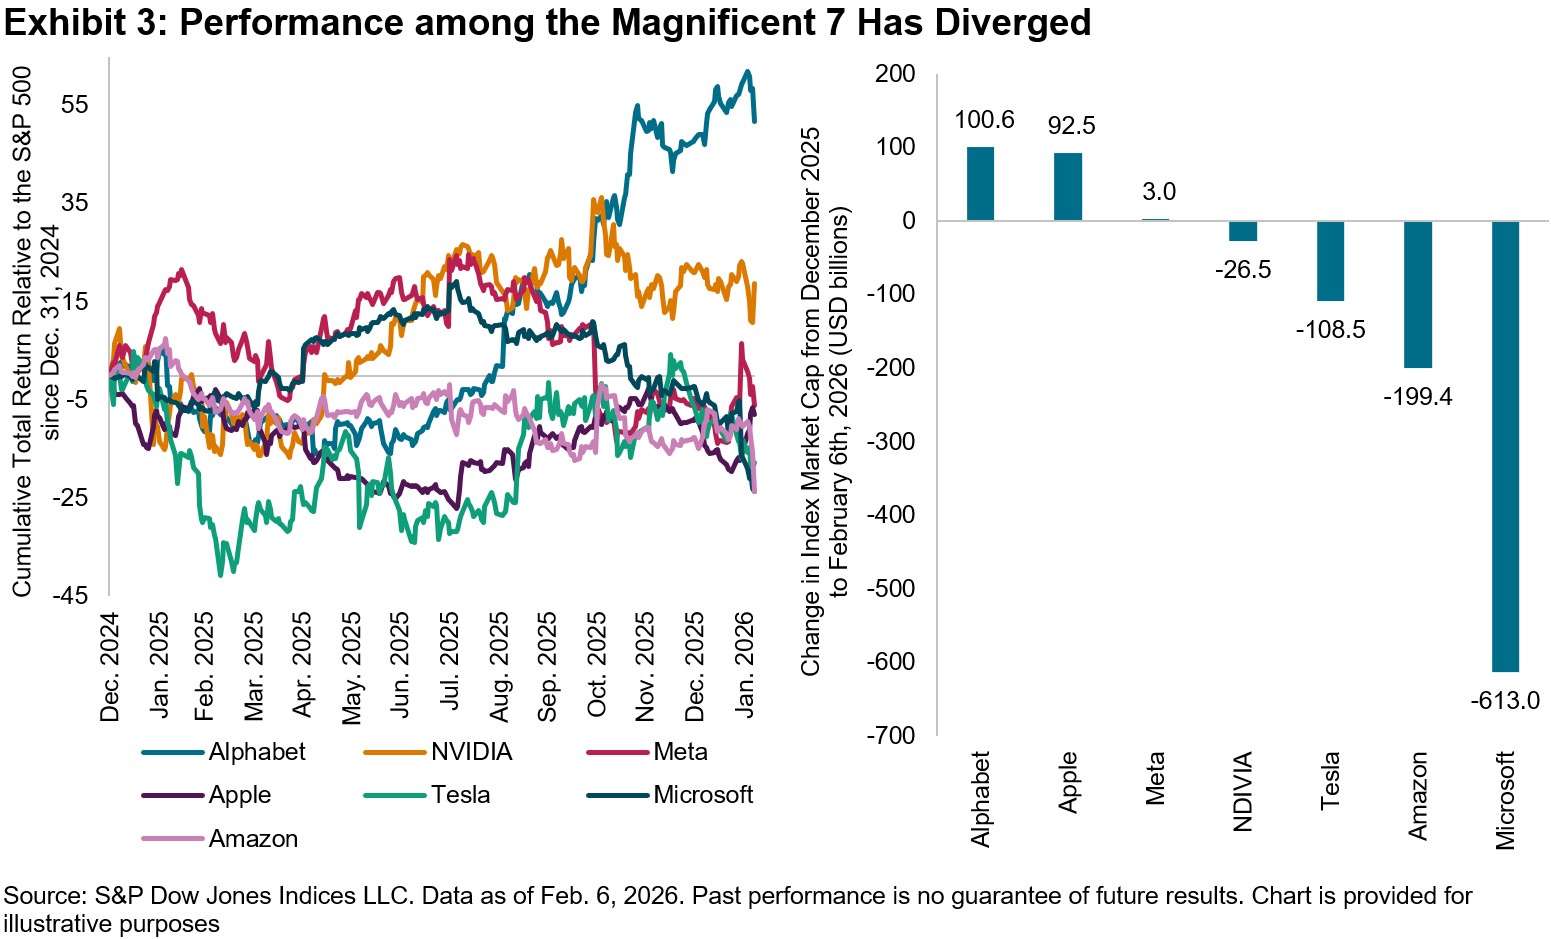
Looking under the hood specifically at those mega-cap companies belonging to the famous Magnificent 7 moniker, which span across the Information Technology, Communication Services and Consumer Discretionary sectors, can help further disentangle these volatility dynamics. Exhibit 3 illustrates that performance among the group has diverged over the last year, leading to a 75% cumulative performance differential between outperforming Alphabet and underperforming Amazon since Dec. 31, 2024. Only Alphabet and NVIDIA managed to outperform The 500 during this time period.
Only two companies continued to beat the benchmark in January, but the composition of outperformers has shifted to include Alphabet and now Apple, while Amazon and especially Microsoft have been punished, with more than USD 800 billion in market cap erased in the past month from these two companies. These trends are consistent with the rise in dispersion and decline in correlations witnessed in Exhibit 2.
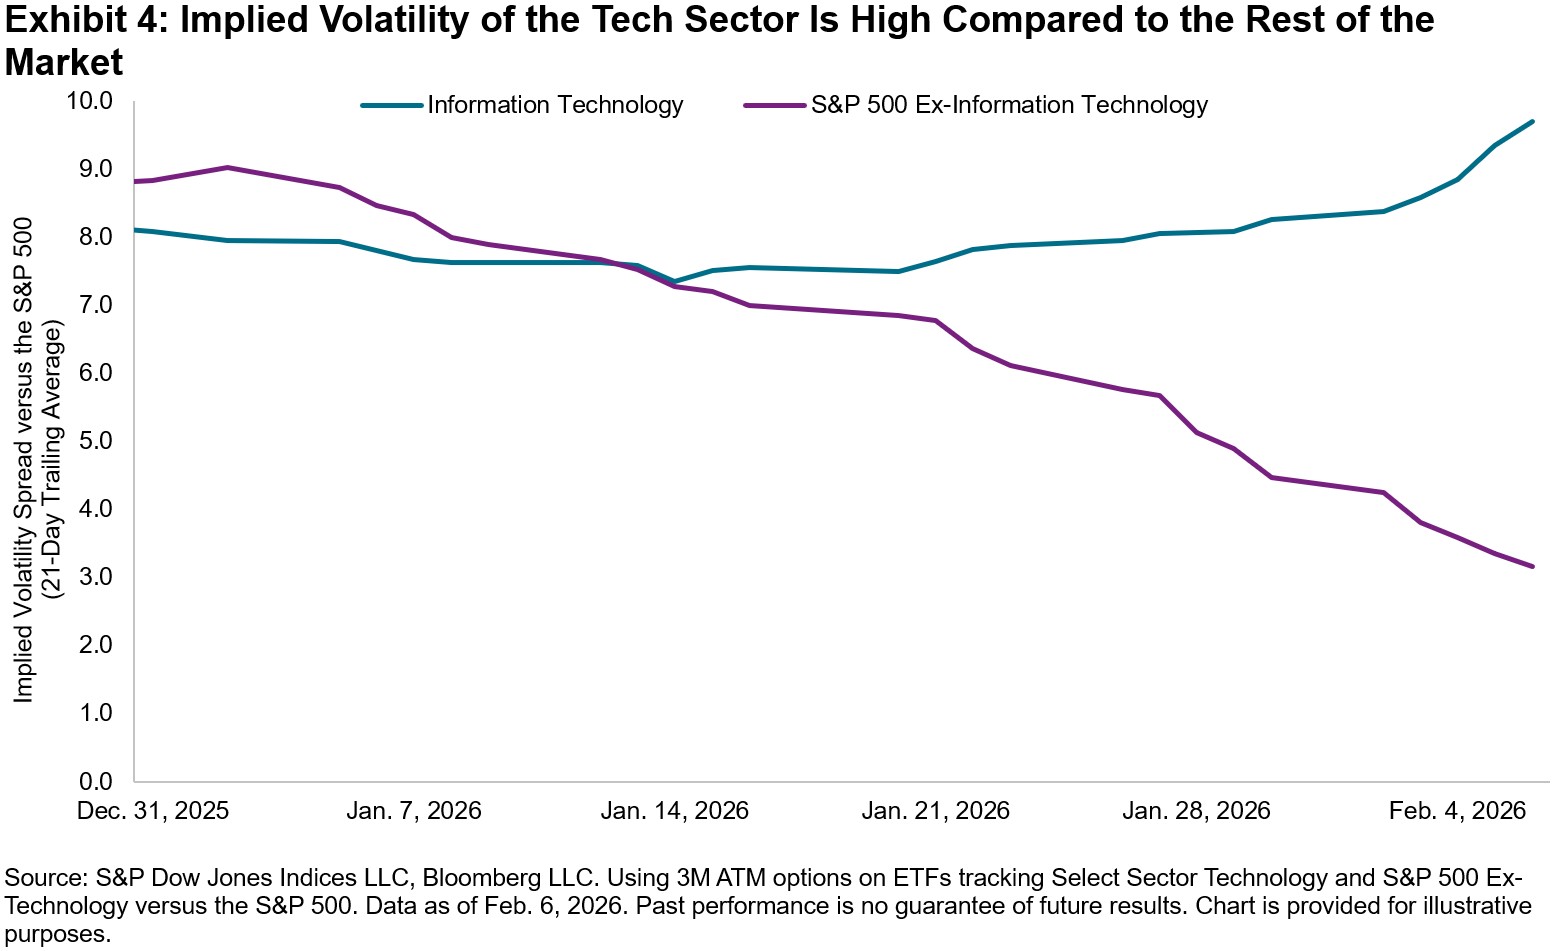
As the market looks ahead to NVIDIA earnings later this month, concerns over Big Tech spending do not appear to be abating. We observe in Exhibit 4 that the implied volatility of the Tech sector is higher relative to The 500 and has been rising. Meanwhile, the implied volatility of The 500 excluding Technology relative to the benchmark has declined sharply. Understanding Tech’s recent tantrums from a volatility lens might help investors navigate these uncertain times.
1 Big Tech’s ‘breathtaking’ $660bn spending spree reignites AI bubble fears – Financial Times
The posts on this blog are opinions, not advice. Please read our Disclaimers.The Dow Hits 50,000!

The Dow Jones Industrial Average® (DJIA) just closed above 50,000 for the first time in its near 130-year history. The Dow®’s latest milestone marks the third time this decade that the U.S. equity barometer first surpassed a 10,000 increment and—unsurprisingly, perhaps, given successive milestones require smaller gains to be achieved—the latest milestone came in record time, less than two years after it first closed above 40,000 (see Exhibit 1).
Although skeptics may question the significance, psychological or otherwise, of market barometers hitting arbitrary thresholds, The Dow’s latest milestone provides an opportunity to reflect on the index’s storied history.

Born out of Charles Dow’s hunch at the end of the 19th century that industrial companies would be crucial contributors to U.S. economic growth, the DJIA has provided market participants with a way to measure the U.S. equity market for close to 130 years. The length of live index history is extremely valuable: one does not need to wonder how the U.S. equity market might have performed under simplifying assumptions typically associated with index back-tests. Nor does one have to consider the validity of those assumptions, the motives behind the choices, and their impact on hypothetical historical index performance. Instead, The Dow shows how the market did react to different environments, thereby helping market participants to contextualize U.S. equity market movements (see Exhibit 2).
In recent decades, the index has come to serve as the underlying for various index-linked products around the world, with an estimated USD 115 billion indexed or benchmarked to The Dow at the end of 2024. The Dow also has a robust trading ecosystem, promoting price transparency and market efficiency, with more than USD 8 trillion in index equivalent trading volume (IET) in products linked to the index in 2024.

A key reason that The Dow has continued to resonate around the world is that the index has evolved to reflect key trends in the U.S. equity market. For example, various manufacturers were added in the 20th century to reflect the prominence of these companies in the U.S. equity market at the time, while more recent constituent changes—including the latest updates—ensured the DJIA reflected the growing importance of other segments. Overall, the DJIA has seen 136 constituent changes since May 1896.
Exhibit 3 shows the impact of these changes on the average tenure of The Dow’s constituents. The Dow’s expansion from 12 stocks to 20 stocks in 1916, and its further expansion to the now familiar 30-stock count in 1928, contributed to notable declines in the average tenure in the first few decades. A prolonged period of relatively few constituent changes then saw the average tenure reach 48 years in the mid-1980s, before declining in recent decades; the average tenure was around 25 years at the end of January 2026.

Exhibit 4 illustrates the fact that The Dow’s constituent changes helped it to reflect recent U.S. equity market dynamics. In particular, Exhibit 4 shows the contribution of existing index constituents to The Dow between May 17, 2024, when the index first closed above 40,000, and yesterday’s close. Companies added in the past 30 years contributed around half of the gains from existing constituents.

As a result, the Dow Jones Industrial Average is one of the preeminent U.S. equity barometers, with close to 130 years of live history. However, the index is not your great-great-great grandparents’ Dow: the index has evolved and the latest milestone shows that it continues to reflect trends in the U.S. equity markets.
The posts on this blog are opinions, not advice. Please read our Disclaimers.S&P Global Dividend 100 Index: Where High Yield Meets Quality

When selecting a high yield dividend strategy, headline yield matters—but so does the strength of the companies delivering it. The ability to sustain and grow dividends over time often depends on underlying business quality. Companies with strong profitability and resilient cash flows are typically better positioned to increase payouts and support long-term price performance.
To focus on this balance, the S&P Global Dividend 100 Index selects companies using a composite score that blends two dividend metrics with two measures of quality.
Methodology Overview
The methodology begins with the S&P Global LargeMidCap as the index universe, first screening to retain companies that have paid dividends for at least 10 consecutive years, then removing those with a below-median dividend yield. From the remaining subset, the top 100 companies are selected based on a composite score combining dividend yield, dividend growth, return on equity (ROE) and the ratio of free cash flow (FCF) to total debt.
Selected constituents are weighted by float market cap (FMC) times dividend yield, helping balance liquidity with enhanced income. To help reduce concentration risk and support diversification, individual stocks are capped at 4% and sector weights are limited to 25%.

Back-Tested Performance Overview
The S&P Global Dividend 100 Index has outperformed the benchmark over the long- and short-term back-tested period, with higher risk-adjusted returns and significantly higher long-term dividend yields. The defensiveness of the dividend index can be seen in the lower drawdown and downside capture, while still participating strongly in rising markets.

Dividend Yield
As of Dec. 31, 2025, the historical average long-term dividend yield for the S&P Global Dividend 100 Index was 4.27% versus 2.37% for the benchmark, a difference of 190 bps. Interestingly, the differential between the two current dividend yields was 250 bps as of Dec. 31, 2025, with the S&P Global Dividend 100 Index anticipating a dividend yield of 4.16%.

Dividend Growth
Growing dividends can help preserve purchasing power during periods of elevated inflation. During the back-tested period, the S&P Global Dividend 100 Index showed dividend growth of over 7% across both the 5- and 10-year periods (see Exhibit 5), compared with approximately 4% for the broader benchmark. This stronger growth profile suggests that income levels may have been more resilient during the higher inflation experienced in 2022 and 2023. These outcomes reflect the index’s methodology, which incorporates both dividend growth and quality fundamentals within the composite scoring framework.

Country/Region Breakdown Insights
As of Dec. 31, 2025, the S&P Global Dividend 100 Index displayed a more balanced regional mix relative to the benchmark. Europe and the Asia‑Pacific region each accounted for roughly 27 % of the index, while the U.S. and North America represented about 41.8 %—approximately a 20 % underweight versus the benchmark.

Sector Breakdown Insights
Exhibit 7 illustrates that the S&P Global Dividend 100 Index had the largest sector overweights in Energy and Financials as of Dec. 31, 2025. While still underweight in the Information Technology sector overall, the S&P Global Dividend 100 Index had a much higher weight in this sector than its global dividend index peers. This is due to the quality metric within the selection scoring, which screens for higher quality companies with dividend prospects within the sector.

Conclusion
The long-term back-tested performance of the S&P Global Dividend 100 Index highlights that the rules-based methodology prioritizes high dividend yield, consistent dividend growth and strong fundamentals. The index has historically shown relatively high risk-adjusted returns versus the benchmark, robust dividends and defensive qualities. By anchoring the selection of high yield stocks in the fundamental strength of companies, the index has also demonstrated robust dividend growth, which could help to preserve purchasing power.
1 For the full methodology, please refer to the Dow Jones Dividend Indices Methodology.
The posts on this blog are opinions, not advice. Please read our Disclaimers.How AI Is Transforming Index Construction: Introducing the S&P 3AI Indices

The recent advent of artificial intelligence (AI) is transforming daily life from streamlining routine tasks to augmenting productivity and facilitating data-driven decisions. Within indexing, it is a natural progression to explore how these technologies can enhance index construction within a human-validated and governed framework. Integrating machine learning, a subset of AI, systematically enables the analysis of vast datasets, the identification of complex relationships and the generation of forward-looking insights. Applied in this way, AI offers an adaptive evolution of traditional factor investing, further reshaping the alpha-beta continuum.
In this blog, we will introduce the S&P 3AI Indices by reviewing the methodology, performance and positioning of this new index series.
3AI and the 3AI Alpha Scores
3AI is a London-based quantitative research technology firm specializing in machine learning and stock alpha forecasting. Founded in 2018, 3AI develops machine-learning-driven forecasting systems deployed in live investment and research environments.
Alpha forecasts are produced through a fully systematic process governed by strict temporal and methodological constraints, with human oversight focused on model validation, risk controls and research governance. The output of this process is the 3AI Alpha Score, representing a 12-month expected excess return forecast.
These 3AI Alpha Scores are produced through a network of interconnected AI systems operating across bottom-up and top-down dimensions, drawing on more than 300 structured data inputs. Bottom-up models analyze company-level fundamentals, factors, analyst expectations, market behavior and technical indicators, while top-down models reflect sectoral and business-cycle effects. S&P Dow Jones Indices has collaborated with 3AI to incorporate these 3AI Alpha Scores into its indices.
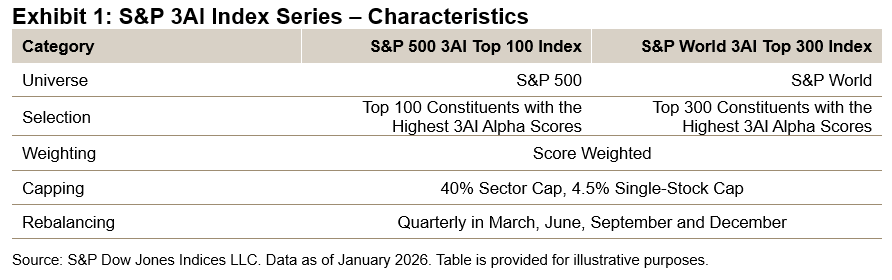
Methodology
Two of the first indices launched using these scores are the S&P 500® 3AI Top 100 Index and S&P World 3AI Top 300 Index. Each index selects the highest-scoring companies in its universe, hence tracking those with the strongest 12-month alpha forecasts. Constituents are weighted proportionally to their 3AI Alpha Scores, and the indices are rebalanced quarterly. See the index methodology for more details.
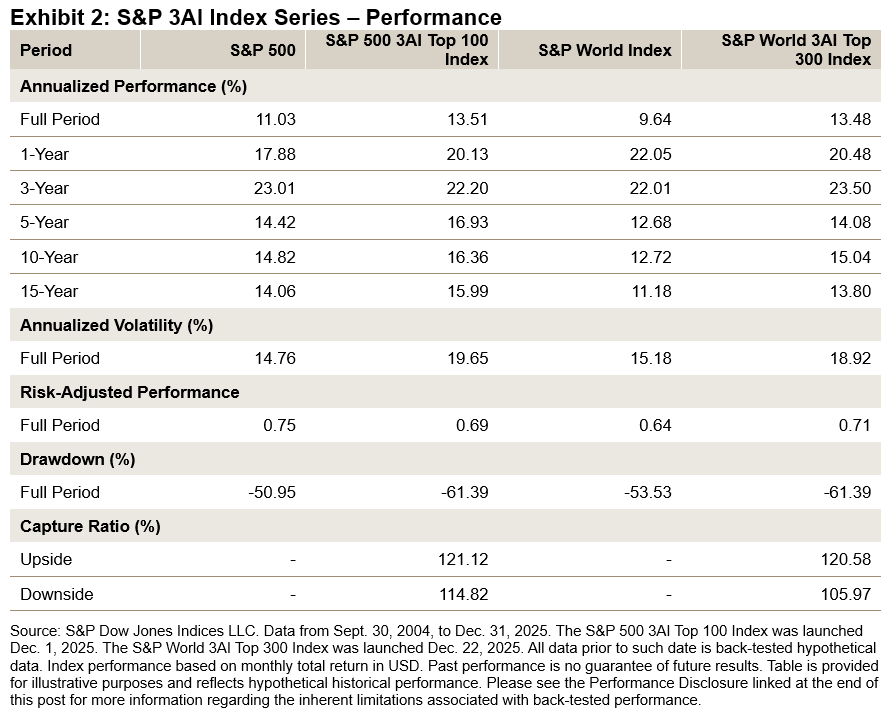
Performance Characteristics
Since the index was launched in late 2025, any performance data prior to that date is considered back-tested. It is important to note that the development of a machine-learning forecasting process involves three distinct phases: model training, out-of-sample testing and, lastly, live implementation. During model training, only point-in-time data is utilized, ensuring that observed alpha is genuinely out-of-sample or live and is not influenced by the realized performance of the index or any related strategy. Once live, the model benefits from an expanding data and learning window.
Over the back-tested period studied from Sept. 30, 2004, to Dec. 31, 2025, the S&P 500 3AI Top 100 Index achieved approximately 2.5% annualized outperformance versus the S&P 500, while the S&P World 3AI Top 300 Index outperformed the S&P World Index by about 3.8% annualized.
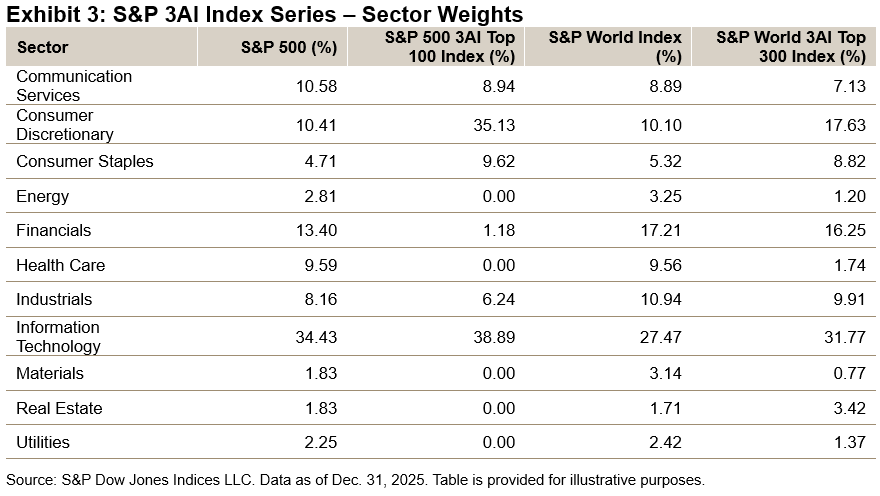
Sector Weights
As of Dec. 31, 2025, both indices exhibited notable overweights in Consumer Discretionary—approximately 25% above the benchmark for the S&P 500 3AI Top 100 Index—and in Consumer Staples, which was nearly double its benchmark weight. For both indices, Information Technology also showed an overweight relative to their benchmarks. In Financials, the S&P 500 3AI Top 100 Index was materially underweight, but the S&P World 3AI Top 300 Index was broadly in-line with its benchmark. This highlights a two-sided dynamic within the sector: U.S. Financials were de-emphasized, while Financials companies from other developed markets were overweighted. Health Care had a significant underweight in both indices, having been largely excluded.
Conclusion
The S&P 3AI Indices represent our first AI-enhanced indices that use predictive modeling to drive stock selection. While the underlying scores are derived from machine-learning models, the indices bring the benefits of transparency and robust human-led governance. We are excited to introduce these innovative benchmarks and are exploring the expansion of this series of indices. Stay tuned for further analysis and publications that will provide additional information on the machine-learning processes and offer detailed attribution of historical index performance.
The use of “3AI” in the name of the S&P 3AI indices is a reference to the machine learning technology firm, 3AI, which provides the 3AI Alpha Intelligence scores that are used by S&P Dow Jones Indices in the construction of these indices. These scores represent 12-month excess return forecasts, generated through the application of machine learning techniques across global equities, by analyzing company data and business-cycle sensitivities.
The Content may have been created with the assistance of an artificial intelligence (AI) tool. While the AI tool may provide suggestions and insights, the final Content was composed, reviewed, edited, and approved by a human(s) at S&P Dow Jones Indices. As such, S&P DJI claims full copyright ownership of this AI-assisted Content, in accordance with applicable laws and regulations.
The posts on this blog are opinions, not advice. Please read our Disclaimers.