Get Indexology® Blog updates via email.

In This List

Exploring the Depth of Mega Caps: A Look at the S&P 100 Ex-Top 20 Select Index

Above Mexico’s Stock Arena: The Finale

Advisor Profile: Getting the Most out of Index Provider Content

S&P 500 Quality FCF R&D Leaders Index: Highlighting Innovation, Growth and Fundamental Strength

SPIVA South Africa: Key Insights and Trends

Exploring the Depth of Mega Caps: A Look at the S&P 100 Ex-Top 20 Select Index

Contributor Image
Algreen Bakasa

Director, U.S. Equity Indices

S&P Dow Jones Indices

What Lies Beneath the Headline Names in the S&P 100?

Introducing the S&P 100 Ex-Top 20 Select Index, which measures the performance of companies within the S&P 100, excluding the largest 20 constituents ranked by float-adjusted market capitalization. This blog examines the depth, diversification and shifting leadership that can be obscured by the dominance of the very largest names.

The “Next 80” Make Up a USD 13.4 Trillion Segment

As shown in Exhibit 1, the companies outside the largest 20 make up a USD 13.4 trillion segment, over twice the size of Japan’s equity market and nearly four times larger than the U.K. market and the U.S. mid-cap segment (as measured by the S&P MidCap 400®). Far from a niche slice of the U.S. equity landscape, the “next 80” represent a major portion of the global equity opportunity set.

Beyond its global scale, comparing this segment with the S&P 100 offers additional insight. While the top 20 names often dominate market headlines, the remaining 80 companies represent a meaningful share of the mega-cap U.S. equity segment. Since 2001, these companies have accounted for approximately 45% of the S&P 100’s total weight on average, ranging from 32% to 56% (see Exhibit 2). This variability reflects shifts in mega-cap leadership and reinforces the concept of examining the “next 80” as a distinct lens.

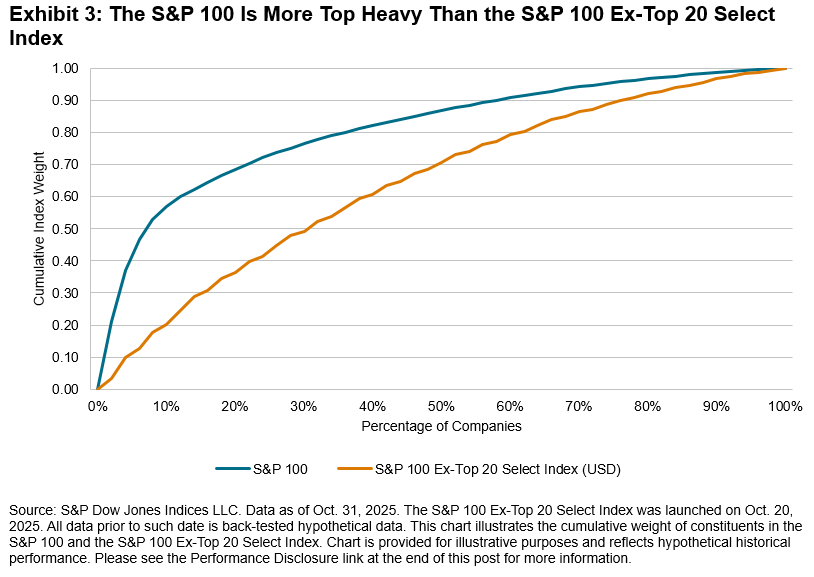
The S&P 100 Ex-Top 20 Select Index offers a more evenly distributed profile compared with the S&P 100, which is heavily concentrated in its largest names. Exhibit 3 shows that the top decile of constituents accounted for 55% of the S&P 100’s weight, versus about 22% in the S&P 100 Ex-Top 20 Select Index. This shows how steeply weight accumulates at the top of the S&P 100, highlighting the extent to which its performance can be driven by a relatively small set of names.

Broadening the Sector Profile

Differences in index size and constituent concentration are also reflected in sector weights. As shown in Exhibit 4, Information Technology represents nearly 25% of the S&P 100 Ex-Top 20 Select Index, well below the 42% weight in the S&P 100. This lower weight in Tech is paired with greater representation across other sectors, most notably Health Care (18%), Financials (17%) and Industrials (14%). Removing the largest 20 names resulted in a more balanced sector profile, reducing concentration in a few dominant sectors and broadening representation across the drivers of mega-cap U.S. equity performance. While the S&P 100’s Tech weight rose from about 20% in 2010 to over 40% in 2025, the S&P 100 Ex-Top 20 Select Index increased moderately from roughly 9% to about 20%. Meanwhile, sectors such as Health Care, Financials, Industrials and Materials had higher weights in the S&P 100 Ex-Top 20 Select Index.

Performance trends aligned with each index’s sector composition. The S&P 100 outperformed in recent years as concentrated mega-cap Tech leadership led performance, while the S&P 100 Ex-Top 20 Select Index tended to hold up better during periods when market leadership broadened.

Conclusion

The S&P 100 Ex-Top 20 Select Index offers a complementary lens on the S&P 100 by highlighting a large, diversified segment beyond the top 20 names. Its meaningful scale and broader sector mix provide additional perspective on the composition, concentration dynamics and long-term characteristics of the mega-cap U.S. equity landscape.

The posts on this blog are opinions, not advice. Please read our Disclaimers.

Above Mexico’s Stock Arena: The Finale

Contributor Image
Maya Beyhan

Global Head of Sustainability, Index Investment Strategy

S&P Dow Jones Indices

As we wrap up our discussion on the S&P/BMV IPC CompMx Trailing Income Equities ESG Tilted Index, it is important to explore the context surrounding its recent performance and emphasize the cyclical dynamics of sector movements.

In our previous blog, we examined how the index had underperformed relative to the broader S&P/BMV IPC as of Aug. 29, 2025, primarily due to underweighting the strong-performing Materials sector, which tends to include more companies with relatively lower dividend payouts. As of Oct. 31, 2025, the S&P/BMV IPC CompMx Trailing Income Equities ESG Tilted Index underperformed the S&P/BMV IPC by 7.75% year-to-date.

However, this underperformance should be analyzed in a broader context. A look at historical trends offers greater insight. Exhibit 1 summarizes the annual performance of the S&P/BMV IPC CompMx Trailing Income Equities ESG Tilted Index and the excess performance compared to the S&P/BMV IPC. Since its launch on Aug. 2, 2021, the index managed to outperform the S&P/BMV IPC in three out of five calendar years, exceeding the broader market by 0.86%, 0.46% and 4.76% in 2021 (since launch), 2022 and 2024, respectively.

Exhibit 2 illustrates the calendar year performance of Materials, Industrials and the S&P/BMV IPC, as well as the excess performance of the S&P/BMV IPC CompMx Trailing Income Equities ESG Tilted Index versus the S&P/BMV IPC. We can see that historically, during periods when the Materials sector underperformed the S&P/BMV IPC, the S&P/BMV IPC CompMx Trailing Income Equities ESG Tilted Index outperformed the broader market.

The sole exception was in 2024, when the Materials sector outperformed the S&P/BMV IPC by 7.09%, yet the S&P/BMV IPC CompMx Trailing Income Equities ESG Tilted Index still surpassed the broader benchmark by 4.76%, marking the highest performance since its launch.

This finding can be attributed to the interactions between sectors. Exhibit 2 also highlights the performance of the Industrials sector, which is characterized by higher dividend-paying companies and thus is overweight in the index. Historically, when this sector outperformed the S&P/BMV IPC, the S&P/BMV IPC CompMx Trailing Income Equities ESG Tilted Index benefited similarly, leading to stronger performance compared to the broader market. For instance, in 2024, the Industrials sector outperformed the S&P/BMV IPC by 14.68%, which helped mitigate the negative impact of the Materials sector’s strong rise and contributed to an excess performance of 4.76% for the S&P/BMV IPC CompMx Trailing Income Equities ESG Tilted Index.

Looking ahead, it is vital to acknowledge the inherent cyclical nature of sector performance. These findings suggest that the S&P/BMV IPC CompMx Trailing Income Equities ESG Tilted Index might not be merely reactive to prevailing trends, and the index has historically helped mitigate sector-specific volatility. By understanding historical performance patterns, there may be a clearer context for the future.

The posts on this blog are opinions, not advice. Please read our Disclaimers.

Advisor Profile: Getting the Most out of Index Provider Content

Contributor Image
Brandon Hass

Global Head of Client Solutions Group, Direct Indexing and Model Portfolios

S&P Dow Jones Indices

As financial advisors increasingly use index-based strategies to help scale their practices, many are turning to index providers not only for benchmarks—but also for insights. A recent whitepaper1 from Cerulli Associates analyzes why and how a segment of advisors, known as “index provider content users,” are actively using these insights to inform their decision-making and client interactions.

Why and How Advisors Use Index Provider Content

According to Cerulli, 37% of financial advisors report using index providers’ information, with independent registered investment advisors (RIAs) being the type of advisor most likely (44%) to use these inputs.2

Advisors are using data, thought leadership and methodology documentation as they carry out a range of advisory functions. As shown in Exhibit 1, the most common use cases are to make investment decisions (85%) and facilitate conversations with clients (74%) and prospects (73%). Some advisors are also using content as they build financial plans (62%) and train and educate their staff (53%).2 As an independent RIA interviewed by Cerulli noted, “I rely on the S&P Persistence Scorecards and an index scorecard. I am informed by some of that data.”2

These practices illustrate how index providers can potentially play a broader role in educating wealth managers by offering resources that help advisors articulate the potential value of index-based strategies to their clientele.

Commonly Used Index-Based Product Information

Cerulli finds that advisors prefer a range of content formats, depending on the context. For longer-form education and training, advisors tend to gravitate toward in-person meetings, whitepapers and webinars delivered on a quarterly or annual basis. Advisors are more likely to read emails, newsletters and blogs on at least a monthly basis.

As shown in Exhibit 2, the most commonly used types of index-based product information and education by these advisors are index performance data (89%), performance attribution analyses (79%) and documentation on index designs and methodologies (79%). Advisors also report using updates related to index changes and rebalancing (77%), as well as thought leadership on broader investing and economic trends (76%).2

Turning Insights into Differentiation

The survey results and interviews with advisors suggest that index providers can play a valuable role in expanding the index education content ecosystem by providing an independent and differentiated perspective. “It might be helpful to hear from [index providers] because asset managers are incentivized to push products and are not always the best purveyors of information,” one wirehouse advisor said.3

By offering accessible, client-facing materials that explain index design, methodology and performance, index providers deliver content that may inform advisors’ conversations with clients and prospects alike. As more advisors seek to explain how and why index-based strategies work, the ability to tap into credible, easy-to-use materials may become a key differentiator in growing their practices.

To learn more about how financial advisors are using index provider resources and related implications, explore the full Cerulli whitepaper, “Redefining the Role of Index Providers.”


1 The Cerulli Associates whitepaper “Redefining the Role of Index Providers” was sponsored by S&P Dow Jones Indices.

2 Please see page 20 of Cerulli Associates’ “Redefining the Role of Index Providers.”

3 Please see page 15 of Cerulli Associates’ “Redefining the Role of Index Providers.”

The posts on this blog are opinions, not advice. Please read our Disclaimers.

S&P 500 Quality FCF R&D Leaders Index: Highlighting Innovation, Growth and Fundamental Strength

Contributor Image
Wenli Bill Hao

Director, Factors and Dividends Indices, Product Management and Development

S&P Dow Jones Indices

Research and development (R&D) investment is often a key indicator of innovation, competitiveness and a forward-looking mindset—qualities that may drive future revenue streams and market leadership. Comparing R&D Intensity1 across companies can help identify those that are dedicating significant resources to developing new products, technologies or services capable of disrupting industries and generating lasting value. The recently launched S&P 500 Quality FCF R&D Leaders Index tracks high R&D Intensity companies that also demonstrate robust cash flows. In this blog, we will explore the index’s design, historical performance and fundamental characteristics.

Methodology Overview2

The S&P 500 Quality FCF R&D Leaders Index employs a sequential process that begins with the selection of companies exhibiting above-median free cash flow (FCF) margin and FCF return on invested capital (ROIC).3 This initial step helps ensure that only higher-quality companies, better positioned to sustain their investments in R&D, are considered. From this subset, the top 50 companies with the highest R&D Intensity are selected for inclusion in the index. Constituents are then weighted proportional to their R&D Intensity Score.

Back-Tested Outperformance

Across the full back-tested period, the S&P 500 Quality FCF R&D Leaders Index demonstrated significant outperformance compared to its benchmark universe (see Exhibit 2), albeit with higher volatility. In the shorter term, the index outperformed across the 1-, 3- and 5-year back-tested horizons.

Higher Growth and Profitability

Selecting companies based on FCF quality and R&D intensity helps identify companies that are both financially sound and positioned for future growth. These characteristics are reflected in historical fundamentals, as the S&P 500 Quality FCF R&D Leaders Index exhibited greater earnings and sales growth, higher profit margins and lower levels of leverage compared to its underlying universe (see Exhibit 3).

Innovation and Disruptive Technology – The Key Themes

Selecting companies based on R&D Intensity tilts the sector composition toward innovation-driven sectors and industries. At the sector level, the index has a 63.19% weight in Information Technology and a 30.82% weight in Health Care (see Exhibit 4). At the industry level, the top five industries within the index are Semiconductors, Application Software, Pharmaceuticals, Biotechnology and Systems Software (see Exhibit 5). Each of these industries plays a vital role in shaping the future of the Information Technology and Health Care sectors, driving growth and contributing to significant advancements across the market.

Conclusion

By selecting companies with high FCF and high R&D Intensity, the S&P 500 Quality FCF R&D Leaders Index has historically identified innovative, high-growth companies that are financially sound. These companies are not only focusing on future growth but also generating consistent cash to sustain innovation efforts without relying on excessive debt.


1 R&D Intensity is defined as R&D expenditures by a firm divided by its revenue.

2 For further details, please refer to the S&P Quality FCF R&D Leaders Index Methodology.

3 Bebb, Elizabeth et al. “The S&P Quality FCF Aristocrats® Indices – Exploring the Principles of Consistency and Efficiency in Free Cash Flow Metrics.” S&P Dow Jones Indices. April 24, 2025.

The posts on this blog are opinions, not advice. Please read our Disclaimers.

SPIVA South Africa: Key Insights and Trends

How can the latest SPIVA Scorecard help inform investors in South Africa? S&P DJI’s Tim Edwards dives into the latest SPIVA results and the trends driving South Africa’s evolving active vs. passive landscape with Asset TV’s Mosidi Modise. 

The posts on this blog are opinions, not advice. Please read our Disclaimers.