


How are benchmarks like the S&P UBS Leveraged Loan Index and S&P UBS Western European Leveraged Loan Index helping bring transparency to one of the largest fixed income markets? Take a fundamental look at leveraged loans with Marco Pouw, S&P DJI’s Director of Fixed Income Indices.
The posts on this blog are opinions, not advice. Please read our Disclaimers.Understanding and Tracking Leveraged Loans
One Year On: The Rise of the S&P Quality FCF Aristocrats Indices
Powering the Future amid the AI Surge
Faith Meets Finance: S&P 500 Christian Values Screened Index
Australian Small Caps Advance amid Higher Gold Prices
Understanding and Tracking Leveraged Loans
One Year On: The Rise of the S&P Quality FCF Aristocrats Indices

Launched Sept. 23, 2024, the S&P Quality FCF Aristocrats® Indices track companies that consistently generate robust free cash flow (FCF) over a specific number of years. FCF, which represents the cash remaining after a business meets its operational costs and capital investments, serves as a key barometer of company quality.
The S&P Quality FCF Aristocrats Indices were initially introduced across two universes: the S&P 500® Quality FCF Aristocrats Index and the S&P Developed Quality FCF Aristocrats Index, which both require positive FCF for at least 10 consecutive years. Both indices have outperformed their respective benchmark universes over the one-year period since their launch and on a YTD basis in 2025. The S&P 500 Quality FCF Aristocrats Index notably outperformed during the tariff-related drawdowns, while the S&P Developed Quality FCF Aristocrats Index saw a slightly higher drawdown, reflecting the different responses to the economic backdrop across regions.

Over the long term, including hypothetical back-tested performance, both indices have consistently outperformed their benchmark universes, demonstrating strong absolute terms as well as impressive risk-adjusted performance.

An analysis of these indices across various macroeconomic environments, including hypothetical back-tested performance, shows that they have excelled in a range of regimes characterized by rising and falling inflation and growth. Historically, the S&P Developed Quality FCF Aristocrats Index outperformed or matched the S&P Developed Large MidCap in all four environments. The S&P 500 Quality FCF Aristocrats Index only underperformed the S&P 500 during periods of high growth and high inflation.

These indices aim to identify high-quality companies through FCF-based screening and selection metrics utilized in their methodology. Exhibit 4 examines the metrics that make up the FCF score for both indices, revealing that they exhibit higher return on equity (ROE), higher operating margins and lower financial leverage compared to their respective benchmark universes.

Quality can be assessed by various metrics; however, FCF has historically proven to be an effective lens for identifying high-quality companies. The S&P Quality FCF Aristocrats Indices have had a strong start, outperforming their benchmark universes since launch while also demonstrating positive risk-adjusted performance, robust fundamentals and defensiveness over longer back-tested periods.
The posts on this blog are opinions, not advice. Please read our Disclaimers.Powering the Future amid the AI Surge

Reports indicate that AI is a major force driving markets, with nearly 50% of S&P 500® earnings estimated to be directly or indirectly linked to AI.1 The narrative surrounding AI earnings and spending is largely focused on the infrastructure development necessary to support the anticipated productivity boom, particularly in data centers and the power infrastructure.
Growth of Data Centers and Power Infrastructure
As organizations increasingly depend on data-driven decision-making, demand for cloud computing is surging, leading to significant growth in the data center market. This market is projected to reach USD 584.9 billion by 2032, reflecting a compound annual growth rate of 11.7%.2 Global electricity demand from data centers is expected to more than double by 2030, with U.S. data centers anticipated to account for nearly half of the growth in electricity demand, contributing over 20% to the overall growth.3
To meet the growing energy demands of data centers and other technology-driven applications,4 U.S. electricity demand is projected to increase by 25% by 2030 and by 78% by 2050, compared to 2023 levels.5 This growth could have significant implications for the reliability and affordability of electricity, highlighting the urgency of building a robust power system. Research indicates that investments in U.S. power infrastructure are expected to total USD 1 trillion from 2025 through 2029.6
The substantial capital flowing into these infrastructure segments has attracted market attention, as their utilization rate will likely be an early sign of the fortunes of AI and its impact on the global economy. S&P Dow Jones Indices aligns with this trend by offering two indices that track these areas: the S&P Data Center, Tower REIT and Communications Equipment Index and the S&P U.S. Power Infrastructure Select Index.
S&P Data Center, Tower REIT and Communications Equipment Index
The S&P Data Center, Tower REIT and Communications Equipment Index measures the performance of developed market-domiciled, U.S.-listed organizations involved in the ownership and management of data centers, telecommunication towers and related equipment.
This index employs FactSet’s Revere Business Industry Classification System (RBICS) Focus data to select relevant companies, which are organized into two tiers: Data Center and Tower REITs, accounting for approximately 53% of the index, and Communication Equipment, comprising about 47% as of Sept. 20, 2025.
The index includes 25 constituents, with a substantial 94% weight attributed to U.S.-domiciled companies (see Exhibit 1). In terms of GICS® breakdown, most of the weight comes from the Information Technology and Real Estate sectors, accounting for 53.5% and 42.5%, respectively (see Exhibit 2).


The S&P Data Center, Tower REIT and Communications Equipment Index has outperformed the S&P Telecom Select Industry Index over the past three years, though it has recently underperformed (see Exhibit 3). The outperformance was primarily driven by the relatively higher-weighted communications equipment companies, while the recent lag can be attributed to a higher weight in the underperforming Real Estate sector.

S&P U.S. Power Infrastructure Select Index
The S&P U.S. Power Infrastructure Select Index tracks the performance of publicly traded companies from the S&P Composite 1500® that are involved in U.S. power infrastructure. This index employs RBICS to define companies related to U.S. power infrastructure and categorizes them into three sub-themes based on their revenue exposure: Power Transmission and Distribution, Energy Supply for Electrification, and Power Generation. These sub-themes encompass the entire industry’s value chain.
As of Sept. 30, 2025, the index comprised 66 constituents, with most of its weight coming from the Utilities, Industrials and Energy sectors. Notably, the Utilities sector accounted for nearly half of the total weight (see Exhibit 4).

Compared to the S&P Composite 1500 Utilities, the S&P U.S. Power Infrastructure Select Index outperformed by 4.38% in annualized total return terms over the past three years, achieving an annualized return of 17.94% (see Exhibit 5). Since May, there has been a notable surge in performance, primarily driven by the strong performance of Electrical Equipment companies.

Conclusion
As we enter a transformative era driven by AI, the demand for robust infrastructure—especially data centers and power systems—has become increasingly critical. The S&P U.S. Power Infrastructure Select Index and the S&P Data Center, Tower REIT and Communications Equipment Index serve as essential benchmarks for evaluating the performance of companies within these vital sectors that could be a window into AI adoption across the global economy.
1 Analysis-Investors on guard for risks that could derail the AI gravy train By Reuters
2 https://www.fortunebusinessinsights.com/data-center-market-109851
5 U.S. Demand Growth Forecast | ICF
The posts on this blog are opinions, not advice. Please read our Disclaimers.Faith Meets Finance: S&P 500 Christian Values Screened Index
How are indices helping market participants align investments with their beliefs? Get to know the S&P 500 Christian Values Screened Index and explore the faith-based investment landscape with Bountiful Financial’s David Friedman and S&P DJI’s Abigail Etches and Blake Spivey.
The posts on this blog are opinions, not advice. Please read our Disclaimers.Australian Small Caps Advance amid Higher Gold Prices

The third quarter of 2025 was notable for a number of market milestones. There were 12 days when the S&P/ASX 200 reached a new all-time high at market close. The movements of the flagship market index and new highs were widely reported; however, lesser known is the outperformance of the S&P/ASX Small Ordinaries compared to the S&P/ASX 200.
The S&P/ASX Small Ordinaries was up 15.3% in Q3 2025, outperforming the S&P/ASX 200 by more than 10%. That is the largest quarterly outperformance of the S&P/ASX Small Ordinaries versus the S&P/ASX 200 since Q2 2009, when the markets were recovering from the 2008 Global Financial Crisis.

The quarter’s small-cap outperformance is also the third-largest three-month outperformance of the S&P/ASX Small Ordinaries over the S&P/ASX 200 since the inception of the index.
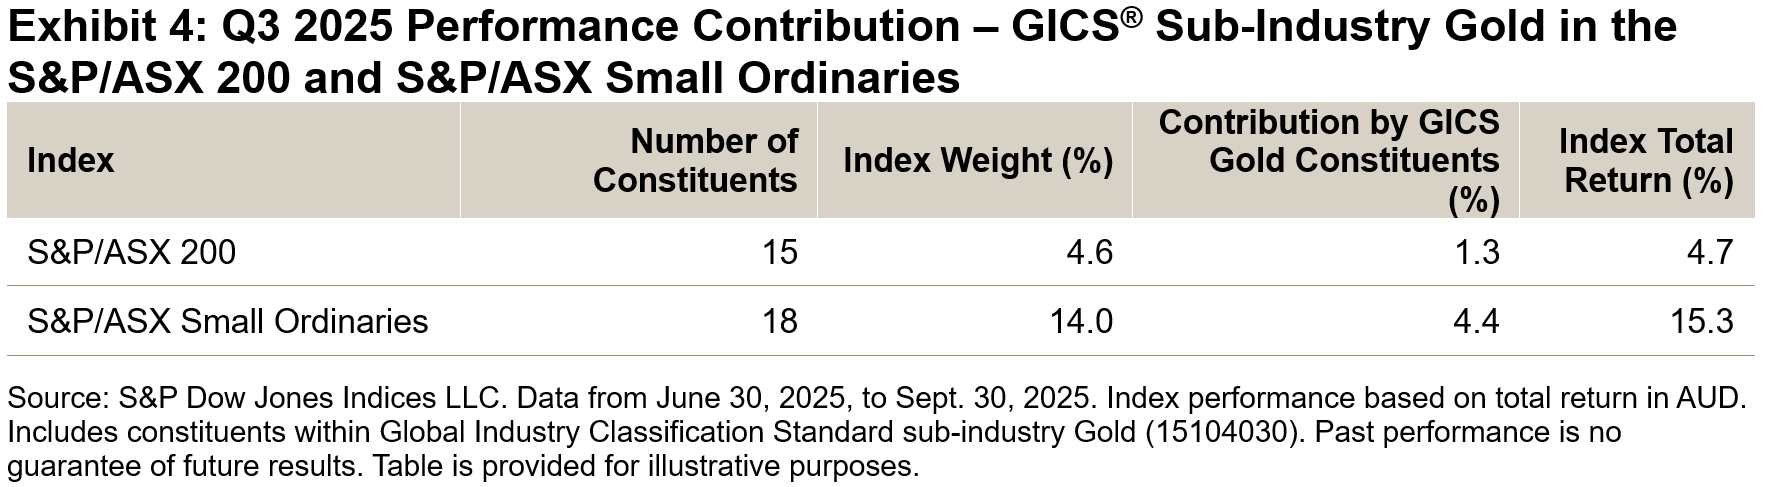
The Materials sector accounted for more than half of the S&P/ASX Small Ordinaries return for the quarter, with gold mining companies among the top contributors, benefitting from a strong gold price.
What Is the S&P/ASX Small Ordinaries?
The S&P/ASX Small Ordinaries was launched April 3, 2000, and is designed to measure the performance of smaller companies listed on the ASX. The index includes all the companies in the S&P/ASX 300, while excluding the S&P/ASX 100, which comprises the 100 largest ASX-listed companies by rank of three-month average market capitalization.
Typically, the S&P/ASX Small Ordinaries has had less representation of Financials than the S&P/ASX 200 and more diversified weights in other sectors such as Materials, Consumer Discretionary, Real Estate and Industrials.

Small Caps Offered More Diversification
The higher the weight of a constituent in an index, the larger the contribution to the index performance, based on the company’s share price movements. Fewer companies can meaningfully affect performance in a more concentrated stock market index.
As of Sept. 30, 2025, the top 10 companies in the S&P/ASX 200 comprised more than 47% of the index weight, with the “big four” banks making up 24%.1 The S&P/ASX Small Ordinaries was more diversified at the constituent level, with the top 10 companies comprising just under 15% at the same point in time. Cumulatively, the top 50 securities in the S&P/ASX 200 comprised nearly 80% of the index weight, while for the S&P/ASX Small Ordinaries, the top 50 companies represented less than 50% of the index weight.

Therefore, more companies within the S&P/ASX Small Ordinaries could have a meaningful contribution to index performance when compared to the S&P/ASX 200. Exhibit 4 further breaks down performance contribution to show a comparison of gold producers in each index.
S&P/ASX Small Ordinaries Edged ahead over Three-Year Period
With its strong performance in Q3 2025, the S&P/ASX Small Ordinaries gained 21.50% over the one-year period, doubling the gains of the S&P/ASX 200 while also edging ahead of the S&P/ASX 200 over the three-year period ending Sept. 30, 2025.
In terms of diversifying away from large-cap-heavy broad market indices, other S&P/ASX mid- and small- cap indices have also performed well. The S&P/ASX 200 Ex-S&P/ASX 100 Index (the bottom 100 companies in the S&P/ASX 200 by market cap) outperformed over the one- and three-year periods, while the S&P/ASX Midcap 50 was the top performer over the 5- and 10-year periods ending Sept. 30, 2025.

Conclusion
S&P/ASX mid- and small-cap indices have significantly outperformed in the short term and showed greater diversification at both the sector and security level compared to broad market indices, which have been increasingly concentrated in large-cap Financials and Materials.
1 Big 4 banks are made up of: Commonwealth Bank of Australia, National Australia Bank, Australia and New Zealand Banking Group and Westpac.
The posts on this blog are opinions, not advice. Please read our Disclaimers.