Get Indexology® Blog updates via email.

In This List

Crypto’s Resurgence

Rethinking U.S. Equity Exposure: A New Index Approach

Carbon Credits: Playing the Diversification Game

Wrapping Up the 2024 SPIVA Institutional Scorecard

What is SPIVA?

Crypto’s Resurgence

Contributor Image
Sherifa Issifu

Associate Director, Global Exchanges

S&P Dow Jones Indices

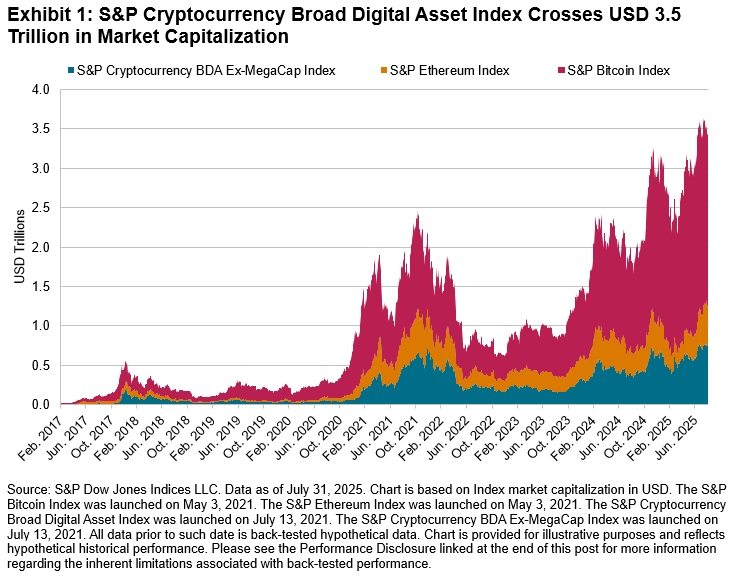
Two decades ago, crypto didn’t exist, and even a decade ago, it was still an emergent asset class. In the last few years, crypto has increased in maturity, crossing USD 1 trillion in market capitalization in 2021 and currently sitting at USD 3.5 trillion at the end of July 2025 based on the S&P Cryptocurrency Broad Digital Asset (BDA) Index. Its increased size is not the only indicator of its increasing maturity; market participants have been offered additional tools to help in their asset allocation decisions with a growing network of associated exchange-traded products, such as futures, options, ETFs and other wrappers. The crypto product ecosystem is expected to continue growing, with a robust pipeline of ETF filings globally. In addition, a shift in the global regulatory landscape for DeFi-related products is helping to create a framework for market participants in this asset class.

Crypto ETF filings followed a similar path as the underlying cryptocurrencies, with Bitcoin (BTC) and Ethereum (ETH) representing the first spot ETF filings. Bitcoin launched in 2009 as the first cryptocurrency and Ethereum launched in 2015, ushering in a second wave of crypto innovation introducing smart contracts and decentralized apps. It is not surprising that early ETF filings across various regions followed the same path, shown in Exhibit 2. In 2025, there is a growing list of single coin ETPs on a multitude of other coins outside of the mega-caps of BTC and ETH (S&P Cryptocurrency MegaCap Index) with other large-cap coins like Solana and Cardano (which are included in the S&P Cryptocurrency LargeCap Index) expected to have their own ETFs in the U.S., and XRP being recently approved in the U.S.. Recent changes to Crypto ETP SEC Filing guidelines on Sept. 17, 2025, may potentially pave the way for more crypto spot ETFs according to Reuters.

Looking further into ETF data in Exhibit 3, according to ETFGI,1 there were only two digital asset ETPs in 2015, but there are now over 300 products as of July 2025, with a collective AUM of 220 USD billion, a figure that was only at 3 USD billion in 2020. This exponential rate of growth shows the heightened demand for crypto-related products.

Over the past two years, it’s not just the number, but the variety of crypto-focused ETFs that has expanded dramatically. While single-coin ETF products based on Bitcoin and Ethereum led the adoption of cryptocurrency, we are also starting to see multi-coin, diversified “crypto basket” products looking at the top 5 and 10 largest crypto assets. The start of non-market-cap-weighted products and capping on the largest coins like Bitcoin and Ethereum has also been a recent trend, with indices and products applying principles of diversification from traditional finance. Crypto is also being increasingly thought of as a diversifier in asset allocation decisions with the launch of more multi-asset strategies that combine crypto with traditional asset classes such as equities and commodities.

However, the journey to get there hasn’t been smooth. The resilience of the AUM growth is even more impressive against the backdrop of the crypto drawdowns at the start of 2025, which was marred by uncertainty and risk-off undertones due to geopolitical tension, tariffs and concerns around whether U.S. exceptionalism would hold. At the end of March, the S&P GSCI Gold was in positive territory, sporting a return of 18%, whereas the S&P Bitcoin Index, S&P Cryptocurrency MegaCap Index and S&P Ethereum Index were down 12%, 18% and 45%, respectively, in Q1 2025 and had an even more severe drawdown compared to their peak.

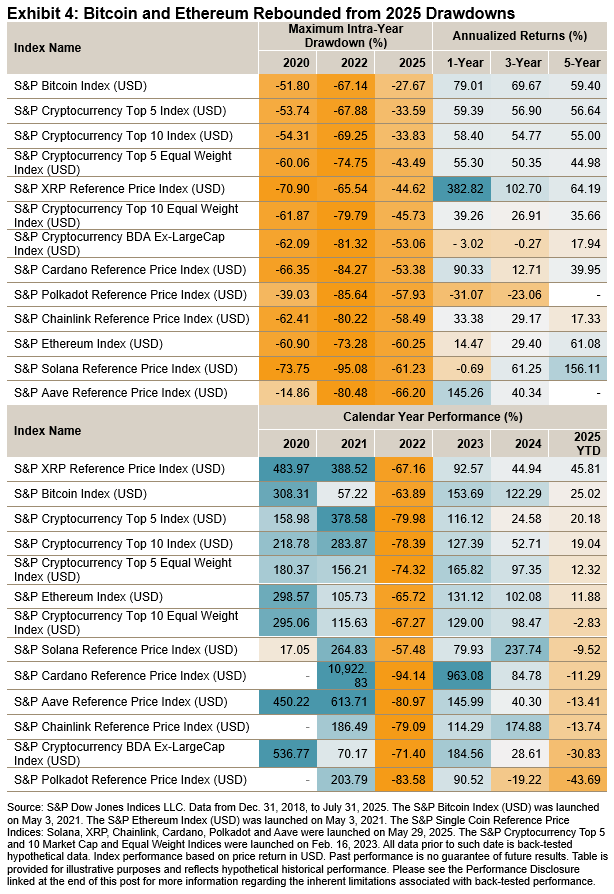
Despite this market turbulence, the largest cryptocurrencies have shown resilience, with Bitcoin and Ethereum nearing all-time highs as of July 2025. However, there remains some underperformance, with smaller coins still lagging.

While crypto remains a highly volatile asset class, its increased institutional adoption is expected to continue, with highly anticipated regulatory milestones expected to be a key part of shaping crypto for years to come. Regulatory developments, like the GENIUS Act and Clarity Act in the U.S. and MiCA in Europe, as well as expected changes in APAC adoption, could be determinants of where crypto goes next.

1ETFGI reports Crypto ETFs listed globally gathered 3.69 billion US dollars of net inflows in April.” ETFGI. May 30, 2025.

The posts on this blog are opinions, not advice. Please read our Disclaimers.

Rethinking U.S. Equity Exposure: A New Index Approach

Contributor Image
Jason Anderlik

Product Strategist

Global X

With global fragmentation accelerating and geopolitical risks rising, the traditional assumptions underpinning U.S. equity investing may be due for a fresh look. While the S&P 500® has long served as the cornerstone for broad-based U.S. market exposure, globalization has reshaped the revenue profile of many constituents. Today, more than a quarter of the companies in the index generate the majority of their revenue outside the U.S.1

In response, S&P Dow Jones Indices LLC (S&P DJI) has created two newly innovative benchmarks that aim to refine how S&P DJI measures U.S. equity large-cap companies: the S&P 500 U.S. Revenue Leaders Index and the S&P 500 U.S. Revenue Market Leaders 50 Index.

Reassessing Traditional Market Exposure

Globalization was once a tailwind. But increasingly, foreign revenue may introduce hidden risks that can complicate a U.S.-focused investment thesis. Companies with significant overseas exposure may face regulatory uncertainties, operational inefficiencies and currency translation losses that don’t always show up in domicile-based analyses. Moreover, in an environment of rising tariffs and shifting trade alliances, these risks are potentially more realizable.

This factor is especially important today, as the U.S. continues to outpace peer economies. Between 2019 and 2024, the U.S. economy grew faster than every other G7 country, driven by a surge in technology investments, infrastructure spending and resilient consumer demand. Investors seeking to align portfolios with this growth may benefit from a more targeted lens.

Two Indices, One Goal: A Stronger U.S. Core

In response to this development, S&P DJI constructed indices that emphasize domestic economic alignment over global reach and licensed those indices to Global X for use with exchange-traded funds.

  • The S&P 500 U.S. Revenue Leaders Index selects companies from the S&P 500 that derive the majority of their revenue from within the U.S. The result is a purer proxy for U.S. economic exposure that reduces the impact of foreign revenue streams.
  • The S&P 500 U.S. Revenue Market Leaders 50 Index goes a step further. It filters for companies that not only have at least 50% U.S. revenue but also rank highly on a Market Leader Score. This score is based on sustained free cash flow margins, return on invested capital and market share. These three metrics are closely linked to quality and operational resilience, and they provide a factor-based approach to pure-play U.S. equity indexing.

Conclusion

The world of 2025 looks very different from the one in which the S&P 500 was incepted. In this new landscape, the licensing relationship between Global X and S&P DJI offers a timely new measure of U.S. equity investing. This approach recognizes the evolving realities of global markets and the potential strategic value of domestic focus.

These indices aren’t just alternatives; they represent a new framework for investors who want to be precise about what “U.S. exposure” means.

The author would like to thank Scott Helfstein for his contributions to this blog.

1FactSet Research Systems. (n.d.). S&P 500 [United States Revenue Percentage]. Data accessed July 7th, 2025.

Disclosures:

Information provided by Global X Management Company LLC.

Investing involves risk, including the possible loss of principal. Diversification does not ensure a profit nor guarantee against a loss.

The Indexes’ focus on companies that earn the majority of their revenue in the United States may increase sector concentration and reduce exposure to internationally diversified firms, which could cause the Indexes to underperform the broader S&P 500 when foreign-revenue companies outperform. In addition, the Market Leader Score is derived from historical quantitative factors (free cash-flow margins, return on invested capital and market share) that may not predict future performance and can lead to higher turnover and associated costs.

This material represents an assessment of the market environment at a specific point in time and is not intended to be a forecast of future events, or a guarantee of future results. This information is not intended to be individual or personalized investment or tax advice and should not be used for trading purposes. Please consult a financial advisor or tax professional for more information regarding your investment and/or tax situation.

Past performance does not guarantee future results.

The S&P 500 U.S. Revenue Leaders and S&P 500 U.S. Revenue Market Leaders 50 Indices (the “Indices”) are products of S&P Dow Jones Indices LLC or (“S&P DJI”). S&P®, S&P 500®, US 500™, The 500™ are trademarks of Standard & Poor’s Financial Services LLC or its affiliates (“S&P”); Dow Jones® is a registered trademark of Dow Jones Trademark Holdings LLC (“Dow Jones”). These marks have been licensed by S&P DJI and sublicensed for use by Global X for certain purposes. Exchange-traded funds based on the Indices are not sponsored or sold by S&P DJI, Dow Jones, S&P or their respective affiliates and none of such parties make any representation regarding the advisability of investing in any such funds nor do they have any liability for any errors, omissions, or interruptions of the Indices.


The posts on this blog are opinions, not advice. Please read our Disclaimers.

Carbon Credits: Playing the Diversification Game

Contributor Image
William Kennedy

Commercial Rotational Program Analyst

S&P Dow Jones Indices

As financial markets respond to the ongoing energy transition, market participants are exploring ways to address the related risks and opportunities. Indices can provide insights to these factors. In this context, the S&P Global Carbon Credit Index, which turned six years old on July 25, 2025, emerges as a potential tool for enhancing diversification and to help understand the performance of underlying carbon credit markets.1

The S&P Global Carbon Credit Index tracks the most liquid segment of the tradable carbon credit futures markets, including futures contracts on European Union Allowances, U.K. Allowances, California Carbon Allowances and the Regional Greenhouse Gas Initiative and Washington Carbon Allowances (WCA), with pricing data from ICE Futures Pricing.

Exhibit 1 presents a correlation matrix that uses five-trading-day rolling returns to compare the S&P Global Carbon Credit Index with indices such as the S&P/IFCI Composite, iBoxx $ Liquid High Yield Index, iBoxx $ Liquid Investment Grade Index, S&P Listed Private Equity Index, S&P 500® and S&P United States REIT, covering the period from July 25, 2019, to July 25, 2025. The results of this analysis show that the S&P Global Carbon Credit Index exhibited a low correlation with these traditional indices, particularly with the iBoxx $ Liquid Investment Grade Index and iBoxx $ Liquid High Yield Index, with correlation values of 0.23 and 0.36, respectively.

To evaluate the potential diversification characteristics of the S&P Global Carbon Credit Index, we explored 13 hypothetical compositions, as illustrated in Exhibit 2. Starting with Composition 1, which contained only indices #2 to #7 in Exhibit 1, we examined the hypothetical impact of adding weight to the S&P Global Carbon Credit Index in 5% increments, with the remaining composition weights retaining their original relative proportions. As a result, we rebalanced each composition by proportionately decreasing the weight of the other indices, ensuring they retained their initial allocation ratios from Composition 1 in all subsequent compositions, while excluding the weight of the S&P Global Carbon Credit Index. For example, in Composition 1, the S&P 500 represents 25% of the composition. In Composition 2, with the addition of the S&P Global Carbon Credit Index at 5%, the weight of the S&P 500 is adjusted to 23.75%, reflecting 25% of 95% of the total composition.

Next, we calculated the performance for each hypothetical composition (assuming a daily rebalance to the target weights) for the period from July 25, 2019, to July 25, 2025. The resulting annualized returns, annualized volatilities and corresponding return/risk ratios are summarized in Exhibits 3 and 4.

The results of this assessment were revealing. Composition 1 began with an annualized volatility of 15.17%, resulting in a return/risk ratio of 49.07%. As the weight of the S&P Global Carbon Credit Index increased, both the return/risk ratio improved and the annualized return increased. This trend peaked in Composition 9, which recorded values of 59.96% for the return/risk ratio and 10.04% for the annualized return, associated with a 40% weight to the S&P Global Carbon Credit Index.

However, beyond Composition 9, as the weights in the S&P Global Carbon Index grew larger, volatility began to increase, while the return/risk ratio declined.

Accordingly, we may conclude that over its live history, carefully considered tilts to the S&P Global Carbon Credit Index could have led to enhanced risk-adjusted performance. Moreover, due to its historically low correlation with other traditional asset class benchmarks, the S&P Global Carbon Credit Index may provide the basis for a strategic diversification of traditional market risks as they evolve, while simultaneously serving as a mechanism for addressing emissions exposure and mitigating the potential risks associated with the energy transition.

The author would like to thank Maya Beyhan for her continued mentorship and contributions to this blog.

1 For more details on how carbon credit futures can help mitigate emission exposures and energy transition risks, see Beyhan, Maya, and Kennedy, William, “The role of indexes in the energy transition,” S&P Global, March 4, 2025.

The posts on this blog are opinions, not advice. Please read our Disclaimers.

Wrapping Up the 2024 SPIVA Institutional Scorecard

Contributor Image
Michael Brower

Former Associate Director, Index Investment Strategy

S&P Dow Jones Indices

For over 20 years, the S&P Indices versus Active (SPIVA®) U.S. Scorecard has assessed how active mutual fund managers perform against their relevant S&P Dow Jones Indices benchmarks across various timeframes and asset classes. The scorecard’s methodology was enhanced in 2015 to include institutional accounts and was further extended in 2023 to include separately managed wrap accounts (SMAs), which have an annual fee structure that bundles (or wraps) all the administrative, commission and management expenses for the account.

Wrap accounts differ from institutionally focused separate accounts in that they allow smaller market participants to access professional portfolio managers, which were once only available to large institutional investors.1 The SPIVA Institutional Scorecard is important because it facilitates comparisons between institutional and SMA/wrap accounts on a gross-of-fees basis, eliminating any possibility that fees are the sole contributor to a given manager’s underperformance.

Exhibit 1 demonstrates that 55% of equity SMAs/wrap accounts underperformed their benchmarks in 2024, down 5% from 2023. This difference was more pronounced in fixed income, where only 32% of SMAs/wrap accounts underperformed in 2024 but over 65% underperformed in the year prior. Nevertheless, and consistent with past SPIVA research, rates of underperformance for equities and fixed income increased over longer measurement periods. 80% of equity accounts and 57% of fixed income accounts failed to outperform their respective benchmarks over a 10-year period.

Active performance varied considerably by market capitalization. 67% of All Large-Cap SMA/wrap managers underperformed the S&P 500® in 2024, generally consistent with their institutional mutual fund peers. Small-cap managers fared better, with only 19% underperforming their respective benchmarks in 2024, outpacing the 30% underperformance rate in 2023. Managers were perhaps aided by style bias opportunities to tilt toward outperforming large-cap stocks. Last year, The 500™ outpaced the S&P MidCap 400® and S&P SmallCap 600® by 11.1% and 16.3%, respectively.

Turning to fixed income SMA/wrap performance, Exhibit 3 shows that U.S. Aggregate and Core accounts delivered majority outperformance, with only 11% and 13% of accounts failing to outperform their benchmarks, respectively, which was an improvement over their institutional peers. However, Municipal accounts may have had a tougher time, with more than half underperforming the S&P National AMT-Free Municipal Bond Index.

Beating the benchmark can be a challenge regardless of investment vehicle, and SMAs/Wrap accounts are no exception. For a more complete analysis of performance across segregated institutional and SMAs/wrap accounts, we invite you to read our full 2024 SPIVA Institutional Scorecard.

1 Comprehensive definitions for SMAs can be found in the eVestment Alliance Glossary of Terms.

The posts on this blog are opinions, not advice. Please read our Disclaimers.

What is SPIVA?

For over two decades, S&P Dow Jones Indices has measured the performance of actively managed funds against their index benchmarks across the world through the SPIVA Scorecards. Take a closer look at the fundamental principles that guide our SPIVA research and discover the insights these scorecards offer across asset classes, regions and market segments.

The posts on this blog are opinions, not advice. Please read our Disclaimers.