For over 20 years, the S&P Indices versus Active (SPIVA®) U.S. Scorecard has assessed how active mutual fund managers perform against their relevant S&P Dow Jones Indices benchmarks across various timeframes and asset classes. The scorecard’s methodology was enhanced in 2015 to include institutional accounts and was further extended in 2023 to include separately managed wrap accounts (SMAs), which have an annual fee structure that bundles (or wraps) all the administrative, commission and management expenses for the account.
Wrap accounts differ from institutionally focused separate accounts in that they allow smaller market participants to access professional portfolio managers, which were once only available to large institutional investors.1 The SPIVA Institutional Scorecard is important because it facilitates comparisons between institutional and SMA/wrap accounts on a gross-of-fees basis, eliminating any possibility that fees are the sole contributor to a given manager’s underperformance.
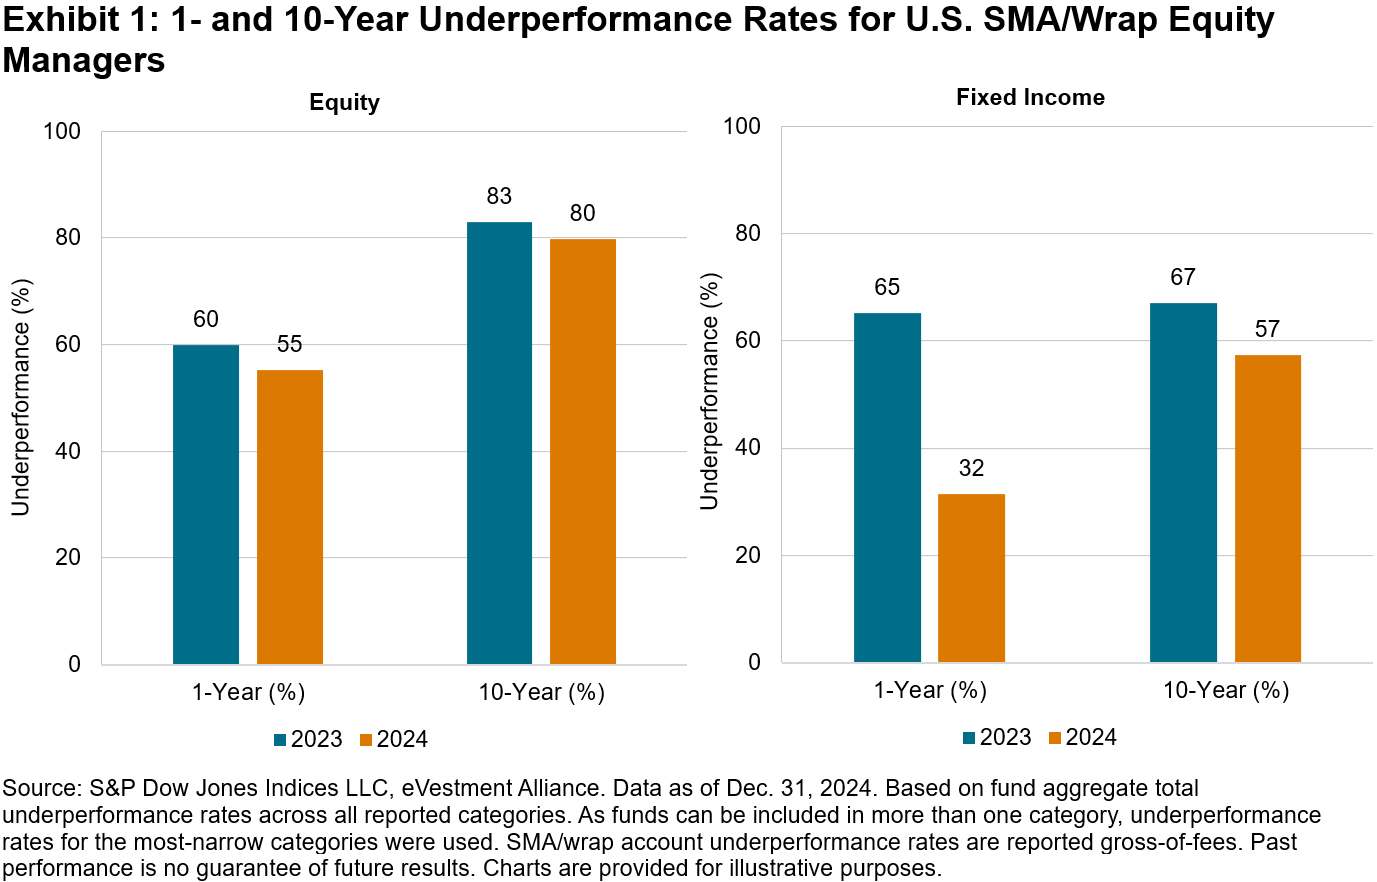
Exhibit 1 demonstrates that 55% of equity SMAs/wrap accounts underperformed their benchmarks in 2024, down 5% from 2023. This difference was more pronounced in fixed income, where only 32% of SMAs/wrap accounts underperformed in 2024 but over 65% underperformed in the year prior. Nevertheless, and consistent with past SPIVA research, rates of underperformance for equities and fixed income increased over longer measurement periods. 80% of equity accounts and 57% of fixed income accounts failed to outperform their respective benchmarks over a 10-year period.
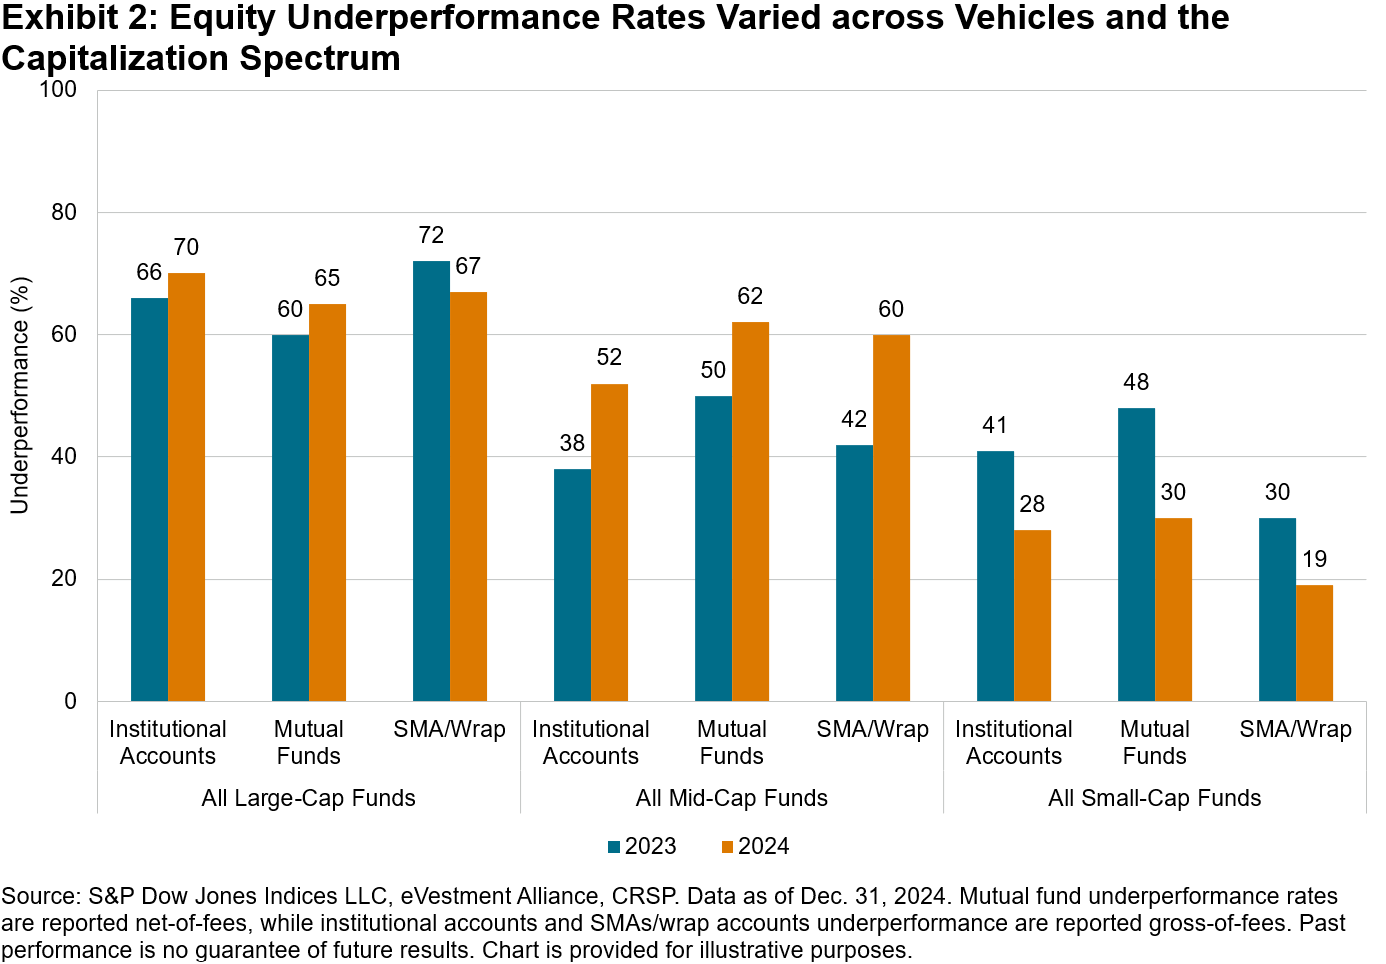
Active performance varied considerably by market capitalization. 67% of All Large-Cap SMA/wrap managers underperformed the S&P 500® in 2024, generally consistent with their institutional mutual fund peers. Small-cap managers fared better, with only 19% underperforming their respective benchmarks in 2024, outpacing the 30% underperformance rate in 2023. Managers were perhaps aided by style bias opportunities to tilt toward outperforming large-cap stocks. Last year, The 500™ outpaced the S&P MidCap 400® and S&P SmallCap 600® by 11.1% and 16.3%, respectively.
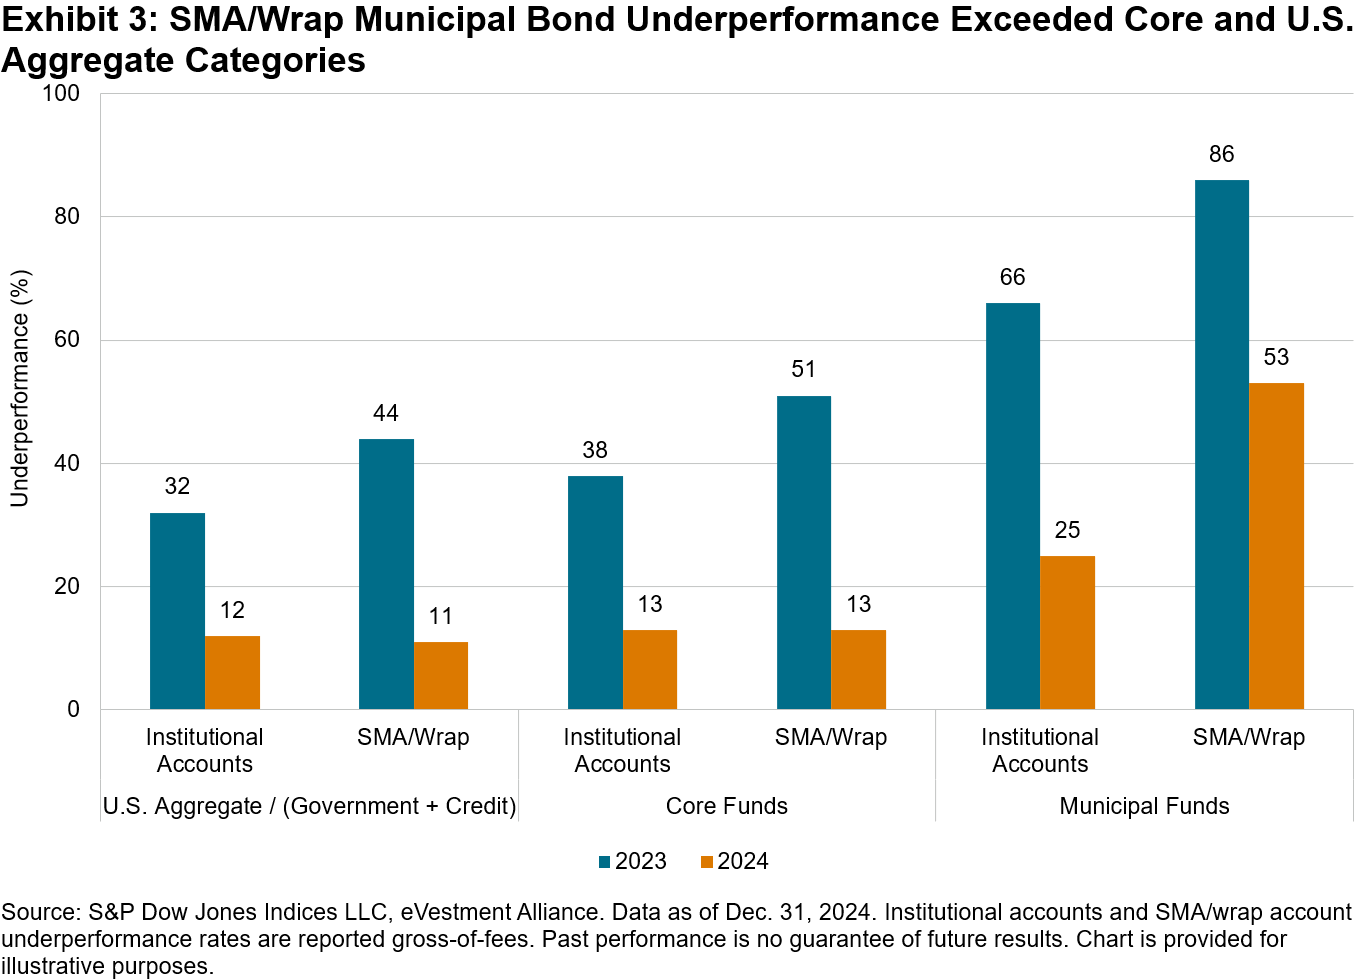
Turning to fixed income SMA/wrap performance, Exhibit 3 shows that U.S. Aggregate and Core accounts delivered majority outperformance, with only 11% and 13% of accounts failing to outperform their benchmarks, respectively, which was an improvement over their institutional peers. However, Municipal accounts may have had a tougher time, with more than half underperforming the S&P National AMT-Free Municipal Bond Index.
Beating the benchmark can be a challenge regardless of investment vehicle, and SMAs/Wrap accounts are no exception. For a more complete analysis of performance across segregated institutional and SMAs/wrap accounts, we invite you to read our full 2024 SPIVA Institutional Scorecard.
1 Comprehensive definitions for SMAs can be found in the eVestment Alliance Glossary of Terms.
The posts on this blog are opinions, not advice. Please read our Disclaimers.