Get Indexology® Blog updates via email.

In This List

Diversifying Exceptionalism

Rebalance Review of the S&P Global Clean Energy Index – H2 2024

A Balanced Approach: Inside the S&P 500 Equal Weight Index

S&P Israel 100 Index: Reflecting Israel's Potential

Direct Indexing: Launch of MyIndex™ with S&P DJI and Brooklyn Investment Group

Diversifying Exceptionalism

Contributor Image
Anu Ganti

Head of U.S. Index Investment Strategy

S&P Dow Jones Indices

Despite recent sharp U.S. market declines after the Federal Reserve signaled fewer than expected rate cuts, much of recent year-end market commentary has been focused on U.S. exceptionalism and the divergence of U.S. equities compared to the rest of the world. The S&P 500® was up 24.8% YTD through Dec. 18, 2024, reaching 57 all-time closing highs so far this year, propelled by robust economic growth, AI-related enthusiasm and optimism surrounding President-elect Trump’s return.

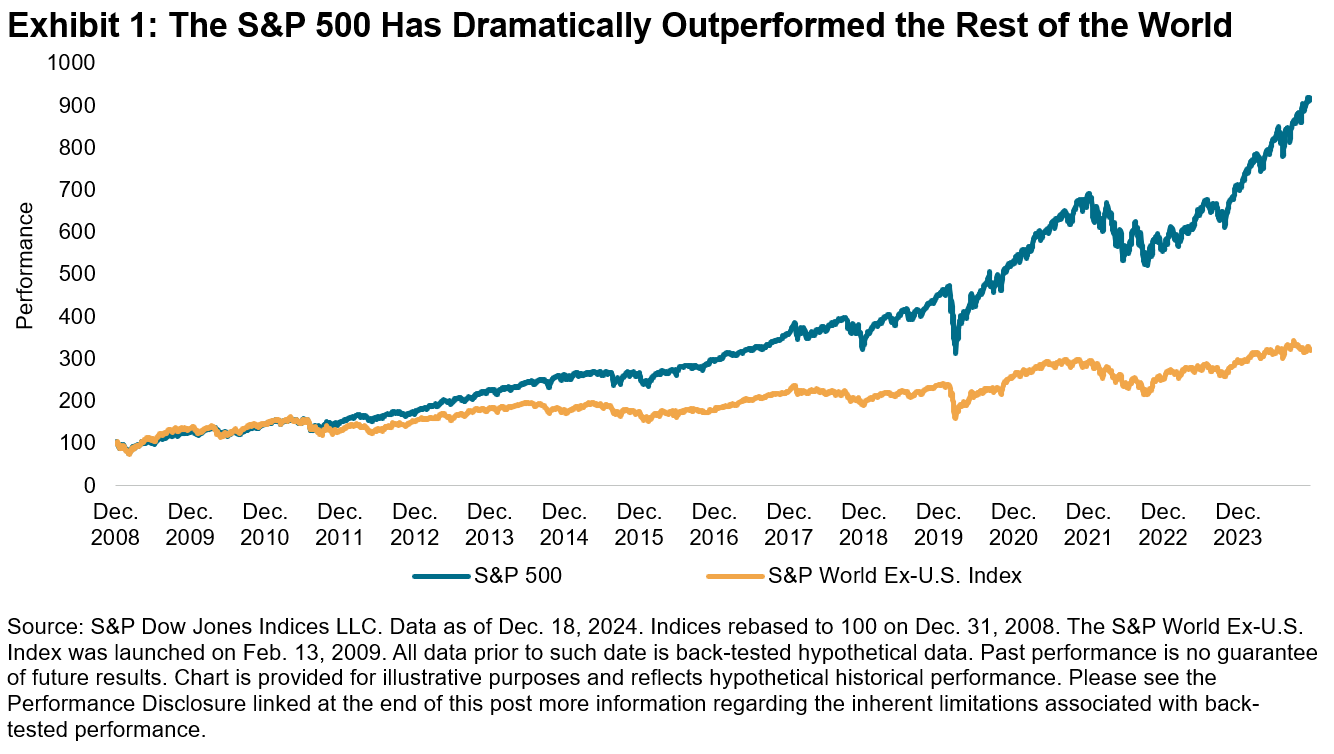
Exhibit 1 shows that U.S. outperformance is not a new phenomenon. The S&P 500 has significantly outperformed the rest of the world over the past fifteen years, with a cumulative return of 887% since Dec. 31, 2008, compared to an equivalent return of 320% for the S&P World Ex-U.S. Index.

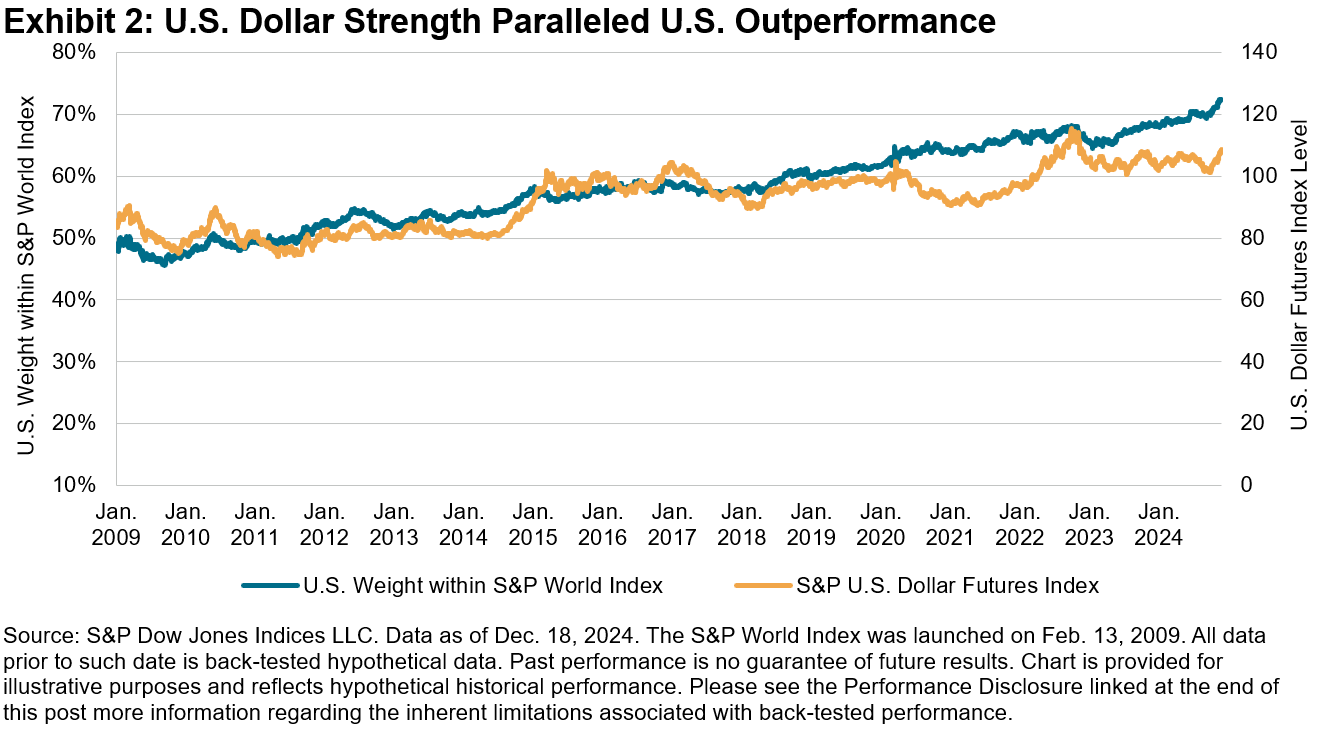
We’ve noted previously that concentration trends can manifest at a country level. As a result of its outperformance, the weight of the U.S. component of our S&P World Index has risen accordingly from roughly 50% in 2009 to over 70% currently. Meanwhile, the U.S. dollar has strengthened in tandem, as illustrated by Exhibit 2, which may create potential headwinds for large-cap multinational companies that tend to have more overseas revenue exposures and tailwinds for smaller, more domestically sensitive stocks.

Turning our attention across the capitalization spectrum, the outperformance of U.S. equities broadened beyond large caps during the second half of the year, thanks to additional catalysts beyond dollar strength, including Fed rate cuts and post-election enthusiasm for potential impending tariff policies that may benefit smaller caps. Although mega caps have returned to favor so far in December, the S&P MidCap 400® and the S&P SmallCap 600® have outperformed the S&P 500 by 2.6% and 5.2%, respectively, since July 9, a key turning point for U.S. markets, as investors began to shift away from the Magnificent 7 and other mega caps toward smaller companies.

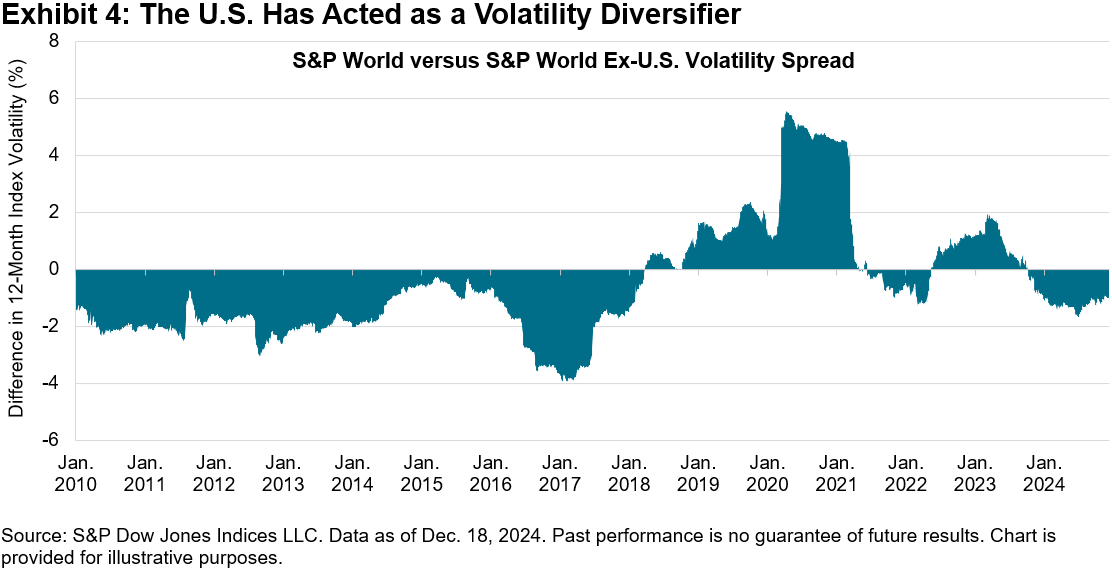
In addition to their stellar outperformance, U.S. equities are interesting to analyze for their diversification potential. In Exhibit 4, we calculate the spread in trailing 12-month volatility between the S&P World Index and S&P World Ex-U.S. Index. When this spread is positive, the inclusion of the U.S. increases volatility in the benchmark; when negative, the country acts as a diversifier. The negative spread that has occurred so far this year is an indication that the U.S. has become a volatility diversifier,1 consistent with the divergent performance observed earlier.

As we look ahead to 2025, while we do not know whether the U.S. market rally will be sustained or if smaller caps will maintain their momentum, we can acknowledge that if the outperformance of the U.S. compared to the rest of the world continues, the associated diversification properties may have important consequences for asset owners globally.


1We do acknowledge that the U.S. makes up more than 70% of the weight in the S&P World Index, but caveat that the U.S. component includes exposure to large multinational companies that have a diverse revenue base across geographies.

The posts on this blog are opinions, not advice. Please read our Disclaimers.

Rebalance Review of the S&P Global Clean Energy Index – H2 2024

Contributor Image
Abbie Zhang

Senior Analyst, Thematic Indices

S&P Dow Jones Indices

Launched in 2007, the S&P Global Clean Energy Index has been a headline benchmark for measuring clean energy-related companies’ performance over the past 16 years. In April 2021, we launched the S&P Global Clean Energy Select Index to measure the 30 largest companies in global clean energy businesses listed on developed market exchanges.

Both indices had their semiannual rebalances on Oct. 18, 2024. The index methodology categorizes companies into four exposure score buckets ranging from 0 to 1, with a 0.25 increment, to measure their clean energy business purity. Exhibits 1 and 2 show the change in exposure before and after the October rebalance for both indices. For the S&P Global Clean Energy Index, the weighted average exposure score of the index increased slightly from 0.92 to 0.93. The S&P Global Clean Energy Select Index consists of 30 companies with an exposure score of 1 listed in the developed market exchanges (see Exhibit 2).

In the market allocation breakdown, significant changes in the S&P Global Clean Energy Index following the rebalance include a 6.41% increase in the weight of the U.K. and a 2.13% increase for Brazil, alongside an 8.80% decrease for the U.S. Meanwhile, for the S&P Global Clean Energy Select Index, Portugal’s weight rose by 4.04%, while the weights of South Korea and Brazil experienced declines of 3.11% and 2.92%, respectively.

The S&P Global Clean Energy Index and the S&P Global Clean Energy Select Index track both the performance of clean energy technology firms and clean power generation companies (see Exhibit 3). During the recent rebalance, the index weight of clean technology in the S&P Global Clean Energy Index increased, primarily driven by a 1.12% rise in the index weight for the FactSet Revere Business Industry Classifications System (RBICS) subindustry of Wind Energy Equipment Manufacturing. Conversely, the index weight for clean power generation decreased, largely due to a 7.4% weight decrease in the RBICS subindustry of United States Northeast Electric Utilities.

The composition change of the S&P Global Clean Energy Select Index was different, featuring a decrease in clean technology weight alongside an increase in clean power generation weight. Within clean technology, there was a 3.39% drop in the RBICS subindustry of Photovoltaic and Solar Cells and Systems Providers. Meanwhile, clean power generation saw a 3.3% increase in the RBICS subindustry of Europe Mixed Alternative Wholesale Power and a 1.6% rise in the RBICS subindustry of Europe Solar Wholesale Power.

The inclusion or exclusion of constituents within the S&P Global Clean Energy Select Index could be a result of the change on exposure score, or it could be due to the market movements that changed the relative float market capitalization ranking of companies within the S&P Global Clean Energy Index. For exposure score information, please refer to S&P DJI’s Client Resource Center.

S&P Global Clean Energy Index Performance YTD in 2024

Underperforming the S&P Global BMI YTD, the S&P Global Clean Energy Select Index was down 25.78% and the S&P Global Clean Energy Index was down 19.93% in USD total return terms. Dispersion was high among constituents of the S&P Global Clean Energy Index. SolarEdge Technologies (-83.12%), Shoals Technologies (-66.41%) and Hanwha Solutions Corporation (-61.58%) were among the lagging performers, while Suzlon Energy (up 61.24%) and NHPC (up 23.55%) made positive contributions, partially offsetting some of the losses.

We recently published the paper “Navigating the Clean Energy Transition: Market Dynamics and Performance Insights,” which delves into the market dynamics around the clean energy transition. The paper outlines the energy transition process, provides an overview and performance review of the S&P Global Clean Energy Indices, discusses ongoing policy support for the energy transition and presents a quantitative analysis of performance. For those seeking a deeper understanding of these topics, the paper offers valuable perspectives on the current state and future potential of the clean energy transition.

The posts on this blog are opinions, not advice. Please read our Disclaimers.

A Balanced Approach: Inside the S&P 500 Equal Weight Index

How can an equal weight approach to U.S. equities help to address concerns around mega-cap concentration? S&P DJI’s Anu Ganti and CME Group’s Joe Hickey explore the S&P 500 Equal Weight Index’s historical performance trends and its potential applications for market participants seeking enhanced diversification.

The posts on this blog are opinions, not advice. Please read our Disclaimers.

S&P Israel 100 Index: Reflecting Israel's Potential

Contributor Image
Diego Zurita

Analyst, Global Equities & Thematics

S&P Dow Jones Indices

The Israeli stock market has a unique landscape, offering stability and liquidity comparable to other well-established markets, while also providing regional diversification as the only developed market in the Middle East. In recent years, Israel has been a spotlight for technology and innovation, hosting many high-tech companies from industries like cybersecurity, biotechnology and software development. To highlight the significance of this market, S&P Dow Jones Indices offers the S&P Israel 100 Index.

The S&P Israel 100 Index measures the performance of the 100 largest and most liquid companies listed and domiciled in the Israeli stock market. Following a float-adjusted market capitalization weighting, the index is reconstituted and rebalanced quarterly to capture market trends. To reduce overconcentration, single constituent weights are capped at 8% and single GICS sectors are capped at 30% at each rebalancing. For more details about the index construction, the methodology can be found on the S&P Dow Jones Indices website.

Launched in August 2023, the S&P Israel 100 Index is calculated in U.S. dollars and new Israeli shekels with more than 12 years of daily index level data available. The index includes all 11 GICS sectors, with Financials having the biggest market cap weight at 31.9%, followed by Information Technology (19.0%) and Real Estate (13.0%), as of the end of November 2024 (see Exhibit 2).

After a year of volatility and an accompanying modest annual return of 4.8% in 2023, 2024 YTD returns for the S&P Israel 100 Index have seen multiple all-time highs. Having returned 23.4% YTD (as of November 2024), the index has maintained a similarly positive trend as the S&P 500 (up 28.1% YTD) and the S&P World Index (up 22.4% YTD), as seen in Exhibit 3.

The main contributors to the YTD performance of the S&P Israel 100 Index vary across sectors, with Financials playing a significant role, along with Teva Pharmaceutical Industries from the Health Care sector, whose growth has been attributed to an increase in revenue from both their generic and branded drugs, as well as semiconductor manufacturers (Tower Semiconductor Ltd and Nova Ltd) from the Information Technology sector, which have been boosted by increased interest around the AI space. The top 10 contributors of the index accounted for 72.3% of its performance (see Exhibit 4).

The Tel Aviv 125 Index, also known as the TA-125 Index, is one of the most broadly used benchmarks to reflect the performance of Israeli markets. The S&P Israel 100 Index has provided a differentiated return profile compared to the TA-125 Index, while exhibiting improved performance over the most recent 10-year period.

The S&P Israel 100 Index measures Israel’s leading companies across the sector landscape. With a transparent, rules-based methodology, this index offers the possibility of geographical diversification among developed markets, given its focus on a country with unique characteristics. As the only developed market in the Middle East, the index reflects the distinct characteristics of Israel’s dynamic economy.

The posts on this blog are opinions, not advice. Please read our Disclaimers.

Direct Indexing: Launch of MyIndex™ with S&P DJI and Brooklyn Investment Group

What’s fueling the growing interest in direct indexing? S&P DJI’s Robby Ross and Brandon Hass sit down with Erkko Etula from Brooklyn Investment Group to explore how direct indexing solutions can enable investment managers to customize leading indices like the S&P 500 to meet specific objectives.

The posts on this blog are opinions, not advice. Please read our Disclaimers.