Get Indexology® Blog updates via email.

In This List

Of Tariffs Tango and Manufacturing Moves

Frequent Flyers

Where Shariah Meets ESG

Exploring Fixed Income’s Passive Potential

Using Innovative Tools to Dynamically Manage Risk

Of Tariffs Tango and Manufacturing Moves

Contributor Image
Srineel Jalagani

Senior Director, Thematic Indices

S&P Dow Jones Indices

It’s well known that as the U.S. consumer goes, so goes its economy. Various estimates suggest that around 67% of U.S. GDP depends on consumer spending. At the macro level, all this consumer spending translates into the consumption of goods and services. The U.S. economy, like most developed economies, comfortably falls into the category of a service-driven economy. Although manufacturing’s contribution to nominal U.S. GDP is small, the manufacturing segment is a closely tracked macroeconomic metric that forms part of the Leading Economic Indicators (LEI) basket to track the economic cycle.

Manufacturing in Policy Crosshairs

On the global stage, the manufacturing segment has come under increased scrutiny in the current geopolitical climate, as approximately 50% of the world’s population heads to the voting booth. The peak pandemic supply chain disruptions exposed the fault lines around the Just-In-Time manufacturing framework, which was optimized for low cost above all else. There is now a reassessment of these supply chains with increased emphasis on resilience to global disruptions (e.g., the COVID-19 pandemic) and perceived national security threats.

Tariffs have increasingly been used as a policy instrument by governments even before the pandemic, as part of a carrot-and-stick approach to rejuvenate domestic manufacturing. While not all tariffs induce growth in local manufacturing, both the previous and current U.S. administrations have cited increased domestic manufacturing as a major factor in applying tariffs. On the carrot side of this approach, the current administration’s fiscal spending programs also allocate a sizable amount to incentivize local manufacturing. Companies and financial markets have also responded to this evolving trend, with references to “reshoring” and related terms in the earnings calls soaring in the last couple of years.1

Fabrication with a Focus

The S&P U.S Manufacturing Select Index was launched in April 2024 and tracks U.S.-listed companies that have a significant portion of their revenue sourced from U.S. markets, and whose revenue streams fall into one of the 11 industry group categories as defined within FactSet’s Revere Business Industry Classification System (RBICS) Focus framework. The index is weighted using an adjusted float-market-cap approach, optimized for constraints to provide constituent-level and RBICS category-level diversification.

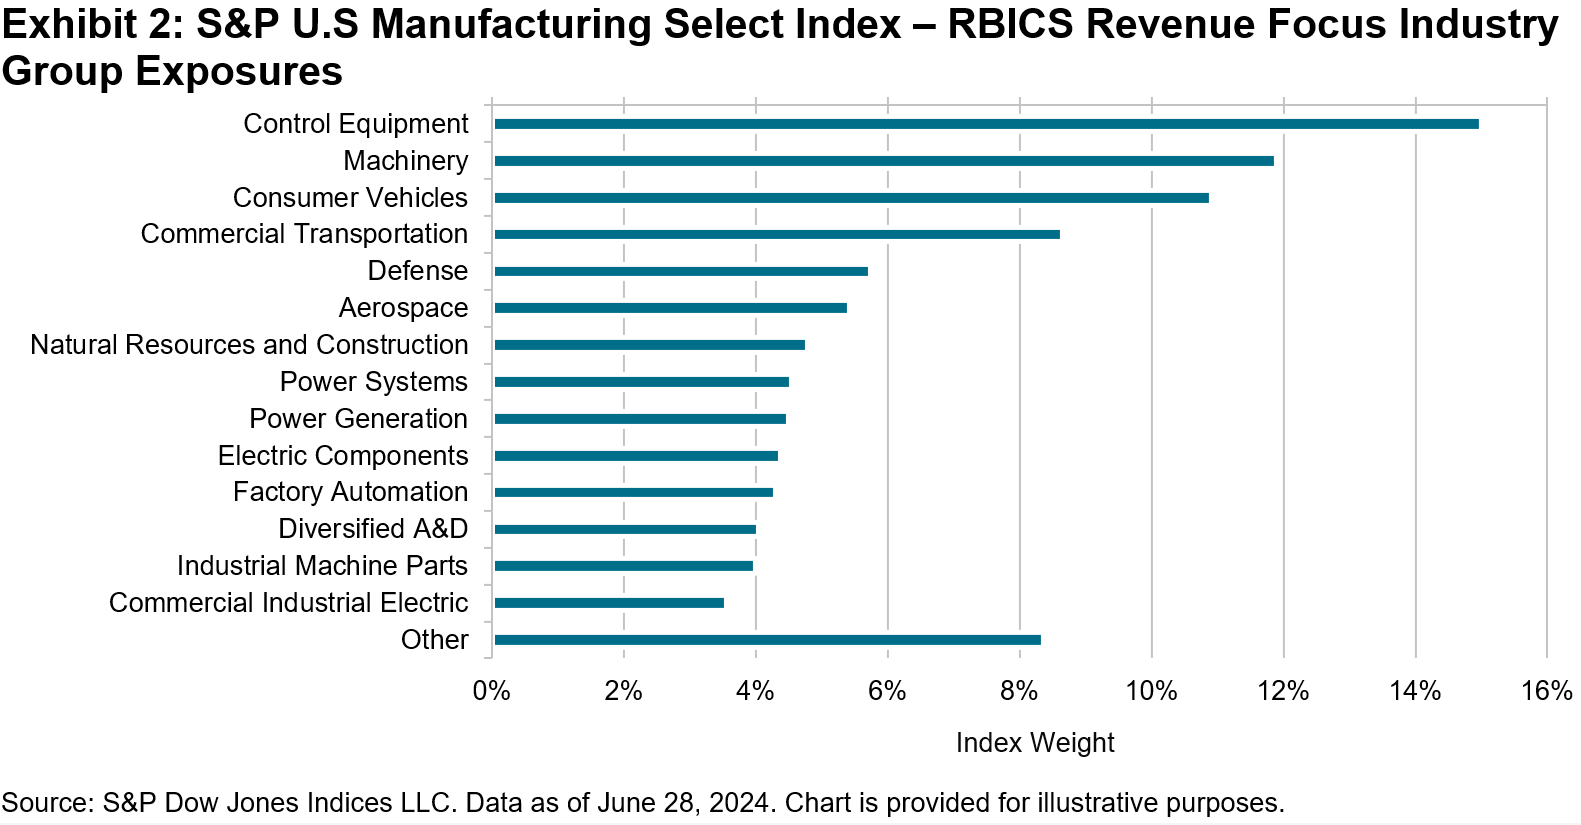
The 11 revenue categories for this index are spread across three main RBICS Focus sectors—Industrial Manufacturing, Consumer Vehicles and Parts, and Electronic Components and Manufacturing. These categories are selected based on their direct relevance to U.S. tariffs and legislations targeting a U.S. manufacturing resurgence. Fractious geopolitics are expected to bring about a new era of increased defense spending, and some of the selected revenue categories also align with U.S. strategic priorities around building a “resilient industrial base.”

FactSet’s Geographic Revenue data categorizes approximately 67% of the index constituents’ revenue being sourced from the U.S. As expected, the latest basket is heavily tilted toward the Industrials sector (approximately 75%), with Machinery, Electrical Equipment, and Aerospace & Defense as the primary industries. The index is balanced across the RBICS industry groups, with the 5 biggest groups accounting for 52% of the index weight.

The index’s five-year performance has been robust, slightly outperforming its starting universe of the S&P United States BMI, as well as the S&P 500 Industrials.

Conclusion

The world’s largest economy is pushing to reimagine its manufacturing sector for greater resilience in an environment of increased supply chain risks, coupled with attention to national security concerns. The S&P U.S. Manufacturing Select Index tracks a subset of companies belonging to a curated list of RBICS revenue focus categories, which we believe are closely aligned with industries at the forefront of these manufacturing shifts—sometimes characterized as “reshoring.” This multifaceted approach leads to index constituents not only from the Industrials sector, but also from Information Technology (Semiconductors segment) and Consumer Discretionary (Consumer Vehicles segment) sectors.

1 Sources: ETFStream, The Wall Street Journal, Yahoo Finance and Bank of America Institute.

The posts on this blog are opinions, not advice. Please read our Disclaimers.

Frequent Flyers

Contributor Image
Joseph Nelesen

Head of Specialists, Index Investment Strategy

S&P Dow Jones Indices

Planes are interesting places, airborne aluminum tubes stuffed with strangers from all walks of life, including seatmates prodding with the proverbial ice-breaker, “So, what do you do?” Overhearing many such conversations, I’ve found complicated job descriptions elicit blank stares and subsequently lead to higher-level answers such as “Well, I’m in tech,” or “I work in finance,” or “Been in energy my whole career,” followed by the “Ahhhh, OK!” of understanding. That’s because every profession, truly everything, falls into an industry that ultimately rolls up into one of the 11 GICS® sectors, and after frequently observing the ups and downs of sectors as they gather mileage over the years, we all know what they “do.”

We also know sectors are globally relevant, immense in size and important to nearly every economic discussion and investment strategy. That’s why we continue to research their application, including in our recent paper: Natural Selection: Tactics and Strategy with Equity Sectors.

While the S&P 500’s USD 45 trillion total market cap reflects the U.S.’s position as the largest equity market in the world, individual S&P 500 sectors are also prominent, with many surpassing the total market cap of major single-country equity markets, as shown in Exhibit 1.

Since their inception, the use of S&P 500 Sector Indices as benchmarks for products has become increasingly widespread around the world. From the Middle East to the U.K., Japan and beyond, possible applications of S&P 500 sectors range from avoiding home bias and diversifying sector exposures to driving performance through tactical and strategic sector tilts. For evidence of the continuing growth of sector applications, one need not look further than the aggregate assets under management (AUM) in globally domiciled sector and industry index instruments (exchange-traded funds [ETFs] and futures), as shown in Exhibit 2.

Growth in sector assets could be a byproduct of investors worldwide understanding not only what each sector includes, but also how each sector historically tended to perform in different phases of the economic cycle. The differentiated holdings and low correlations of excess performance among sectors and industries has offered the possibility of seeking outperformance through sector tilting or rotation.

For example, categorization of sectors into cyclical groupings (those that have historically tended to exhibit higher beta and outperform during expansions) and defensive groupings (those that have tended to exhibit lower beta and outperform during declines) can also be effective. Categorizing sectors into defensive or cyclical groups based on ranking their risk attributes and their excess returns during rising or falling markets can offer insight into the potential outcome of sector tilts that historically achieve relatively better performance in each environment. Exhibit 3 illustrates this point, showing the average rolling three-month excess performance of S&P 500 sectors during periods when the S&P 500 was rising or falling.

While the eventual rise and fall of markets seems inevitable, no one can perfectly predict how much turbulence we’ll encounter during the journey. Fortunately, sectors are one tool to understand and navigate through whatever bumps are encountered along the way.

The posts on this blog are opinions, not advice. Please read our Disclaimers.

Where Shariah Meets ESG

Contributor Image
Maya Beyhan

Global Head of Sustainability, Index Investment Strategy

S&P Dow Jones Indices

There are parallels between Shariah and ESG principles, such as being a good steward to society and the environment. Having such overlapping and complementary principles has led to their natural pairing and a growing traction for ESG Shariah solutions around the globe. However, there is something that may be unexpected about these indices: even though they do not offer it by design, some ESG Shariah solutions can offer a strong temperature alignment. One such example is the S&P Pan Arab Composite ESG Shariah Capped Index (Custom).

This index is designed to measure the performance of the 40 companies with the highest-ranking ESG scores (as measured by the Corporate Sustainability Assessment [CSA] conducted by S&P Global Sustainable1), from 60 of the largest (by float-adjusted market capitalization) constituents of its benchmark, the S&P Pan Arab Composite Shariah Index.1

Based on its design, the S&P Pan Arab Composite ESG Shariah Capped Index (Custom) achieved an ESG score improvement of 3.94 against its benchmark, as of June 28, 2024. This is based on an aggregate score, however, and drilling further down into the underlying criteria for the environmental, social and governance pillars can give additional granularity on the index’s ESG performance. We identified three criteria, one for each pillar, for which most companies were assigned a score. The Environmental Policy & Management criterion in the “E” pillar refers to the management of an organization’s environmental programs in a comprehensive, systematic, planned and documented manner. Human Capital Development in the “S” pillar can make up a significant part of a company’s intangible assets, and for many industries, human capital development is one of the most financially material sustainability factors. On the other hand, the Business Ethics criterion evaluates the Codes of Conduct, their implementation and the transparent reporting on breaches, as well as corruption & bribery cases and anti-competitive practices. Exhibit 1 summarizes the change in ESG criteria for a given calendar year for the S&P Pan Arab Composite ESG Shariah Capped Index (Custom).

The S&P Pan Arab Composite ESG Shariah Capped Index (Custom) achieved a consistent improvement in each of the ESG criteria over the two years since its inception. The improvement of 12.0 in Human Capital Development criterion in the “S” pillar in 2023 particularly stands out.  Environmental Policy & Management was improved by 5.7 in 2022 since the index’s inception, followed by 2.8 in 2023. Business Ethics had a materially higher improvement in 2023, with 3.9 compared to only 0.1 in 2022.

Now, let’s put that unexpected trait of some ESG Shariah indices, which is not offered by their design, under the spotlight—i.e., a strong temperature alignment. The S&P Pan Arab Composite ESG Shariah Capped Index (Custom) is not explicitly designed to target improved temperature alignment (a transition pathway assessment that examines the adequacy of emission reduction over time to meet a 2°C carbon budget). However, as of June 28, 2024, it achieved a 1.5°C alignment and was 9% under its 2°C carbon budget, versus the S&P Pan Arab Composite Shariah, its benchmark, which was 7% over budget and was 3°C aligned.2 Furthermore, the S&P Pan Arab Composite ESG Shariah Capped Index (Custom) improved the carbon intensity3 and fossil fuel reserves4 by 45% and 51%, respectively, against its benchmark.

Given the superior sustainability profile that the index exhibited, we calculated its weighted average impact ratio, which is the index-weighted total direct and indirect external costs as a percentage of revenues. The external cost is an estimate of the value of a service based on the cost of damage that results from its loss. It is based on the assumption that the cost of maintaining an environmental benefit is a reasonable estimate of its value. Exhibit 2 illustrates the environmental footprint of the index from a sectoral perspective and compares it against its benchmark.

The S&P Pan Arab Composite ESG Shariah Capped Index (Custom) achieved an impact ratio improvement of 41.07% versus its benchmark. The largest contribution came from Utilities, which had an allocation effect of 35%. The Utilities sector is 4°C aligned and, together with Energy, is one of the main detractors from the carbon budget. The index was, on average, 2.86% underweight in Utilities since its inception. This contributed positively to its relative impact ratio performance.

Going beyond the ESG score improvement that is implied in its index construction, the S&P Pan Arab Composite ESG Shariah Capped Index (Custom) achieved a strong sustainability profile, even though its design does not offer it. It would be interesting to see if this observation continues, as it might help to shed more light on the parallels between Shariah and ESG principles.

1 For more information, please see the S&P Custom Indices Methodology.

2 In a previous analysis, we had a similar observation for another broad ESG index.

3 Based on weighted average carbon intensity (metric tons of CO2e/USD million revenues) using direct plus first tier indirect emissions.

4 Fossil fuel reserves: The carbon footprint that could be generated if the proven and probable fossil fuel reserves owned by index constituents were burned per USD 1 million invested.

The posts on this blog are opinions, not advice. Please read our Disclaimers.

Exploring Fixed Income’s Passive Potential

Passive investing has historically been more associated with equities than with fixed income, but recent data indicates a change could be in the winds. S&P DJI’s Tim Edwards and Anu Ganti take a closer look at what’s driving the shift and what a passive transformation could mean for fixed income markets.

The posts on this blog are opinions, not advice. Please read our Disclaimers.

Using Innovative Tools to Dynamically Manage Risk

Advances in volatility-based benchmarking have paved the way for the development of innovative tools for dynamically managing risk. Meet the S&P 500 Futures Edge Volatility Index Series, the next generation of volatility management benchmarks.

The posts on this blog are opinions, not advice. Please read our Disclaimers.