Get Indexology® Blog updates via email.

In This List

Frequent Flyers

Where Shariah Meets ESG

Exploring Fixed Income’s Passive Potential

Using Innovative Tools to Dynamically Manage Risk

The Ethics of Artificial Intelligence

Frequent Flyers

Contributor Image
Joseph Nelesen

Head of Specialists, Index Investment Strategy

S&P Dow Jones Indices

Planes are interesting places, airborne aluminum tubes stuffed with strangers from all walks of life, including seatmates prodding with the proverbial ice-breaker, “So, what do you do?” Overhearing many such conversations, I’ve found complicated job descriptions elicit blank stares and subsequently lead to higher-level answers such as “Well, I’m in tech,” or “I work in finance,” or “Been in energy my whole career,” followed by the “Ahhhh, OK!” of understanding. That’s because every profession, truly everything, falls into an industry that ultimately rolls up into one of the 11 GICS® sectors, and after frequently observing the ups and downs of sectors as they gather mileage over the years, we all know what they “do.”

We also know sectors are globally relevant, immense in size and important to nearly every economic discussion and investment strategy. That’s why we continue to research their application, including in our recent paper: Natural Selection: Tactics and Strategy with Equity Sectors.

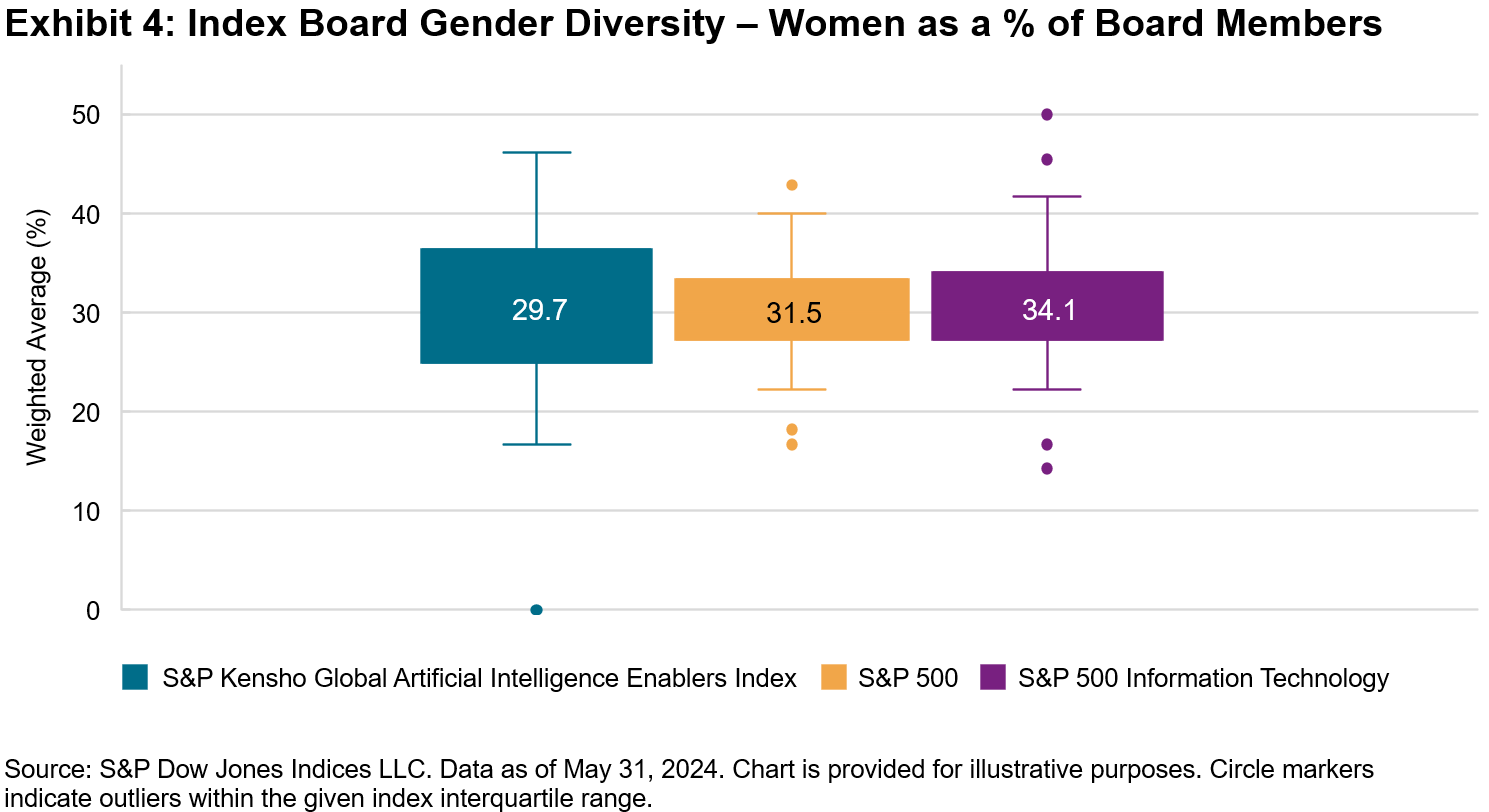
While the S&P 500’s USD 45 trillion total market cap reflects the U.S.’s position as the largest equity market in the world, individual S&P 500 sectors are also prominent, with many surpassing the total market cap of major single-country equity markets, as shown in Exhibit 1.

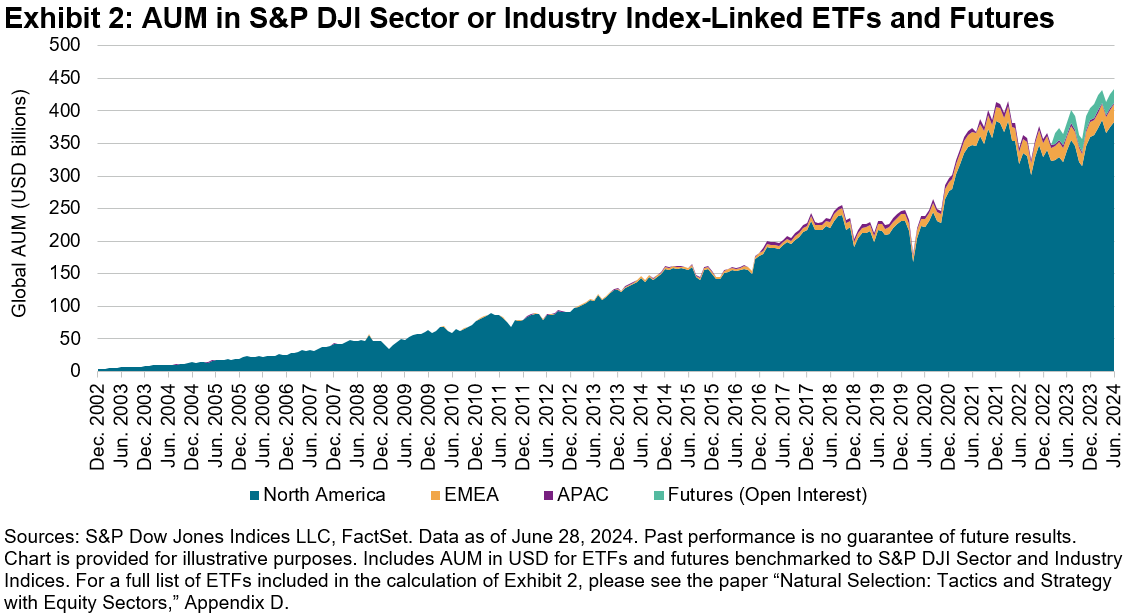
Since their inception, the use of S&P 500 Sector Indices as benchmarks for products has become increasingly widespread around the world. From the Middle East to the U.K., Japan and beyond, possible applications of S&P 500 sectors range from avoiding home bias and diversifying sector exposures to driving performance through tactical and strategic sector tilts. For evidence of the continuing growth of sector applications, one need not look further than the aggregate assets under management (AUM) in globally domiciled sector and industry index instruments (exchange-traded funds [ETFs] and futures), as shown in Exhibit 2.

Growth in sector assets could be a byproduct of investors worldwide understanding not only what each sector includes, but also how each sector historically tended to perform in different phases of the economic cycle. The differentiated holdings and low correlations of excess performance among sectors and industries has offered the possibility of seeking outperformance through sector tilting or rotation.

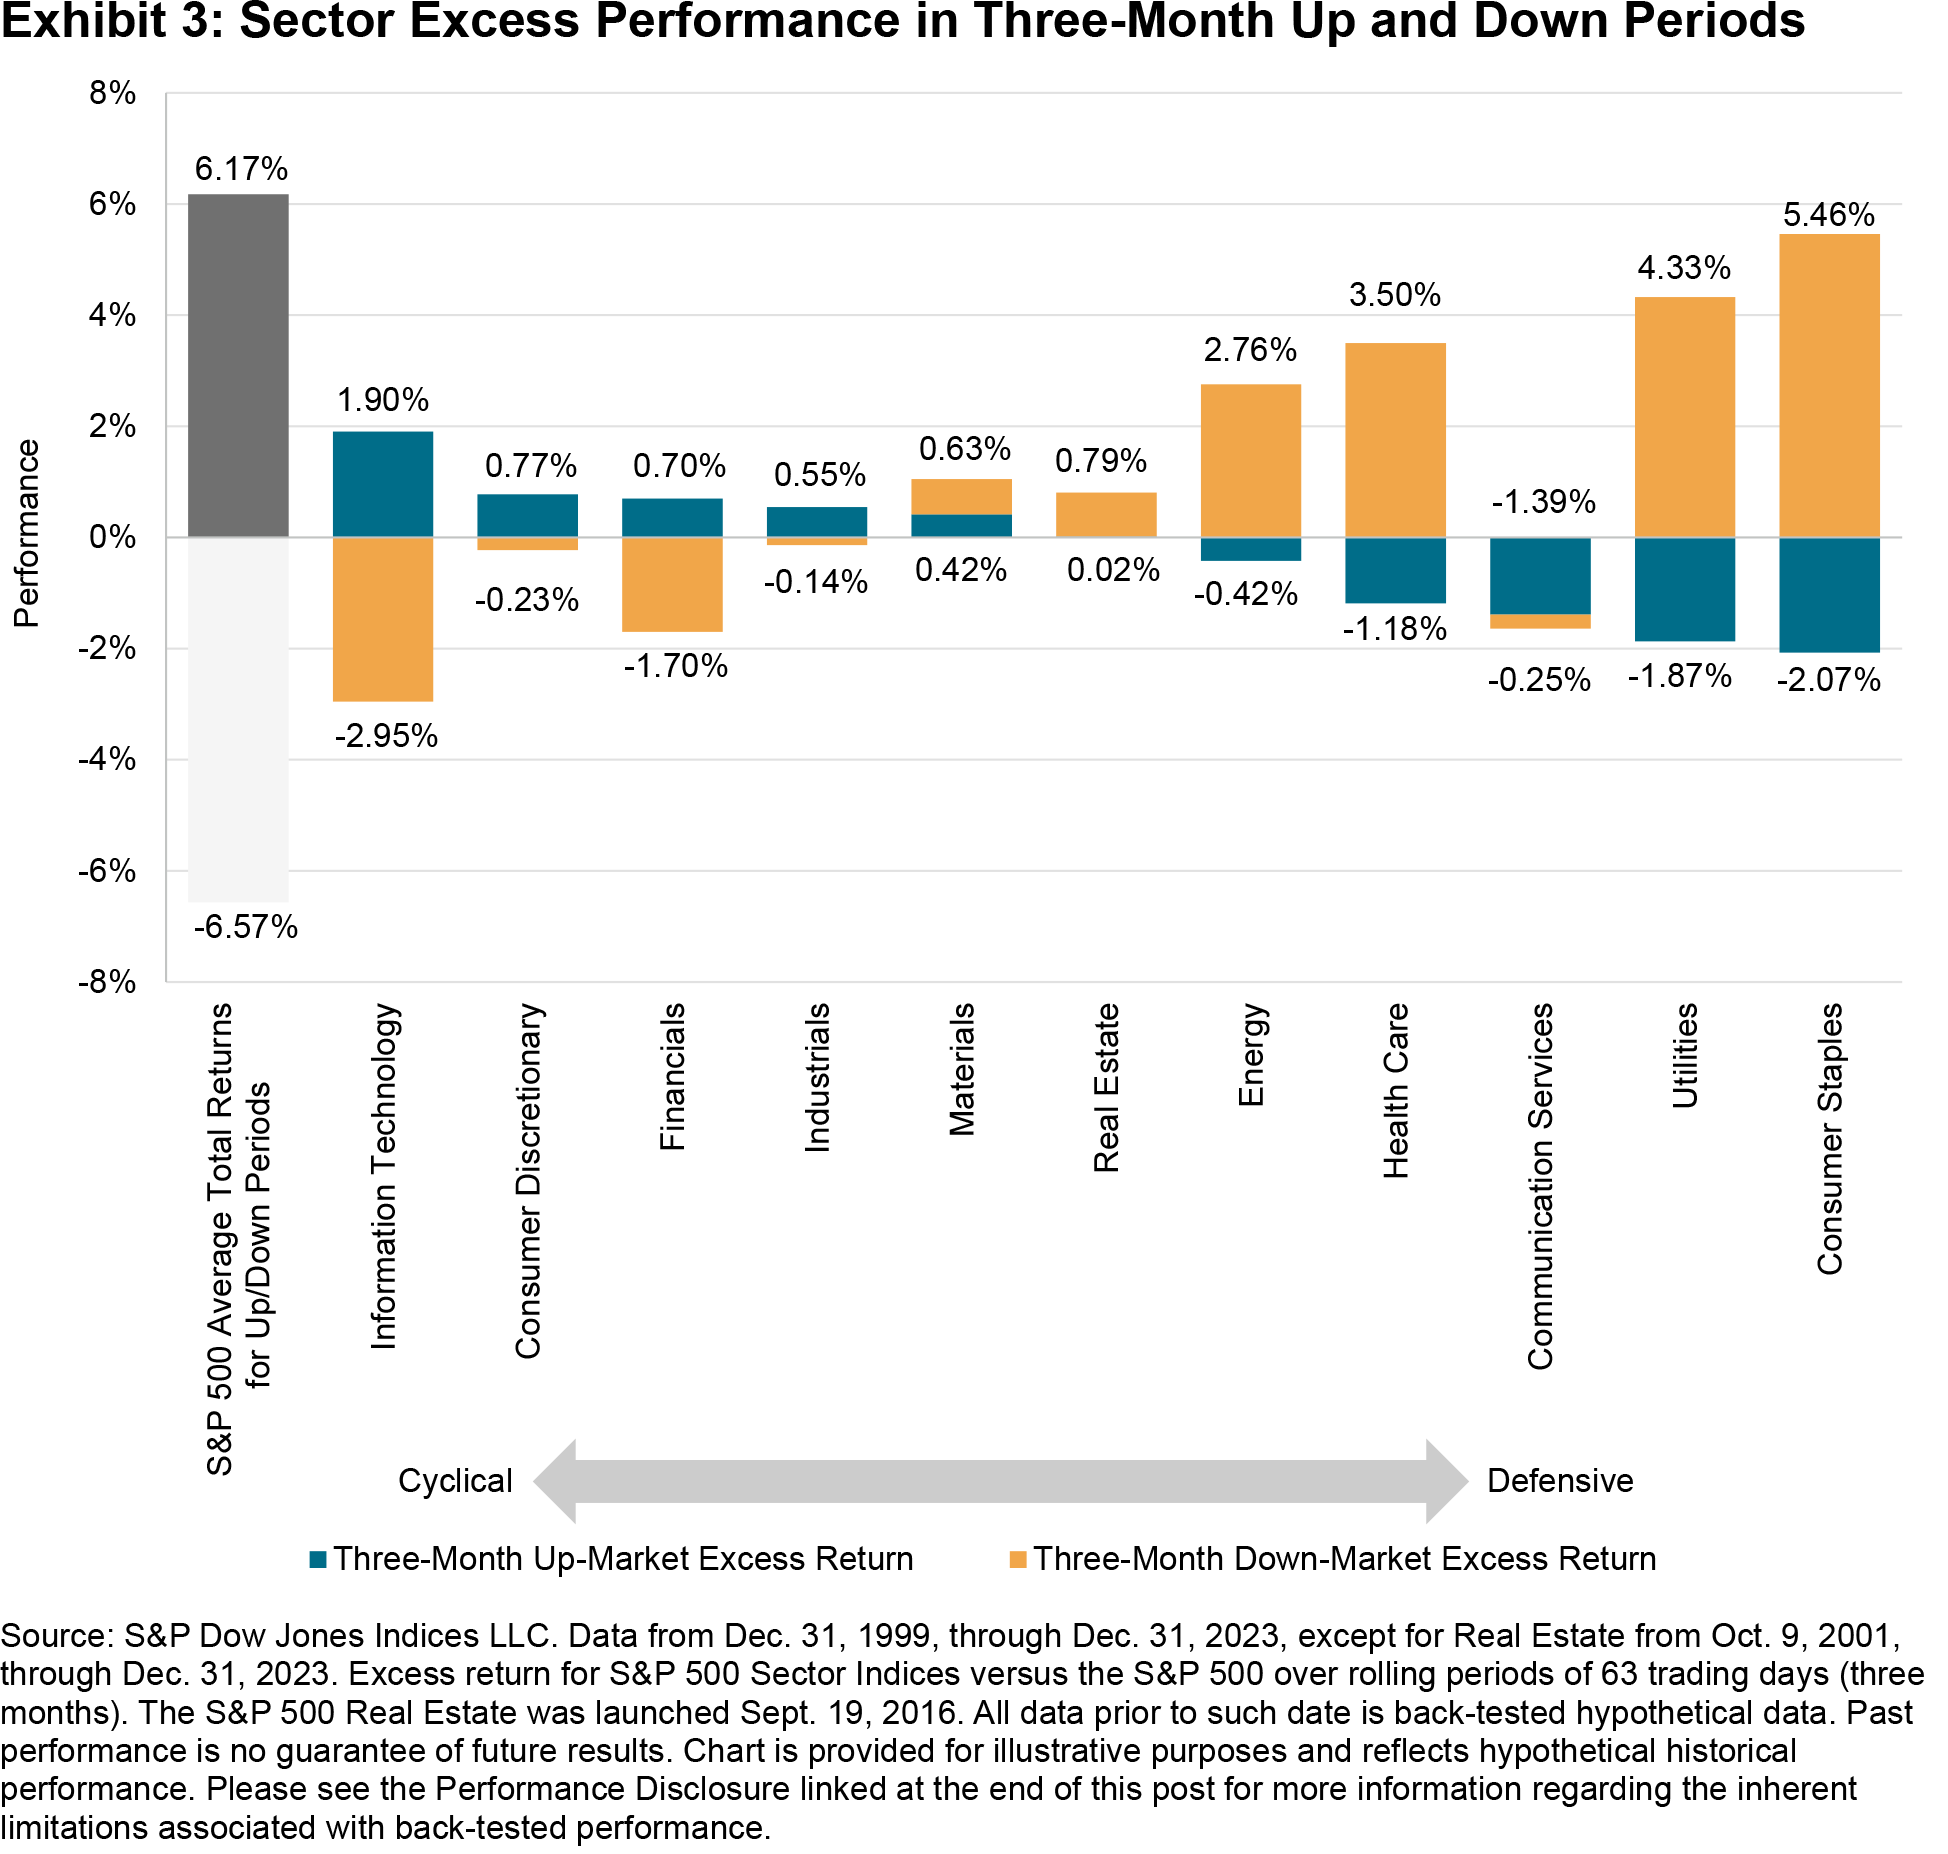
For example, categorization of sectors into cyclical groupings (those that have historically tended to exhibit higher beta and outperform during expansions) and defensive groupings (those that have tended to exhibit lower beta and outperform during declines) can also be effective. Categorizing sectors into defensive or cyclical groups based on ranking their risk attributes and their excess returns during rising or falling markets can offer insight into the potential outcome of sector tilts that historically achieve relatively better performance in each environment. Exhibit 3 illustrates this point, showing the average rolling three-month excess performance of S&P 500 sectors during periods when the S&P 500 was rising or falling.

While the eventual rise and fall of markets seems inevitable, no one can perfectly predict how much turbulence we’ll encounter during the journey. Fortunately, sectors are one tool to understand and navigate through whatever bumps are encountered along the way.

The posts on this blog are opinions, not advice. Please read our Disclaimers.

Where Shariah Meets ESG

Contributor Image
Maya Beyhan

Global Head of Sustainability, Index Investment Strategy

S&P Dow Jones Indices

There are parallels between Shariah and ESG principles, such as being a good steward to society and the environment. Having such overlapping and complementary principles has led to their natural pairing and a growing traction for ESG Shariah solutions around the globe. However, there is something that may be unexpected about these indices: even though they do not offer it by design, some ESG Shariah solutions can offer a strong temperature alignment. One such example is the S&P Pan Arab Composite ESG Shariah Capped Index (Custom).

This index is designed to measure the performance of the 40 companies with the highest-ranking ESG scores (as measured by the Corporate Sustainability Assessment [CSA] conducted by S&P Global Sustainable1), from 60 of the largest (by float-adjusted market capitalization) constituents of its benchmark, the S&P Pan Arab Composite Shariah Index.1

Based on its design, the S&P Pan Arab Composite ESG Shariah Capped Index (Custom) achieved an ESG score improvement of 3.94 against its benchmark, as of June 28, 2024. This is based on an aggregate score, however, and drilling further down into the underlying criteria for the environmental, social and governance pillars can give additional granularity on the index’s ESG performance. We identified three criteria, one for each pillar, for which most companies were assigned a score. The Environmental Policy & Management criterion in the “E” pillar refers to the management of an organization’s environmental programs in a comprehensive, systematic, planned and documented manner. Human Capital Development in the “S” pillar can make up a significant part of a company’s intangible assets, and for many industries, human capital development is one of the most financially material sustainability factors. On the other hand, the Business Ethics criterion evaluates the Codes of Conduct, their implementation and the transparent reporting on breaches, as well as corruption & bribery cases and anti-competitive practices. Exhibit 1 summarizes the change in ESG criteria for a given calendar year for the S&P Pan Arab Composite ESG Shariah Capped Index (Custom).

The S&P Pan Arab Composite ESG Shariah Capped Index (Custom) achieved a consistent improvement in each of the ESG criteria over the two years since its inception. The improvement of 12.0 in Human Capital Development criterion in the “S” pillar in 2023 particularly stands out.  Environmental Policy & Management was improved by 5.7 in 2022 since the index’s inception, followed by 2.8 in 2023. Business Ethics had a materially higher improvement in 2023, with 3.9 compared to only 0.1 in 2022.

Now, let’s put that unexpected trait of some ESG Shariah indices, which is not offered by their design, under the spotlight—i.e., a strong temperature alignment. The S&P Pan Arab Composite ESG Shariah Capped Index (Custom) is not explicitly designed to target improved temperature alignment (a transition pathway assessment that examines the adequacy of emission reduction over time to meet a 2°C carbon budget). However, as of June 28, 2024, it achieved a 1.5°C alignment and was 9% under its 2°C carbon budget, versus the S&P Pan Arab Composite Shariah, its benchmark, which was 7% over budget and was 3°C aligned.2 Furthermore, the S&P Pan Arab Composite ESG Shariah Capped Index (Custom) improved the carbon intensity3 and fossil fuel reserves4 by 45% and 51%, respectively, against its benchmark.

Given the superior sustainability profile that the index exhibited, we calculated its weighted average impact ratio, which is the index-weighted total direct and indirect external costs as a percentage of revenues. The external cost is an estimate of the value of a service based on the cost of damage that results from its loss. It is based on the assumption that the cost of maintaining an environmental benefit is a reasonable estimate of its value. Exhibit 2 illustrates the environmental footprint of the index from a sectoral perspective and compares it against its benchmark.

The S&P Pan Arab Composite ESG Shariah Capped Index (Custom) achieved an impact ratio improvement of 41.07% versus its benchmark. The largest contribution came from Utilities, which had an allocation effect of 35%. The Utilities sector is 4°C aligned and, together with Energy, is one of the main detractors from the carbon budget. The index was, on average, 2.86% underweight in Utilities since its inception. This contributed positively to its relative impact ratio performance.

Going beyond the ESG score improvement that is implied in its index construction, the S&P Pan Arab Composite ESG Shariah Capped Index (Custom) achieved a strong sustainability profile, even though its design does not offer it. It would be interesting to see if this observation continues, as it might help to shed more light on the parallels between Shariah and ESG principles.

1 For more information, please see the S&P Custom Indices Methodology.

2 In a previous analysis, we had a similar observation for another broad ESG index.

3 Based on weighted average carbon intensity (metric tons of CO2e/USD million revenues) using direct plus first tier indirect emissions.

4 Fossil fuel reserves: The carbon footprint that could be generated if the proven and probable fossil fuel reserves owned by index constituents were burned per USD 1 million invested.

The posts on this blog are opinions, not advice. Please read our Disclaimers.

Exploring Fixed Income’s Passive Potential

Passive investing has historically been more associated with equities than with fixed income, but recent data indicates a change could be in the winds. S&P DJI’s Tim Edwards and Anu Ganti take a closer look at what’s driving the shift and what a passive transformation could mean for fixed income markets.

The posts on this blog are opinions, not advice. Please read our Disclaimers.

Using Innovative Tools to Dynamically Manage Risk

Advances in volatility-based benchmarking have paved the way for the development of innovative tools for dynamically managing risk. Meet the S&P 500 Futures Edge Volatility Index Series, the next generation of volatility management benchmarks.

The posts on this blog are opinions, not advice. Please read our Disclaimers.

The Ethics of Artificial Intelligence

Contributor Image
Dasha Selivanova

Former Quantitative ESG Analyst, Index Investment Strategy

S&P Dow Jones Indices

The ever-evolving artificial intelligence (AI) landscape has generated excitement, interest and investment; it has also triggered important questions regarding AI’s impact on businesses, on investment portfolios, on society and on the environment. When factoring in elements such as the high energy requirements of training large language models (LLMs), direct and indirect emissions and the diversity of typical AI company boardrooms, the intersection of AI technology with environmental and governance concerns highlights a complicated ethical landscape. Access to robust datasets becomes critical to measure and assess the likely answers to these questions.

Indices can play a major role in revealing deeper insights about specific industries or investment themes such as AI. Offering a comprehensive perspective on companies involved in the space, the S&P Kensho Global Artificial Intelligence Enablers Index1 (S&P Kensho Global AI Enablers), was launched in October 2023 and currently comprises 37 companies at the forefront of developing and enabling AI technologies (see Exhibit 1).

In part due to rising demand for AI-optimized servers, voice technologies, data centers and more, the S&P Kensho Global AI Enablers Index has outperformed the S&P Global BMI Information Technology (Sector) and the S&P 500® since its launch (see Exhibit 2).

As the spotlight brightens on AI’s potential, questions about sustainability have also come under scrutiny. While ESG metrics do not equate to ethics, they do offer valuable insights into the consequences of AI companies’ business practices. As measured using S&P Global ESG Scores, overall, the S&P Kensho Global AI Enablers Index currently holds lower “E,” “S” and “G” scores than the S&P Global BMI Information Technology (Sector), S&P TMI Information Technology and S&P 500 Information Technology (see Exhibit 3).

Looking more closely at the Governance score, the S&P Kensho Global AI Enablers Index scored worse on the Board Gender Diversity metric, with a weighted average of only 30% women on AI constituent boards. In some cases, there are no women at all. This index’s average is lower than that of the notoriously male-dominated U.S. tech sector. However, the lower average doesn’t tell the whole story. In fact, gender diversity scores in the AI index are highly dispersed and highlight that there are a number of companies that do relatively well on this metric compared to other indices (see Exhibit 4).

Many AI companies also differ from their benchmarks on environmental metrics. Notably, training AI may not burn fossil fuels directly, but it can take a lot of computing power (and hence energy), potentially via a third party (e.g., cloud computing services). Along with market convention, S&P Global Trucost’s carbon data set breaks down corporate emissions into Scope 1, Scope 2 and Scope 3. Scope 1 includes direct carbon emissions from owned sources; Scope 2 includes indirect emissions from purchased electricity; and Scope 3 emissions involve all other indirect emissions in the value chain that can be divided into upstream and downstream. Indirect emissions classified as Scope 3 upstream occur from supply chain activities such as procurement and logistics, and Scope 3 downstream emissions stem from product use (see Exhibit 5).

In addition to the emissions data, S&P Global also provides data on temperature alignment. While carbon intensity measures current greenhouse gas emissions relative to economic value, the Temperature Alignment metric assesses how well a company’s emissions trajectories align with global temperature targets, such as 1.5°C or 2°C, thus focusing on long-term climate goals. This metric is key in assessing a company’s commitment and capability to mitigate climate risks, as well as its alignment with global climate goals.

Ultimately, the ethics and environmental impact of AI companies is nuanced, reflecting both extensive energy requirements and efforts to improve efficiency and sustainability, as well as the relative efficiency of AI-linked revenues. Indices such as the S&P Kensho Global Artificial Intelligence Enablers Index, and the data perspectives powered by S&P Global ESG Scores and climate data sets, can help market participants to not only understand how AI drives market performance, but also to assess its potential impact in a broader context.

1 The S&P Kensho Global Artificial Intelligence Enablers Index adopts a modified equal weighting scheme (with a overweight towards core companies where a significant portion of business operations and/or revenue are derived from products and services aligned with the theme).

The posts on this blog are opinions, not advice. Please read our Disclaimers.