Get Indexology® Blog updates via email.

In This List

Identifying Economic Moats Using a Quantitative Lens: The S&P 500 Economic Moat Index

New Bitcoin Indices Doing “Yard Work” in the Spring

Current Discounted Valuations & Historical Downside Protection: The S&P High Yield Dividend Aristocrats Index

A Hidden Stairway to Net Zero

How Are Some Dividend Growers Outpacing Inflation and the Benchmark?

Identifying Economic Moats Using a Quantitative Lens: The S&P 500 Economic Moat Index

Contributor Image
Rupert Watts

Head of Factors and Dividends

S&P Dow Jones Indices

Popularized by Warren Buffett, the term economic moat refers to a company’s sustainable competitive advantage that allows it to preserve market share and generate high profits over the long term. In this analogy, companies are compared to medieval castles surrounded by deep and wide moats, which protected the castles from attack.

In the same way, economic moats protect companies from competitors and other external threats by making it difficult for the competition to replicate or challenge their position in the market. There are several potential sources of an economic moat including network effects, economies of scale, strong brand recognition and high switching costs.

We believe that available financial statement metrics can be used to identify sustainable economic moats; furthermore, that a purely quantitative approach helps overcome the limitations of a subjective selection process. Earlier this year, S&P DJI launched the S&P 500® Economic Moat Index, which seeks to identify companies with lasting competitive advantages. In this blog, we will introduce this index by reviewing its methodology and historical performance.

Methodology Overview

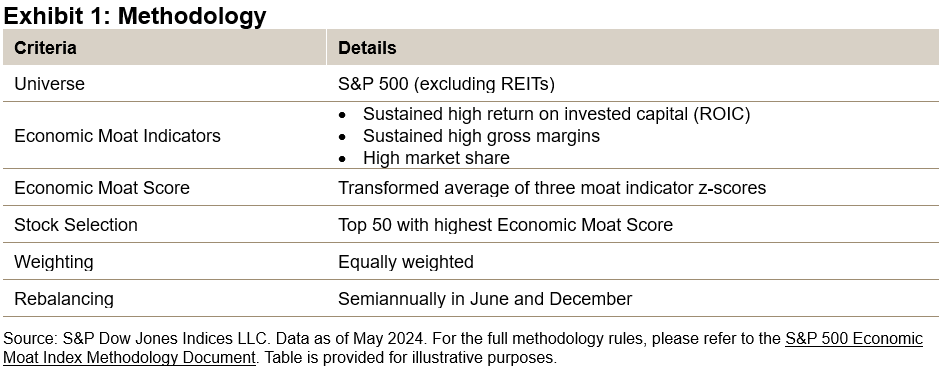
No single quantitative measure is the sole indicator of an economic moat. Instead, multiple metrics must be used with careful consideration as to how they complement one another. Our research identifies three core metrics by which companies should be assessed: high ROIC, high gross margins and high market share. We will examine each of these metrics more closely in a subsequent blog.

Consistency is another key aspect that should be considered when identifying economic moats. Many companies may be able to generate high returns in the short term, but the ability to do so on a consistent basis is indicative of a wide moat. Hence, the metrics should be analyzed over multiple periods.

The final selection is based on the average of these three Economic Moat Indicators, known as the Economic Moat Score. The top 50 companies are selected and then equally weighted to help avoid concentration risk and to place each company on equal footing.

Performance Review

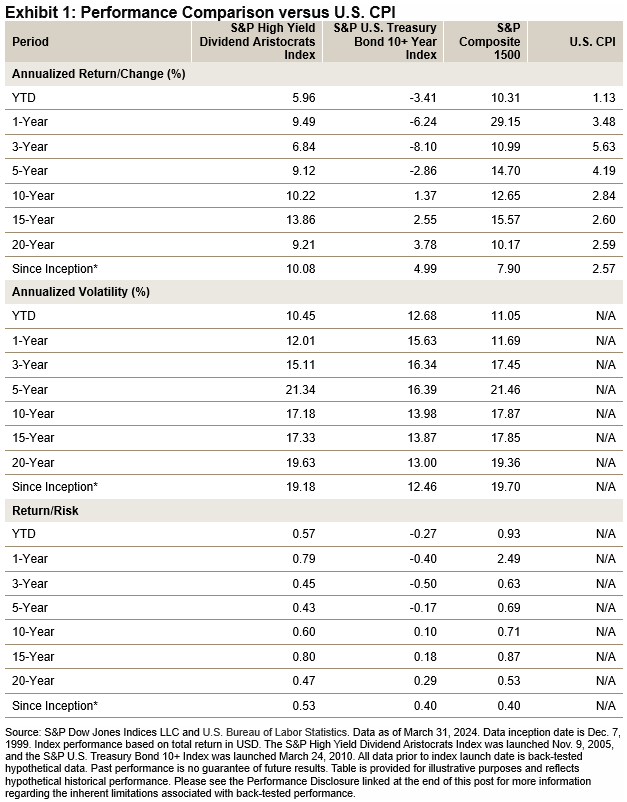
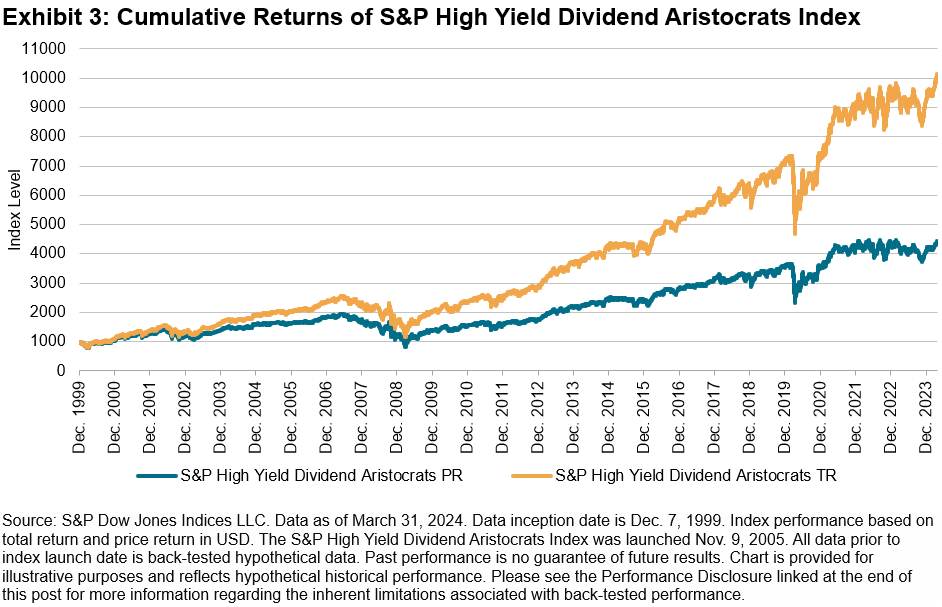
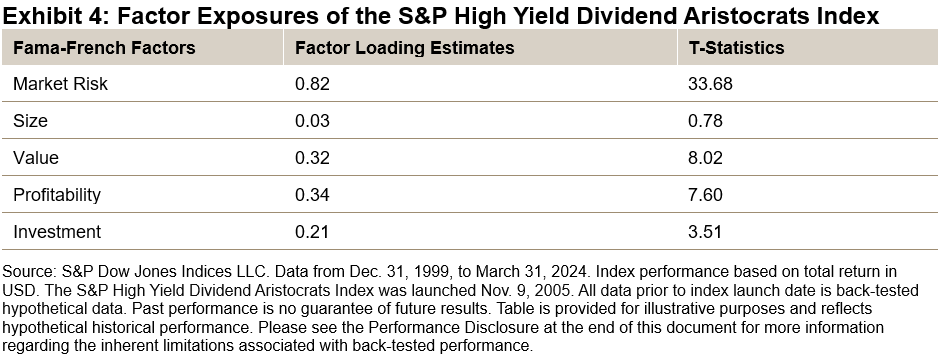
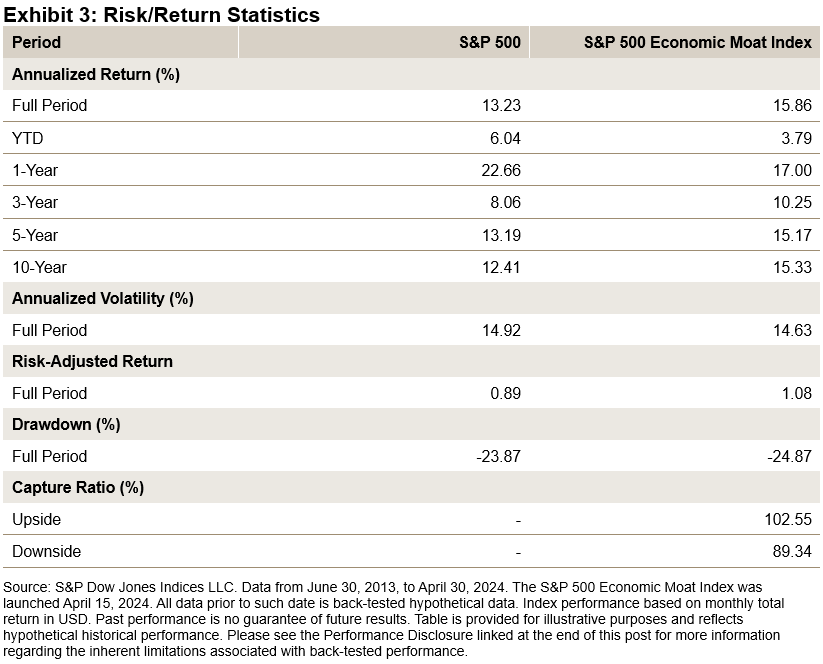
Back-tested data show that the companies with the widest economic moats generated significant outperformance since June 30, 2013 (see Exhibit 3). Over the full period, the S&P 500 Economic Moat Index outperformed the S&P 500 by 2.63% annualized.

Furthermore, the index has exhibited defensive characteristics as evidenced by its reduced volatility and downside capture. This is expected since companies with wide economic moats tend to be higher quality and better able to weather periods of market stress and uncertainty.

Historical Sector Weights

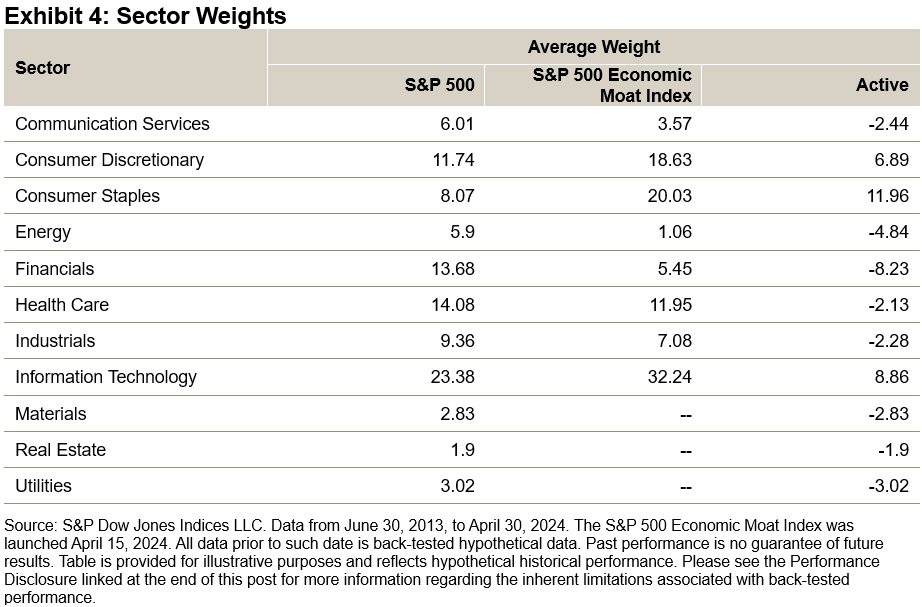
Let’s now examine the average sector weights in Exhibit 4. Historically, the S&P 500 Economic Moat Index has seen its largest sector overweights in Consumer Discretionary, Consumer Staples and Information Technology. Its most notable underweights have been in Energy and Financials.
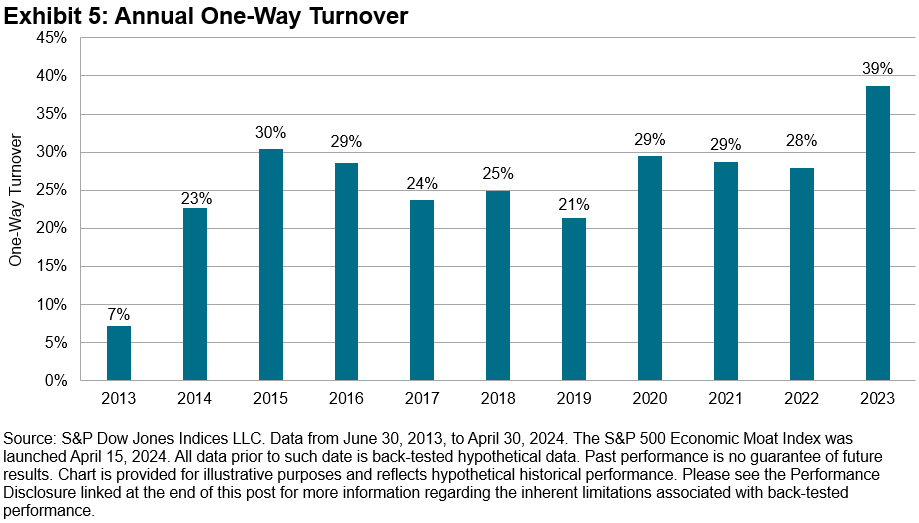
Historical Turnover

Let’s now review another compelling feature of this index: its low turnover. Across the full back-tested period, the index averaged 27.01% one-way turnover, which is low relative to other factor-based indices.

Conclusion

S&P Dow Jones Indices is pleased to continue its index innovation with the launch of this new index into our factor family. For those seeking to track high quality companies with a history of long-term outperformance and defensive characteristics, the S&P 500 Economic Moat Index may be an appealing option to consider. Please stay tuned for future blogs in this series that will delve into the individual economic moat indicators in greater detail.

The posts on this blog are opinions, not advice. Please read our Disclaimers.

New Bitcoin Indices Doing “Yard Work” in the Spring

Contributor Image
Brian Luke

Senior Director, Head of Commodities, Real & Digital Assets

S&P Dow Jones Indices

In Wall Street parlance, a yard refers to a billion and a buck is a million. You can overhear traders asking questions like, “how many bucks did that trade?” or, “did that company raise a yard?” The crypto space is gathering assets by the yard these days with new product launches by ETF issuers. For the most part, these products follow the simple price of a single cryptocurrency. New index-based solutions are coming to the market and are also gaining attention. The S&P CME Bitcoin Futures Daily Roll Index and the S&P 500 and S&P Bitcoin Futures 75/25 Blend Index are two examples of how indexing works in the crypto space.

Financialization of crypto in the ETF space has followed a similar pattern to that of the commodity markets. The first commodity ETF, launched in November 2004, tracks the simple price of gold and was groundbreaking for its innovation in allowing investors to gain direct exposure to the price of gold without the need to physically own or store the metal. Commodity investors then began tracking indices like the Dow Jones Commodity Index Gold that maintained continuous exposure to rolling futures contracts rather than the underlying commodity. These indices allowed the incorporation of new performance measures such as collateral return, as well as inverse and leverage performance. As the commodity market evolved, investors sought out broad-based commodity exposure, as measured by the S&P GSCI, which tracks 24 commodities and employs a production-weighting approach with monthly contract rolls.

Twenty years after the first gold ETF launched, Bitcoin followed suit. Also tracking the simple price of a single coin, new ground was broken in the space. Following these spot product launches came renewed interest in futures-based indices, whereby issuers can deploy leverage for added volatility (yes, more volatility) and use the S&P CME Bitcoin Daily Roll Index to track performance. The index rolls contracts on a daily basis leading up to the front month expiry. For the complete index methodology, see here. Performance of the futures index, which launched on Jan. 10, 2022, has tracked the S&P Bitcoin Index with a correlation of 0.995 with back-tested data to Dec. 28, 2017. For more information on back-tested performance, see the Performance Disclosure linked at the end of this post.

Another index that gets yards of attention is the S&P 500®. Combining the leading benchmark for U.S. equities with the recent market beating returns of Bitcoin has created quite a bit of buzz. The S&P 500 and S&P Bitcoin Futures 75/25 Blend Index maintains a market exposure to cryptocurrency alongside an allocation to the S&P 500. Index construction rules create the ability to maintain a dedicated exposure that performs a calendar-based rebalance, allocating between the S&P 500 and S&P CME Bitcoin Futures Index. For the complete index methodology, see here. By rebalancing back to a 25% weighting in the S&P CME Bitcoin Futures Index, this disciplined approach helps mitigate the risk of increasing concentration or reallocating to the underlying index during periods of market volatility, leading to a more diversified exposure.

The indexing landscape continues to evolve with emergent asset classes. One constant is the drive for transparent, rules-based approaches that provide simplified measurement and standard calculation. S&P DJI’s Index Mathematics Methodology guides our index solutions under the same principles the market has adopted as an industry standard. Maintaining benchmarks for over a century is yeoman’s work, but it’s a strategy that keeps the yardwork plentiful.

The posts on this blog are opinions, not advice. Please read our Disclaimers.

Current Discounted Valuations & Historical Downside Protection: The S&P High Yield Dividend Aristocrats Index

Contributor Image
George Valantasis

Associate Director, Factors and Dividends

S&P Dow Jones Indices

In our last blog, we highlighted the superior long-term performance of the S&P High Yield Dividend Aristocrats® versus the S&P Composite 1500®, as well as compared to long-term Treasury bonds and the CPI. In this blog, we will shift our focus to examine the current discounted valuations and enhanced dividend yields of the S&P High Yield Dividend Aristocrats Index versus the S&P Composite 1500. Moreover, this blog will examine the S&P High Yield Dividend Aristocrats Index’s historical track record of providing significant downside protection during periods of severe equity market drawdowns.

Valuation Comparison

Exhibits 1-5 show the current valuations versus the S&P Composite 1500 relative to history. As Exhibit 1 shows, on a price-to-book, price-to-sales, price-to-earnings and composite basis (simple average of the three metrics), the S&P High Yield Dividend Aristocrats Index is trading at a 22.4%, 38.3%, 20.7% and 27.1% discount, respectively, as of March 28, 2024. Although not as high as the approximately 40% composite discount set back in September 2020, it is still in the 81st percentile of cheapness relative to history.

As Exhibit 6 displays, the S&P High Yield Dividend Aristocrats Index has always had a superior dividend yield versus the S&P Composite 1500. Although this is expected given the methodology, it is important to note that the S&P High Yield Dividend Aristocrats Index’s 2.85% yield is more than double the benchmark’s 1.36% yield as of March 28, 2024.

Exhibit 7 shows the consistent downside protection that the S&P High Yield Dividend Aristocrats Index has provided during historic market drawdowns. It has outperformed in all drawdown periods shown, except for the COVID-19 drawdown when it underperformed by 1.9% over the course of one month. Notably, during other periods of elevated broad equity market valuations such as the unwinding of the tech bubble and the Fed pivot in 2022, the S&P High Yield Dividend Aristocrats Index outperformed by 76.4% and 14.7%, respectively. Across all periods, the S&P Composite 1500 returned an average of -20.2%, versus -6.9% for the S&P High Yield Dividend Aristocrats Index.

Conclusion

Given the prospect of lower interest rates amid the anticipated ending of the rate hike cycle, high yielding quality stocks may be positioned favorably as investors seek yield and defensive positioning. For investors who may be concerned about lofty broad equity market valuations and seek exposure to high yield quality stocks trading at a favorable discount relative to history, the S&P High Yield Dividend Aristocrats Index is an option to consider.

The posts on this blog are opinions, not advice. Please read our Disclaimers.

A Hidden Stairway to Net Zero

Contributor Image
Maya Beyhan

Senior Director, ESG Specialist, Index Investment Strategy

S&P Dow Jones Indices

“Yes, there are two paths you can go by, but in the long run
There’s still time to change the road you’re on.”

—Jimmy Page and Robert Plant

Many observers assume indices targeting broad ESG performance follow different paths than those delivering climate-focused temperature alignment. In reality, data show that modern indices can often achieve both objectives, helping investors to stride confidently down a single path of sustainability.

The S&P/B3 Brazil ESG Index measures the performance of securities meeting sustainability criteria and weights constituents based on companies’ ESG performance resulting from the Corporate Sustainability Assessment (CSA) conducted by S&P Global Sustainable1.1

The index is not explicitly designed to target improved temperature alignment (a transition pathway assessment that examines the adequacy of emission reduction over time in meeting a 2°C carbon budget). However, it does address net zero energy transition objectives by applying exclusionary screenings based on business activities including thermal coal mining, coal-powered electricity generation, fossil fuel extraction and/or production using oil sands. Furthermore, under the environmental pillar of S&P Global ESG Scores, including criteria such as climate strategy and environmental policy and management, the index integrates financially relevant climate risks and opportunities.

Even without an explicit temperature alignment target, S&P DJI’s Q1 2024 Sustainability Index Dashboard shows the S&P/B3 Brazil ESG Index achieved 1.5°C alignment and was 65% under its 2°C carbon budget versus the S&P Brazil BMI, which was 38% under. Such a significant result is typically only achieved in sophisticated climate indices with explicit temperature alignment targets like the S&P PACT™ Indices (S&P Paris-Aligned & Climate Transition Indices).

Exhibit 1 summarizes the sectoral contribution of the S&P/B3 Brazil ESG Index to its -65% under 2°C carbon budget status compared to the S&P Brazil BMI. A negative percentage signifies a sector’s carbon emissions are under budget, while a positive percentage indicates its carbon emissions are over budget.

Materials was the largest contributor (-53%) to achieving -65% under 2°C carbon budget, followed by Consumer Discretionary (-17%). Energy, Consumer Staples and Utilities detracted 5% total from the carbon budget. Similarly, for the S&P Brazil BMI, Materials and Consumer Discretionary led the achievement of -38% under the 2°C carbon budget, with -35% and -24%, respectively. But these contributions were countered by Energy (13%) and Utilities (7%).

As technological developments meet sustainability considerations, the global energy system is experiencing a profound transformation. Considering the S&P/B3 Brazil ESG Index’s strong temperature alignment, we evaluated types of energy generated by constituent companies (see Exhibit 2).

Impressively, 97% of energy generated by the S&P/B3 Brazil ESG Index constituents came from renewable sources compared to 88% for the S&P Brazil BMI. Only 2% of generated energy came from fossil fuels, including natural gas. This is also reflected in the index’s 82% improvement in fossil fuel reserves compared to the S&P Brazil BMI, according to S&P DJI’s Q1 2024 Sustainability Index Dashboard.

The S&P/B3 Brazil ESG Index’s strong temperature alignment and energy transition outcomes could make it an interesting option for investors with multiple sustainability considerations in mind.

1 For more information, please see the S&P/B3 Indices Methodology.

The posts on this blog are opinions, not advice. Please read our Disclaimers.

How Are Some Dividend Growers Outpacing Inflation and the Benchmark?

Contributor Image
Wenli Bill Hao

Director, Factors and Dividends Indices, Product Management and Development

S&P Dow Jones Indices

With the 10-year U.S. Treasury yield hovering around 4.5%, investors may be able to find attractive yields without taking on too much risk. The challenge, however, is maintaining purchasing power relative to inflation (USD 1,000 in December 1999 was only worth USD 538 as of March 2024). For those seeking income and total returns that have historically kept pace with or exceeded inflation, high quality dividend strategies may be appealing.

With almost 20 years of live history, the S&P High Yield Dividend Aristocrats Index tracks companies in the S&P Composite 1500® that have consistently increased their total dividends per share annually for at least 20 consecutive years.1 In this blog, we will examine the historical dividend growth and risk and return statistics for this index and highlight how it tends to track higher quality companies.

Dividend Growth, Performance and Inflation

Historically, the S&P High Yield Dividend Aristocrats Index has tracked companies that have grown their dividends at a rate that has exceeded inflation over the long term. From 2000 to 2023, its dollar dividends grew at a compound annual growth rate of 4.96%, easily beating the Consumer Price Index (CPI)2 over the same period.

Given that income-oriented investors may view long-term bonds and high dividend yielding stocks as substitutes, it is important to note that the S&P U.S. Treasury Bond 10+ Year Index has lagged the CPI over the last 15 years with just a 2.55% annualized return. Meanwhile, the S&P High Yield Dividend Aristocrats Index generated an annualized return of 13.86% over the same period in addition to outperforming the CPI for all periods studied. Lastly, it has significantly outperformed its benchmark, the S&P Composite 1500, over the full period.

Long History of Dividend Increases and Dividend Growth

The constituents in the S&P High Yield Dividend Aristocrats Index have long histories of increasing their dividends. All constituents are required to have a minimum of 20 years of dividend increases to be included in the index, and some have a history of increasing dividends for 60 years or more (see Exhibit 2). These track records demonstrate these companies’ historically consistent ability and willingness to return increasing amounts of shareholder capital across different market regimes.

Importance of Dividends and the Compounding Effect

The benefits of a dividend growth strategy include compounding growth of dividends per share, compounding reinvested dividends and share price appreciation. From Dec. 31, 1999, to March 31, 2024, the S&P High Yield Dividend Aristocrats Index generated a total return of 915.47% and price return of 344.83% (see Exhibit 3). The difference (570.64%) between the total return and price return is due to the contribution of dividends.

Factor Exposure

In Exhibit 4, we used the Fama-French Five-Factor Model3 to dissect the historical returns of the S&P High Yield Dividend Aristocrats Index. From the factor loading estimates and associated t-statistics, we can see that the index constituents had positive exposures to lower beta, higher value, higher operating profitability and more conservative investment growth. The empirical results show that the constituents had better quality and valuation characteristics than the overall market. High-quality fundamentals form the foundation for consistent dividend increases.

Summary

As our analyses above demonstrate, the S&P High Yield Dividend Aristocrats Index has stood the test of time when it comes to providing dividend growth that has outpaced inflation, as well as outperformance of its broad benchmark. In an upcoming blog, we will take a more tactical perspective and examine how the S&P High Yield Dividend Aristocrat Index is currently positioned due to its relative valuations versus the S&P Composite 1500.

1   For further information about the index, please see the S&P High Yield Dividend Aristocrats Methodology.

2   U.S. Bureau of Labor Statistics, Consumer Price Index for All Urban Consumers, retrieved from FRED, Federal Reserve Bank of St. Louis; https://fred.stlouisfed.org/series/CPIAUCSL, April 10, 2024.

3   Fama, E. and K. French. “Dissecting Anomalies with a Five-Factor Model.” The Review of Financial Studies, Volume 29, Issue 1, 2016, pp. 69-103.

The posts on this blog are opinions, not advice. Please read our Disclaimers.