


Meet the S&P 500 RavenPack AI Index, a multi-asset index that applies a news analytics algorithm powered by RavenPack to select S&P 500 sectors with the strongest news sentiment for use in its sector rotation process. The index combines U.S. equities and fixed income, complemented by a daily risk control mechanism that seeks to maintain a target volatility of 5%.
The posts on this blog are opinions, not advice. Please read our Disclaimers.Using the News to Select a More Stable Path to the S&P 500
Energy Pumps up the S&P GSCI and Markets Go Cuckoo for Cocoa
Getting to Know the S&P 500 in Hong Kong
Meet the S&P 500 Dynamic Intraday TCA Index
The S&P 500 Low Volatility Index: Currently Valued at the 99th Percentile of Cheapness Relative to the S&P 500
Using the News to Select a More Stable Path to the S&P 500
- Categories Multi-Asset
- Tags AI, daily risk control, Equity, FIAs, fixed income, Fixed Indexed Annuities, GICS sectors, machine learning, multi-asset, news sentiment, RavenPack, risk control, S&P 500 RavenPack AI Index, S&P 500 RavenPack AI Sentiment Index, S&P 500 Sectors, sector rotation, target volatility
Energy Pumps up the S&P GSCI and Markets Go Cuckoo for Cocoa

“I think it’s from all those dog-gone cocoa beans. Hey, by the way, did you guys know that chocolate contains a property that triggers the release of endorphins? Gives one the feeling of being in love.” -Willy Wonka, Charlie and the Chocolate Factory (2005)
Inflation presented a direct hit to consumers at the pump, with gasoline futures moving in near lockstep with oil. Petrol prices from crude, gasoil and gasoline rose 16%, 17% and 18% YTD, respectively. The S&P GSCI All Crude, which makes up over 42% of the broad index, is trading at a six-month high on the back of production cuts by OPEC+. These cuts offset yet another record in U.S. crude oil production, according to the Energy Information Administration. Strong petroleum performance led the S&P GSCI to an 10.4% YTD return, a solid start that perhaps is overshadowed only by the S&P 500® at all-time highs. At S&P Global’s recent CERAWeek event, leading commodity market participants engaged in discussions ranging from energy transition to geopolitics. Nickel is at the center of both, due to its importance as a primary metal for electric vehicles. Indonesia accounts for over half of nickel production and is pushing for an OPEC+ style cartel to manage future supply. The S&P GSCI Nickel continues to lag the broader commodity market, down 6.7% for the month and 33% lower over the past year.
Cocoa futures hit an all-time high as a perfect storm fueled prices. Poor weather in West Africa’s prime cocoa growing region continues to be ravaged by El Niño weather patterns. Crop yields dropped over 10% due to extreme rain, then drought, in 2023. This acutely impacted growing regions beset by ageing trees near the end of their fruit bearing life and further strained by black pod disease, a fungus killing cocoa trees. Chocolate demand driven by Easter holidays in the west pushed demand expectations to 370 thousand tons more than the 2024 supply, according to the International Cocoa Organization. Pricing surged beyond USD 10,000 per ton and were up 147% on the year.
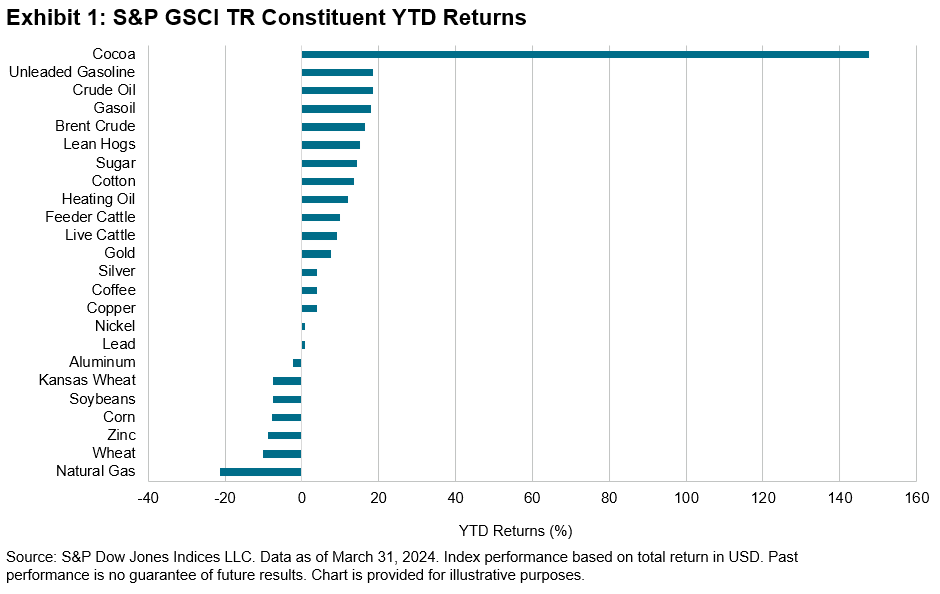
Gold is another commodity hitting record highs this month. The perceived safety of gold continues to attract assets in an environment dominated by war, political upheaval and central bankers balancing inflationary concerns against continued economic growth. Unlike its digital upstart Bitcoin, gold has been transported across political borders for millennia, acting as a hedge against global economic uncertainty. This century, gold continues to outpace the S&P 500, with an average annual total return of 8% for the Dow Jones Commodity Index Gold compared to 7.4% for the S&P 500.
The posts on this blog are opinions, not advice. Please read our Disclaimers.Getting to Know the S&P 500 in Hong Kong
Why is the S&P 500 relevant to markets around the world? Take a closer look at this iconic index with S&P DJI’s Priscilla Luk and Hang Seng Investment Management’s Yvonne Ngai, including its role in our daily lives and some key highlights about why the S&P 500 is widely regarded as the best single gauge of U.S. large-cap equities.
The posts on this blog are opinions, not advice. Please read our Disclaimers.Meet the S&P 500 Dynamic Intraday TCA Index
Combining a trend-following mechanism with the ability to rebalance up to 13 times during the trading day, this innovative multi-asset index seeks to provide a more stable volatility experience by leveraging the next generation of risk control technology.
The posts on this blog are opinions, not advice. Please read our Disclaimers.The S&P 500 Low Volatility Index: Currently Valued at the 99th Percentile of Cheapness Relative to the S&P 500

Investor enthusiasm for AI and mega-cap technology stocks has propelled the S&P 500® to a gain of more than 30% over the past 12 months. As the S&P 500 has been reaching new highs on a regular basis, it is understandable if low volatility stocks have not been at the top of investors’ minds. This blog will serve as a reminder of just how effective the S&P 500 Low Volatility Index has been at delivering defensive qualities and superior risk-adjusted returns over the long term. Furthermore, we will examine the S&P 500 Low Volatility Index’s historically attractive current relative valuations, solid profitability, enhanced dividend yields and, perhaps unnoticed, significantly higher growth versus the S&P 500 in recent years.
Defensive Qualities and Superior Risk-Adjusted Returns
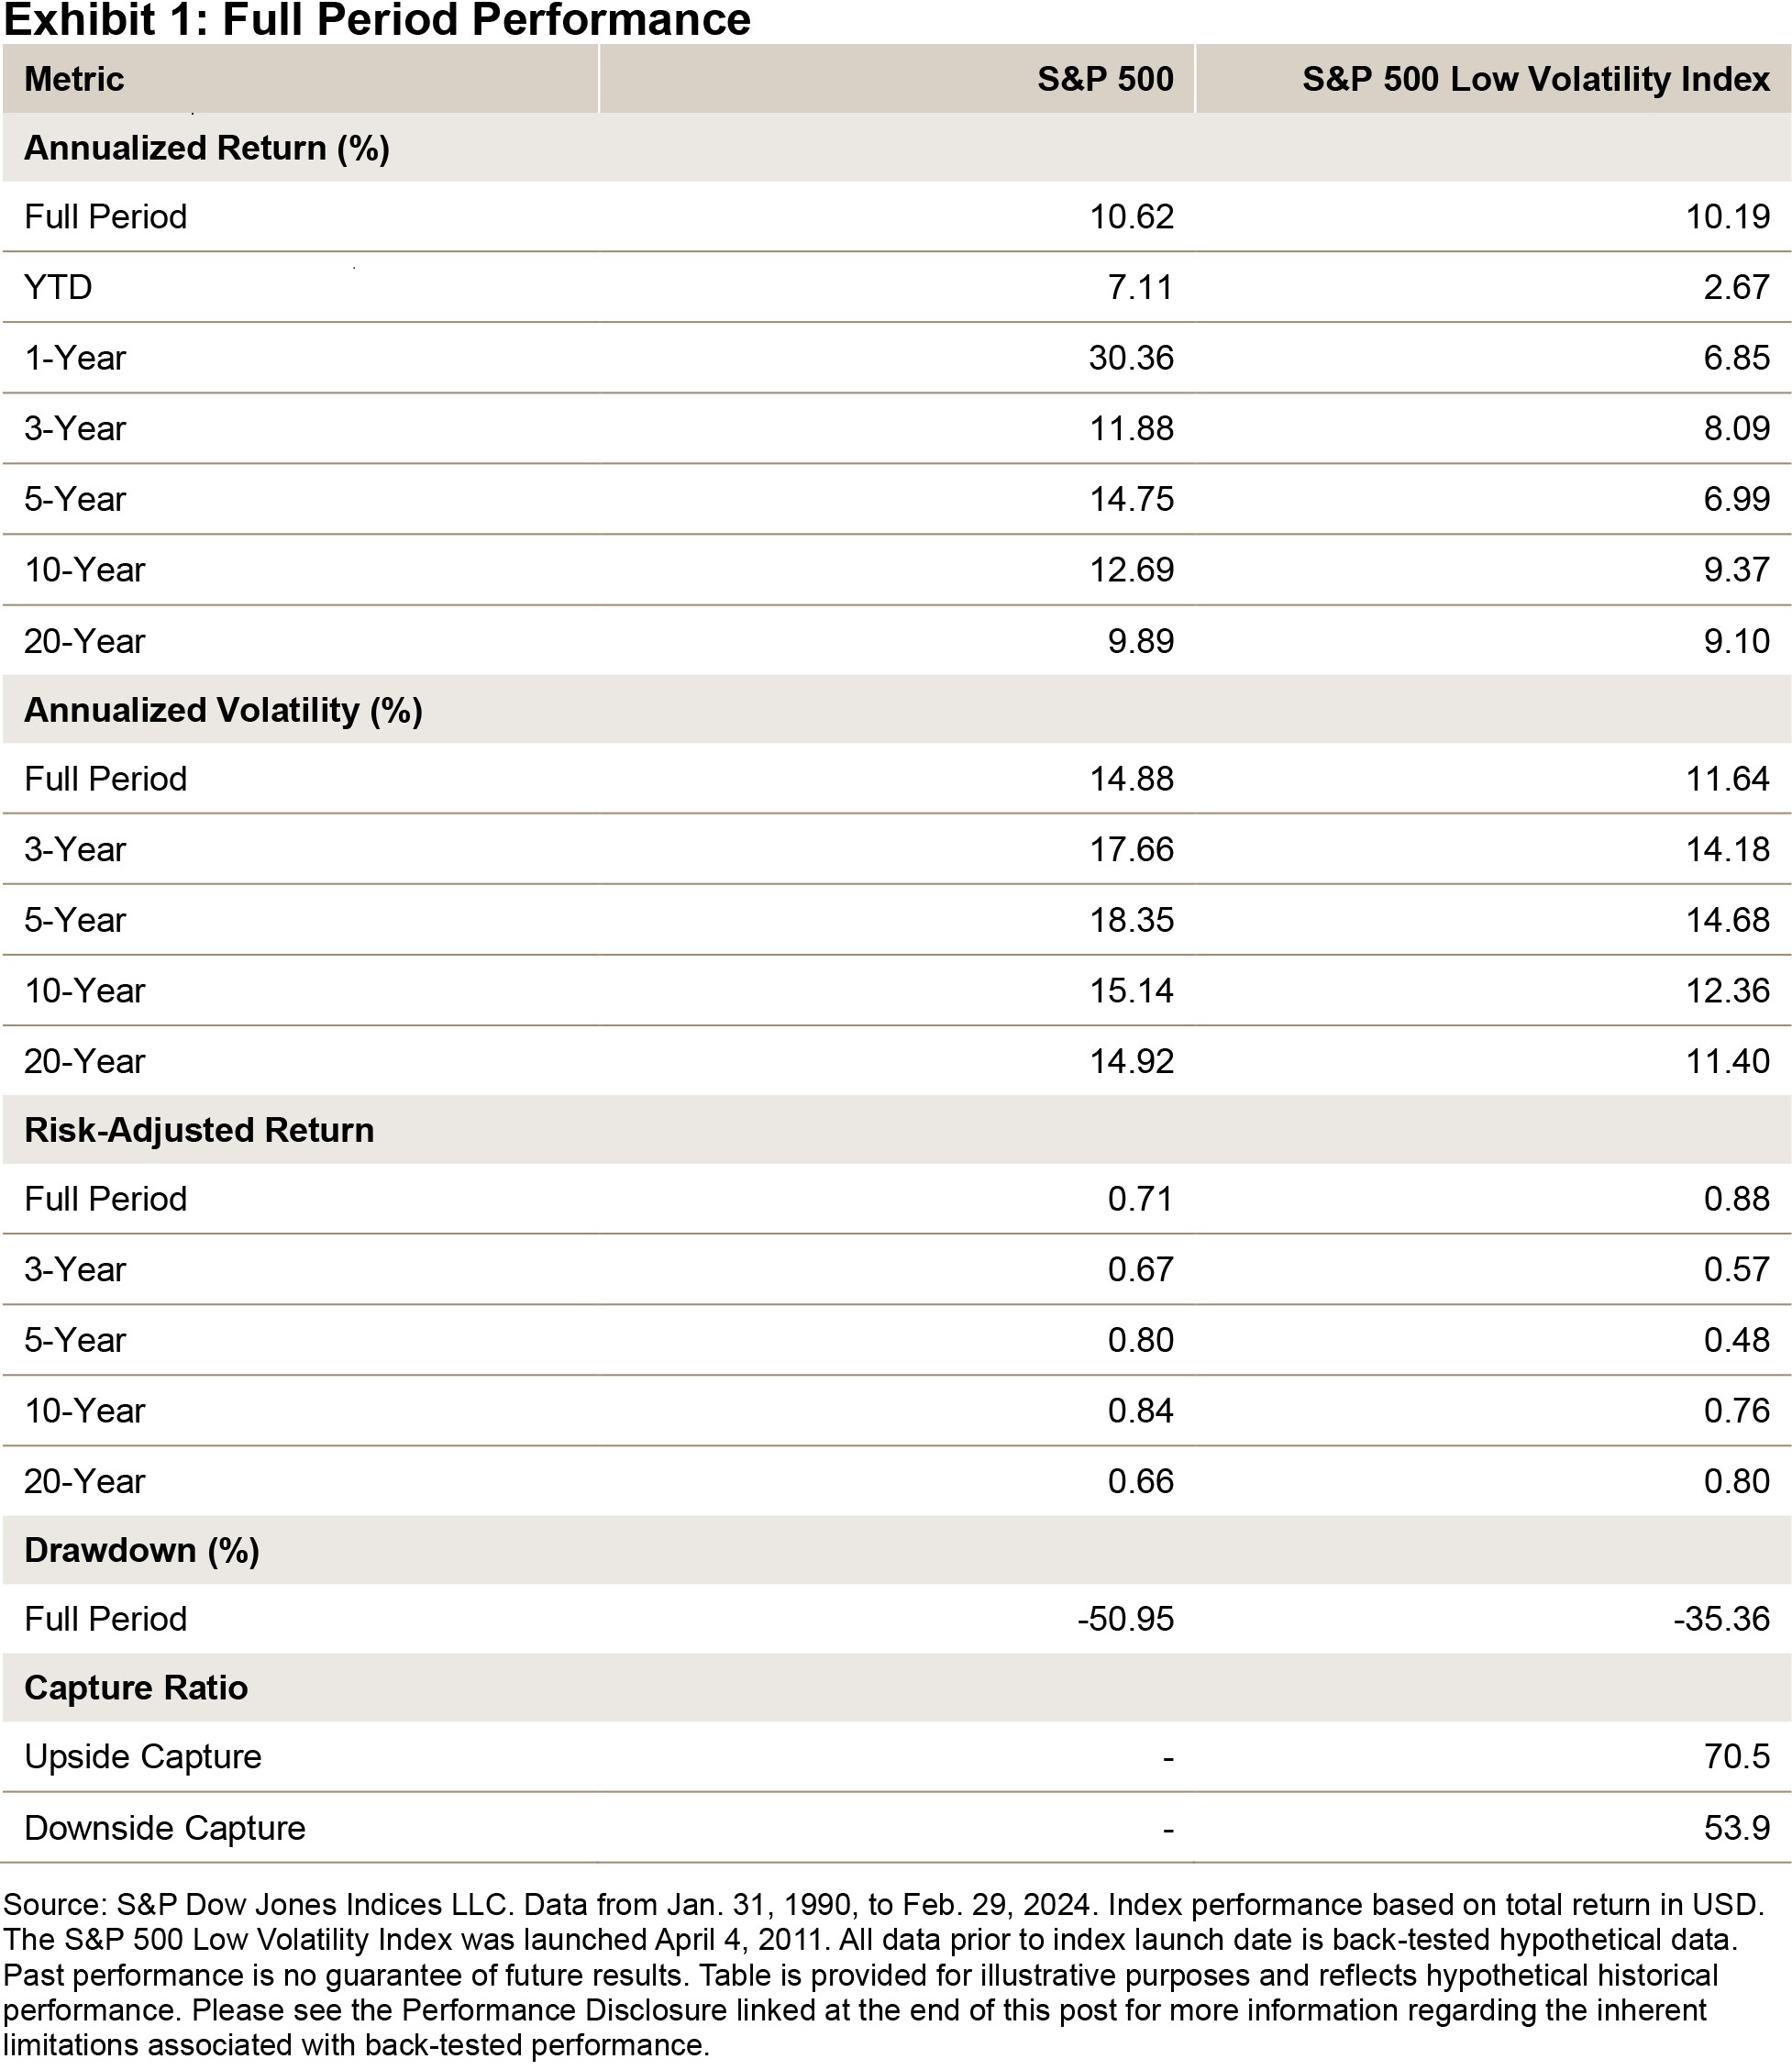
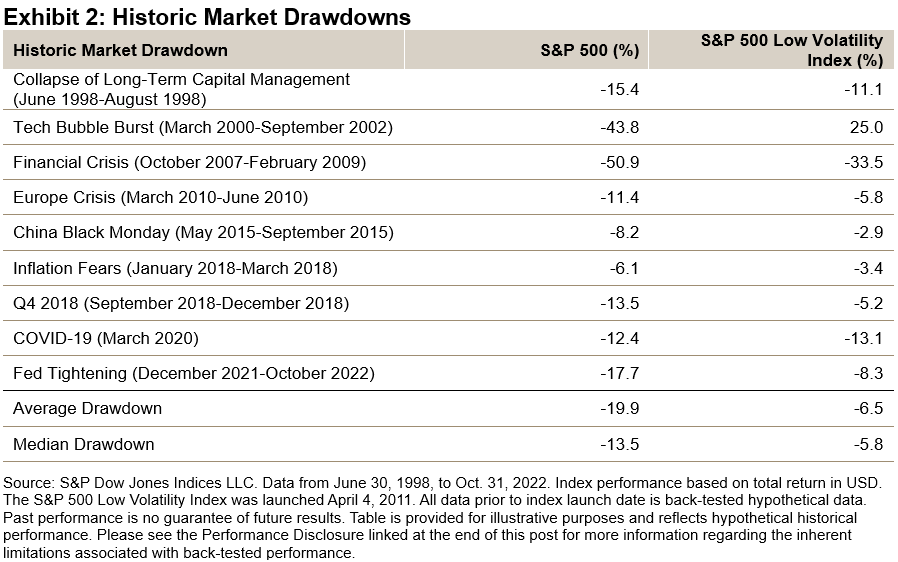
Exhibit 2 displays the consistent downside protection that the S&P 500 Low Volatility Index has provided during historic market drawdowns. It has outperformed in all drawdown periods shown except for the COVID-19 drawdown, when it underperformed by 0.7% over the course of one month. During these periods, the S&P 500 returned an average of -19.9%, versus -6.5% for the S&P 500 Low Volatility Index. Notably, during the tech bubble burst drawdown, the S&P 500 declined 43.8%, versus a gain of 25.0% for the S&P 500 Low Volatility Index, translating to an outperformance of 68.8%.
S&P 500 Low Volatility Is Currently Valued at the 99th Percentile of Cheapness Relative to the S&P 500
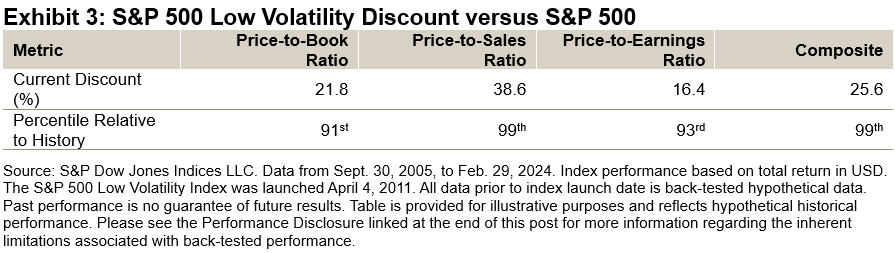
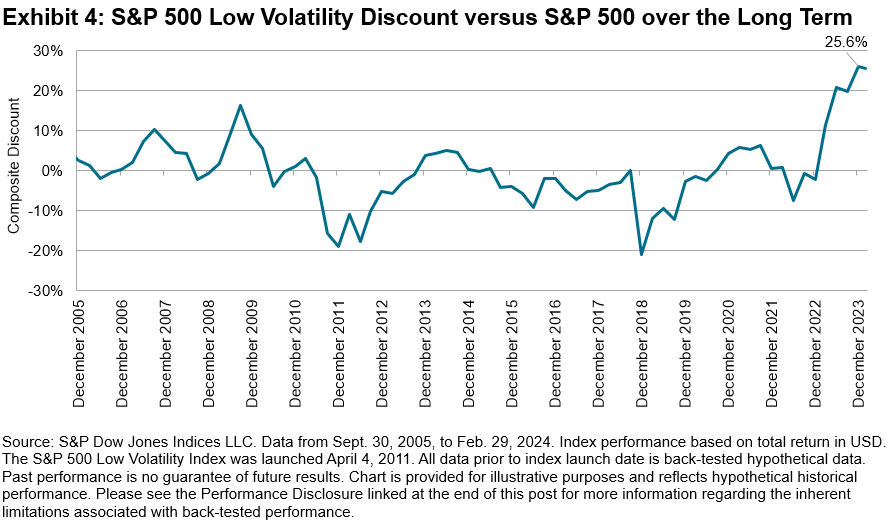
Exhibits 3 and 4 show the historically attractive current valuation discount of the S&P 500 Low Volatility Index relative to the S&P 500. On a price-to-book, price-to-sales and price-to-earnings ratio, as well as on a composite basis (i.e., a simple average of the three metrics), the S&P 500 Low Volatility Index currently trades at a 21.8%, 38.6%, 16.4% and 25.6% discount, respectively. As Exhibits 3 and 4 both indicate, the 25.6% composite discount places the index in the 99th percentile of cheapness relative to the S&P 500 going back to September 2005.
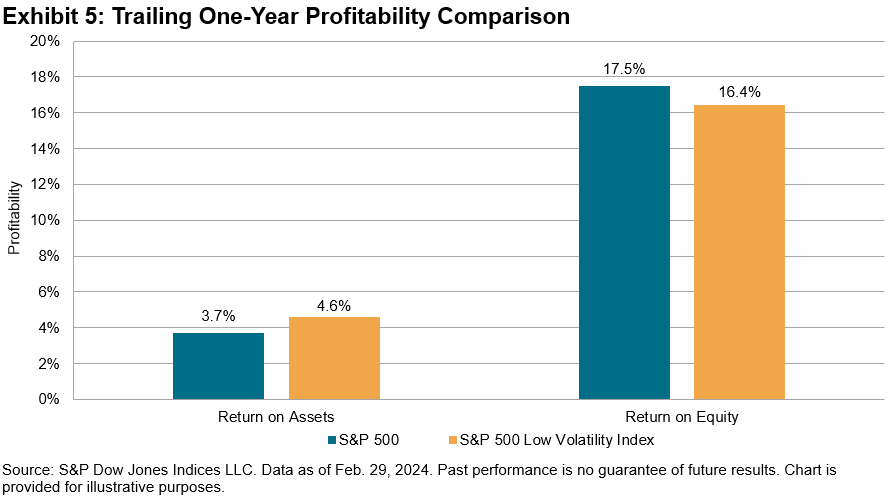
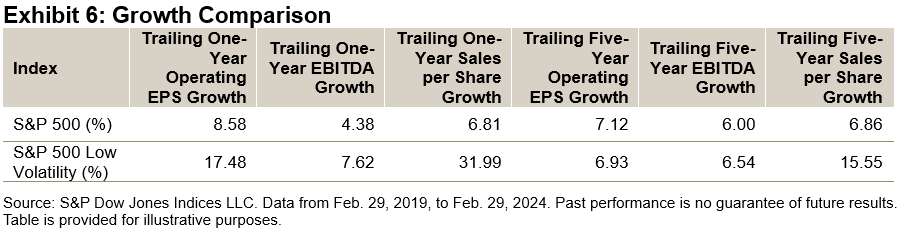
Exhibit 5 compares the return on assets and return on equity of the indices, while Exhibit 6 compares the trailing one- and five-year growth metrics. It is interesting to note that, over the past 12 months, the S&P 500 Low Volatility Index was on par with the S&P 500 from a profitability perspective, in addition to demonstrating materially higher earnings and sales growth over the trailing one- and five-year periods.
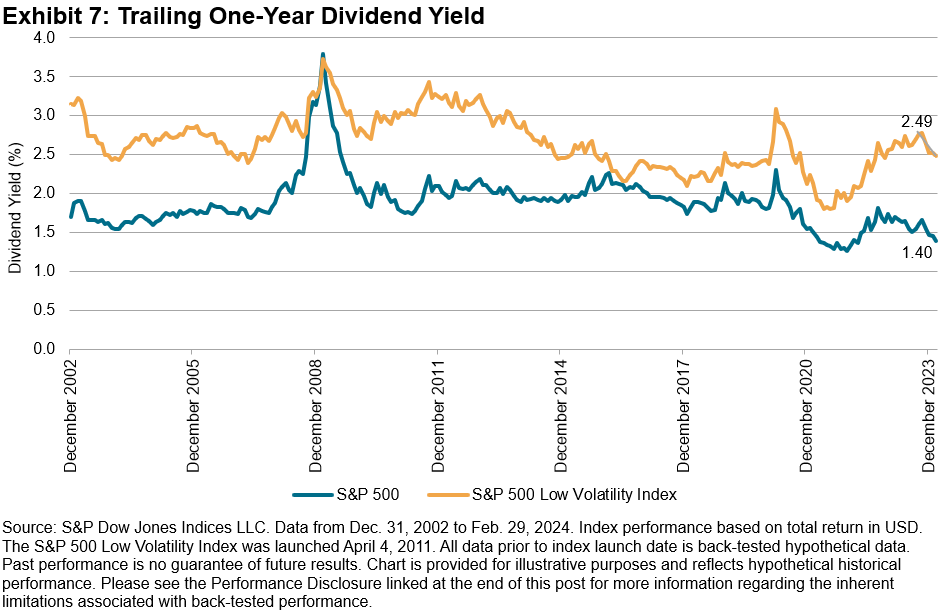
As Exhibit 7 shows, the S&P 500 Low Volatility Index has typically had a superior dividend yield versus the S&P 500 over the long term. Recently however, the dividend yield spread has materially widened to 1.09%, a result of the S&P 500 Low Volatility Index yielding 2.49%, versus the S&P 500 yielding 1.40%. The current dividend yield spread is in the 87th percentile going back to December 2002.
Conclusion
Over the long term, the S&P 500 Low Volatility Index has historically provided investors with superior risk-adjusted returns relative to the S&P 500. Although recent performance has lagged the S&P 500, it has come at a time when the S&P 500 Low Volatility Index has demonstrated similar profitability and significantly higher growth versus the S&P 500. For market participants who are hesitant about lofty valuation multiples but want exposure to solid fundamental performance and enhanced dividend yields, the S&P 500 Low Volatility Index may be an option to consider.
The posts on this blog are opinions, not advice. Please read our Disclaimers.