Underperformance of many active managers against their broad market benchmarks has been well documented.1 However, we thought it would be interesting to apply this comparison specifically to the dividend market. In this blog, we will examine how the S&P 500® Dividend Aristocrats® stacks up against actively managed U.S. equity income funds.
Recognized as one of the most prominent dividend indices, the S&P 500 Dividend Aristocrats follows a simple but stringent metric to select constituents.2 To be eligible for inclusion, companies must be a member of the S&P 500 and have raised dividends for a minimum of 25 consecutive years. These companies tend to exhibit stable earnings, solid fundamentals and strong histories of profitability and growth. The index includes 67 companies as of June 2023.
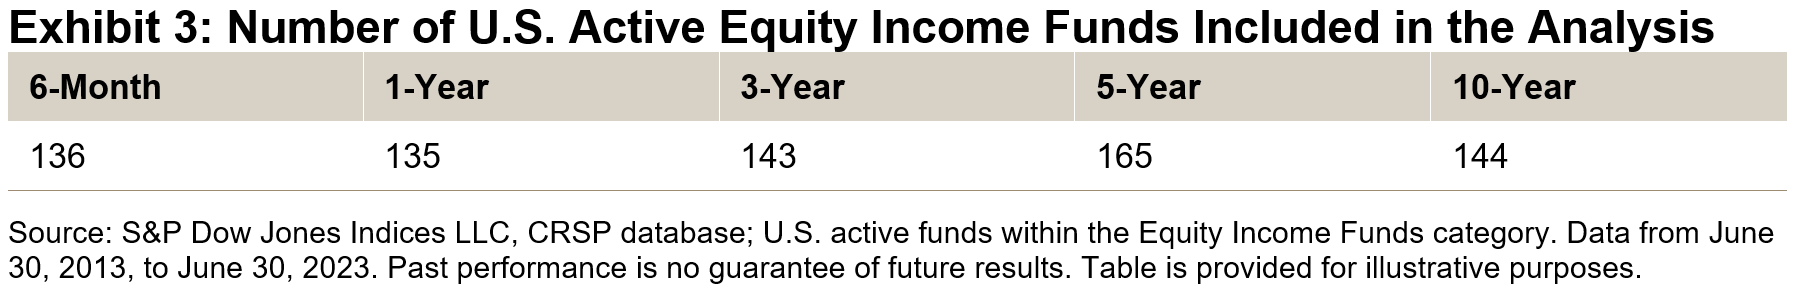
The funds used in our analysis are sourced from the CRSP database within the Equity Income Funds category. The analysis was conducted using the same methodology and underlying analytical engine used to produce S&P DJI’s semiannual SPIVA® U.S. Scorecards.
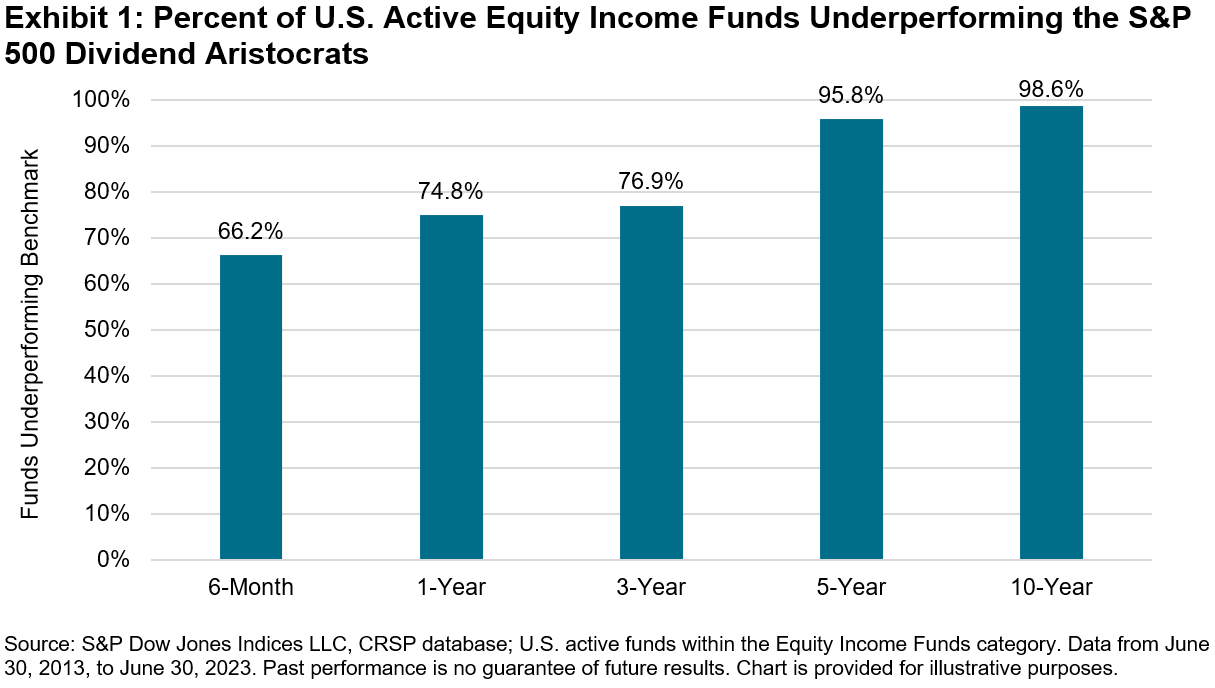
As seen in Exhibit 1, the S&P 500 Dividend Aristocrats has proven difficult to beat, with over 98% of U.S. active managers underperforming the index over the past 10 years. Furthermore, it has outperformed the majority of active managers across all time periods measured.
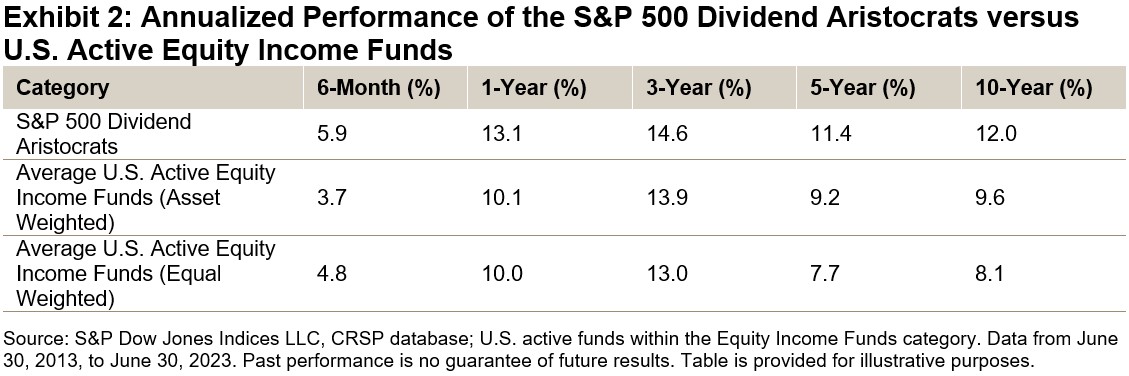
The performance analysis is similarly striking. Exhibit 2 shows how the average annualized return of these U.S. active equity income managers (calculated two ways) compares across different time periods. Over the 10 years ending June 2023, the performance of the S&P 500 Dividend Aristocrats has been an impressive 12.0% annualized—outperforming by a wide margin.
Conclusion
The track record of significant outperformance is yet another reason why the S&P 500 Dividend Aristocrats is an iconic dividend index. This simple but rigorous methodology has not only proved difficult for most active equity income managers to beat, but it has also made it a standout among its passive peers.
The author would like to thank Davide Di Gioia, Chief SPIVA Engineer, for his contribution to this analysis.
1 See our SPIVA Scorecards for more information on the active vs. passive debate.
2 See index methodology for more information.
The posts on this blog are opinions, not advice. Please read our Disclaimers.