


How do you measure the dividend risk premium on the S&P 500 and why does it make sense to track with an index? S&P DJI’s Michael Mell takes a custom look at indexing dividend futures with Metaurus Advisors’ Rick Silva, and Compass Point Financial’s Andrew Jones.
The posts on this blog are opinions, not advice. Please read our Disclaimers.Examining the Dividend Risk Premium
Net-Zero Targets and Temperature Alignment: Two Sides of the Same Coin?
What Performance Reversals Suggest
GICS Changes Are Approaching
Surveying Style Indices
Examining the Dividend Risk Premium
Net-Zero Targets and Temperature Alignment: Two Sides of the Same Coin?

For many people, a new year represents a chance to set new objectives and to tick (or scrap) the previous year’s list of resolutions. Whether this objective-setting exercise works is debatable. A similar phenomenon might be observed within companies. Scientific consensus maintains that net-zero emissions should be reached by 2050 if the world is to keep warming levels below 1.5°C, aligned with the goals of the Paris Agreement. As such, an increasing number of companies, countries and investment actors have been setting climate-related targets, which comprise one of the four pillars of the recommendations put forward by the Task Force on Climate-related Financial Disclosures (TCFD).1
Net-Zero Targets: From Commitment to Action
The Science-Based Targets Initiative (SBTI) is one of the leading organizations when it comes to supporting companies in setting and validating credible targets. To be validated by SBTI, targets must cover relevant emissions’ scopes, as well as being time-bounded and specific.2
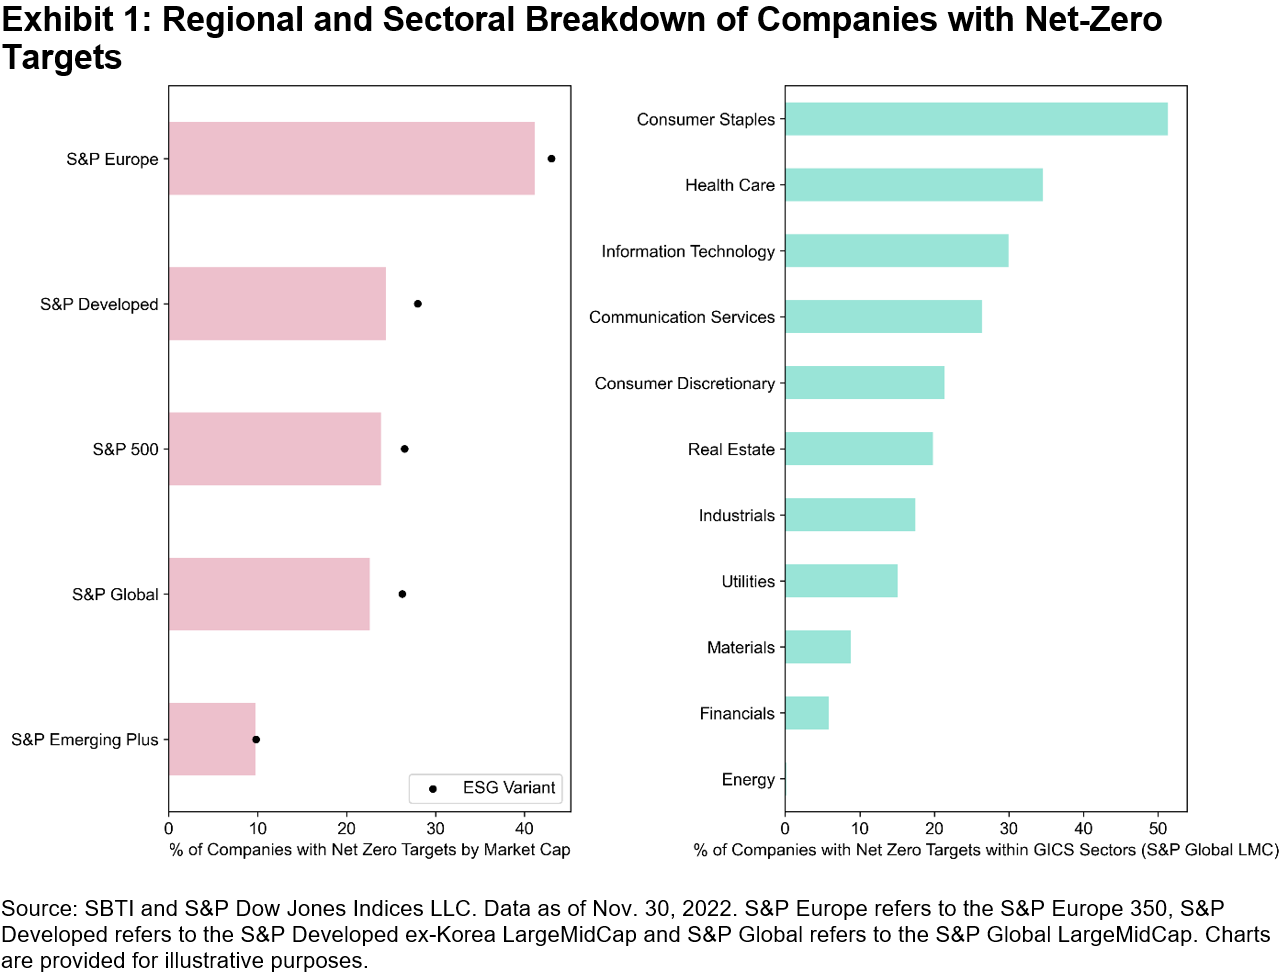
From a regional standpoint, Europe is leading the way when it comes to corporate net-zero target setting, with more than 40% of companies by market cap having set a target within the S&P Europe 350®, while around a quarter of S&P 500® companies have done so (see Exhibit 1). All S&P ESG Index counterparts to the assessed universes have a higher percentage of companies with net-zero targets (see left-hand chart). From a sectoral lens, more than half of Consumer Staples’ companies have a verified target, with almost none in Energy being able to do so, due to fossil fuel involvement (see right-hand chart).3
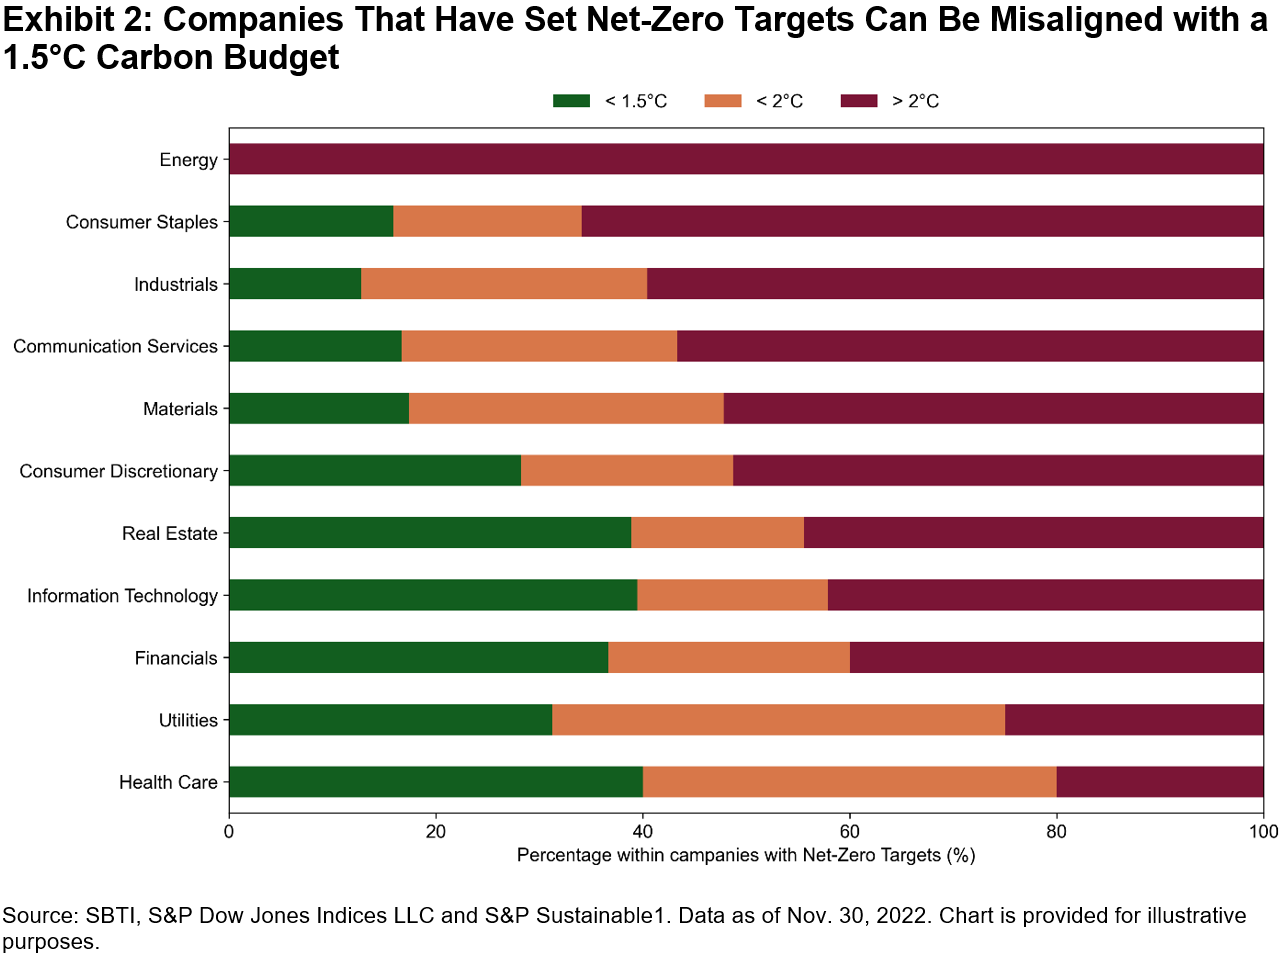
But is corporate target setting indicative of alignment with the goals of the Paris Agreement? Intuitively, one could expect that companies that have set net-zero targets are more likely to be on a 1.5°C trajectory through relative or absolute decarbonization efforts. However, these might just be two sides of the same coin. While targets indicate commitment (or even ambition), S&P Global temperature alignment models compare historical and forward-looking projected emissions to a specified carbon budget.4 Thus, even companies with net-zero targets might be aligned with a >2°C pathway by the end of the century (see Exhibit 2).
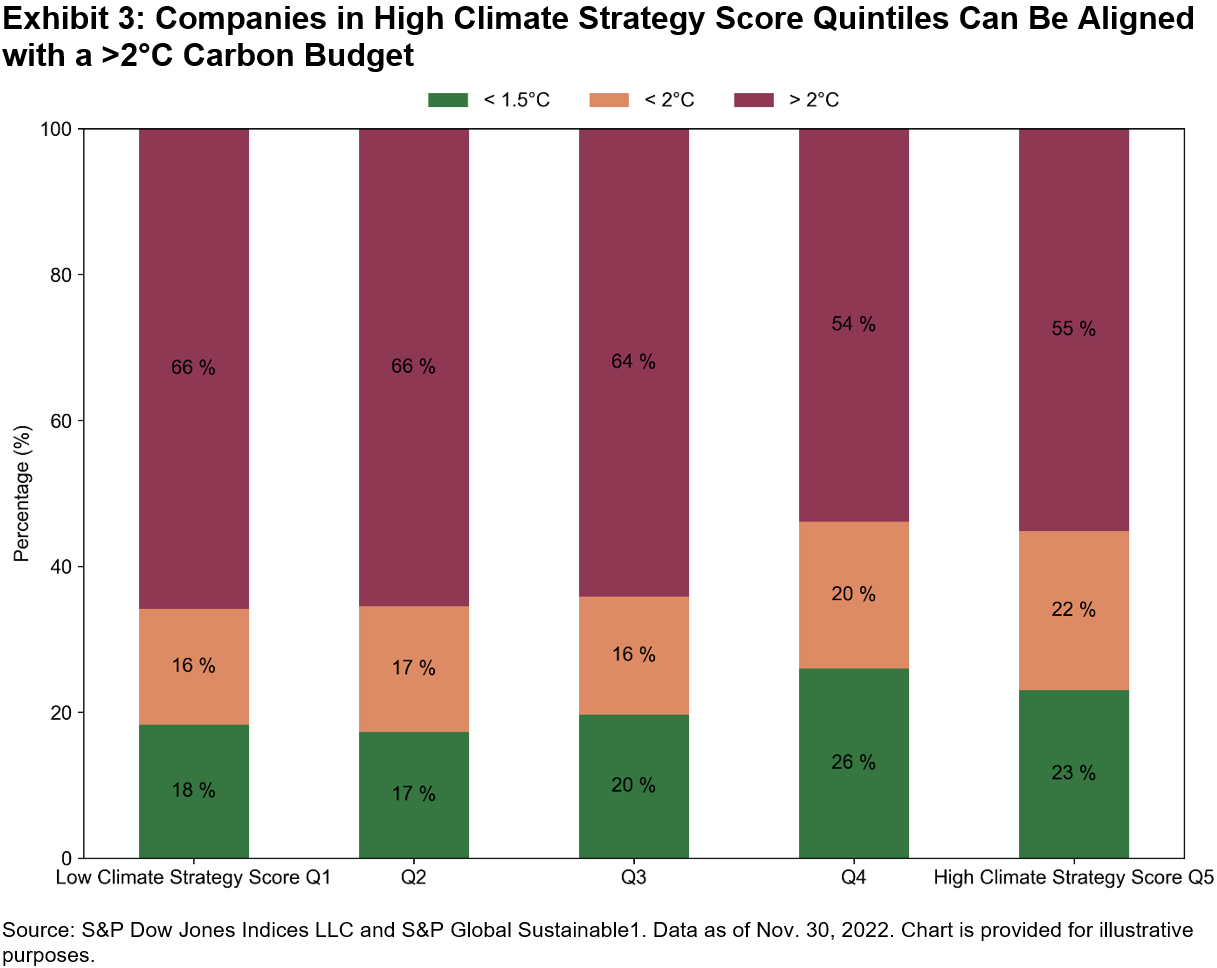
Another way to explore the relationship between net-zero targets and temperature alignment is to look at the S&P Climate Strategy Score. This is sourced from the S&P Global Corporate Sustainability Assessment (CSA)5 under the environmental dimension and comprises questions related to climate targets, carbon pricing and TCFD disclosure, among others. A similar phenomenon occurs, where companies within low climate strategy quintiles can still be 1.5°C aligned, and vice-versa (see Exhibit 3).
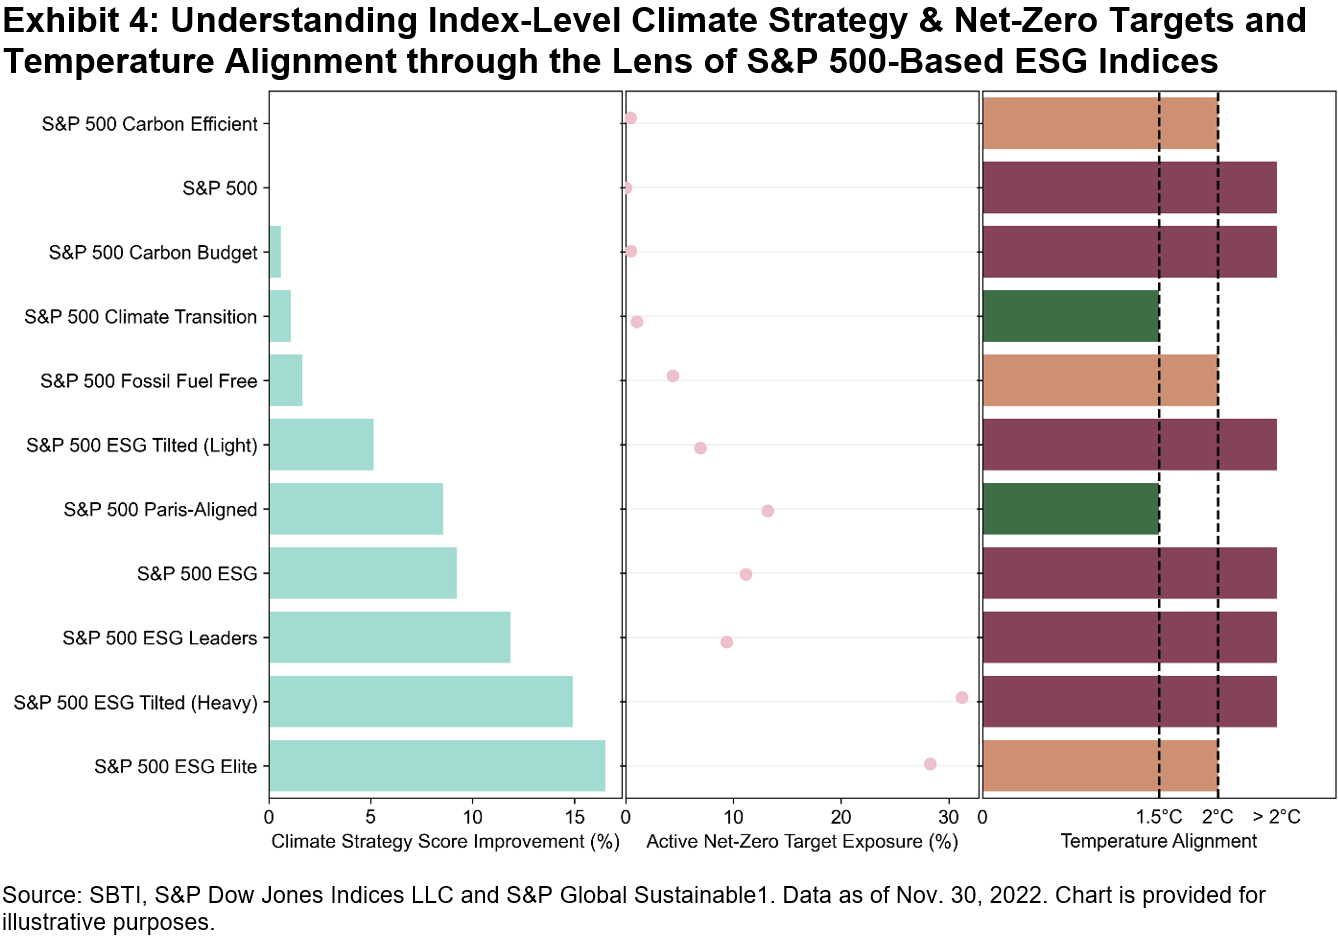
How do different S&P 500-based indices fare when considering all these aspects? Most of S&P DJI’s sustainability indices show a Climate Strategy Score improvement relative to the underlying S&P 500, except the S&P Carbon Efficient Index (see Exhibit 4). There seems to be a positive relationship between the Climate Strategy Score and active net-zero target exposure, which might be expected, as one of the metrics assessed under the score is climate targets commitment. Yet, when it comes to temperature alignment, what was observed at the company level also seems to prove true at the index level: higher exposure to companies with net-zero targets and enhanced climate strategies does not necessarily translate into a 1.5°C outcome, according to S&P Global Trucost models.
Bridging the gap between climate ambition and action has been the focus of many organizations, investor-led groups and policymakers alike. While corporate target setting might be the first step in the right direction, continued decarbonization action needs to be sustained to stay within a 1.5°C budget. Net-zero indices that incorporate forward-looking metrics, such as the S&P PACT™ Indices (S&P Paris-Aligned & Climate Transition Indices) might help market participants align with a 1.5°C pathway, while increasing allocation to companies with climate-oriented targets and strategies.
1 Task Force on Climate-related Financial Disclosures (TCFD) recommends “Metrics & Targets” as one of the pillars for climate disclosures.
2 Companies are required to report annually on targets’ progress.
3 Companies involved in oil, natural gas and coal business activities are not currently able to set up SBTI targets.
4 Analysis performed using S&P Global Trucost’s Paris Alignment dataset.
5 For more information on the CSA, please see here.
The posts on this blog are opinions, not advice. Please read our Disclaimers.What Performance Reversals Suggest

Investment results in 2022 were distinctly different from those of the recent past. The S&P 500®, which had doubled in the three years between 2019 and 2021, fell by more than 18% last year, and Exhibit 1 shows that there were regime shifts among factor indices as well.
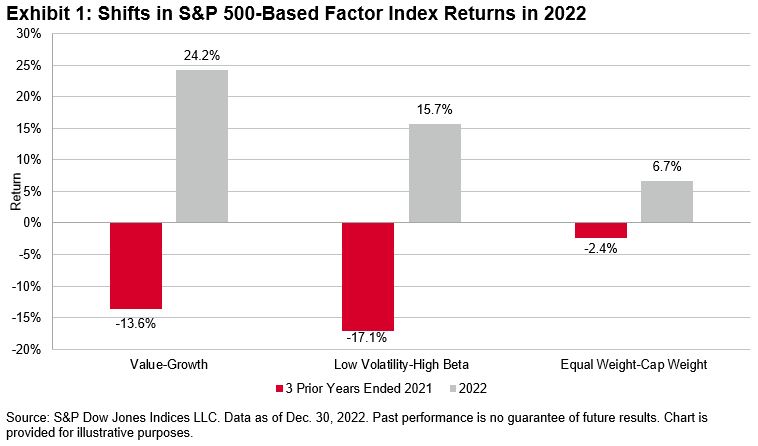
The dominance of Value over Growth in 2022 was especially remarkable. The one-year Value-Growth spread stands at the 97th percentile over all 12-month intervals since mid-1996. Equally interesting is that six years had passed since Value’s last “win” in 2016.
What can we infer from these factor shifts? Here are three important things:
First, they suggest considering passive management to be the default position for any asset owner—regardless of whether he’s seeking broad equity market exposure from the S&P 500, or more targeted factor exposure from one of the indices in Exhibit 1 (or their many cousins). Readers familiar with our SPIVA® Scorecards (and I hope that means all of you) will realize that most active managers underperform most of the time. That result holds true across capitalization and style segments: the same causes that make it hard for a core equity manager to beat the S&P 500 make it hard for a value manager to outperform the S&P 500 Value. An asset owner who opts for indicized factor exposure is likely to outperform an active manager operating in the same market segment.
Second, Exhibit 1 reminds us of the importance of patience. There are good theoretical arguments for why value should outperform growth, why low volatility should outperform high beta and why equal weight should outperform cap weight—but even if completely correct, those are arguments about long-run performance. Many low volatility or value investors spent the years between 2019 and 2021 wondering if something important had changed. 2022’s reversal was welcome, but it was a long time coming. In investment management, as in life generally, gratification must sometimes be deferred.
Finally, Exhibit 1 raises an important philosophical question: what is the point of factor indices in the first place? A value-driven factor index tracks relatively cheap stocks. A low volatility index tracks stocks with below-average volatility. A quality index tracks stocks with strong balance sheets and profitability. Are these characteristics, or others like them, desirable in themselves, or are they means to a different end? Low volatility indices, for example, are almost always less volatile than the benchmark from which their constituents are drawn, but as we saw above, they sometimes underperform. An asset owner who chooses Low Volatility because he wants less volatility is likely to be satisfied most of the time; his counterpart who chooses Low Volatility because he thinks it will outperform has much more potential for buyer’s remorse.
An investor who undertakes factor exposure as a means of outperforming should understand that no factor index outperforms all the time, and that his ability to tolerate periodic underperformance may have a major bearing on his success. The investor should strive to understand the conditions that will facilitate a factor’s success. At least as importantly, he should be clear about his own goals and motivations.
The posts on this blog are opinions, not advice. Please read our Disclaimers.GICS Changes Are Approaching

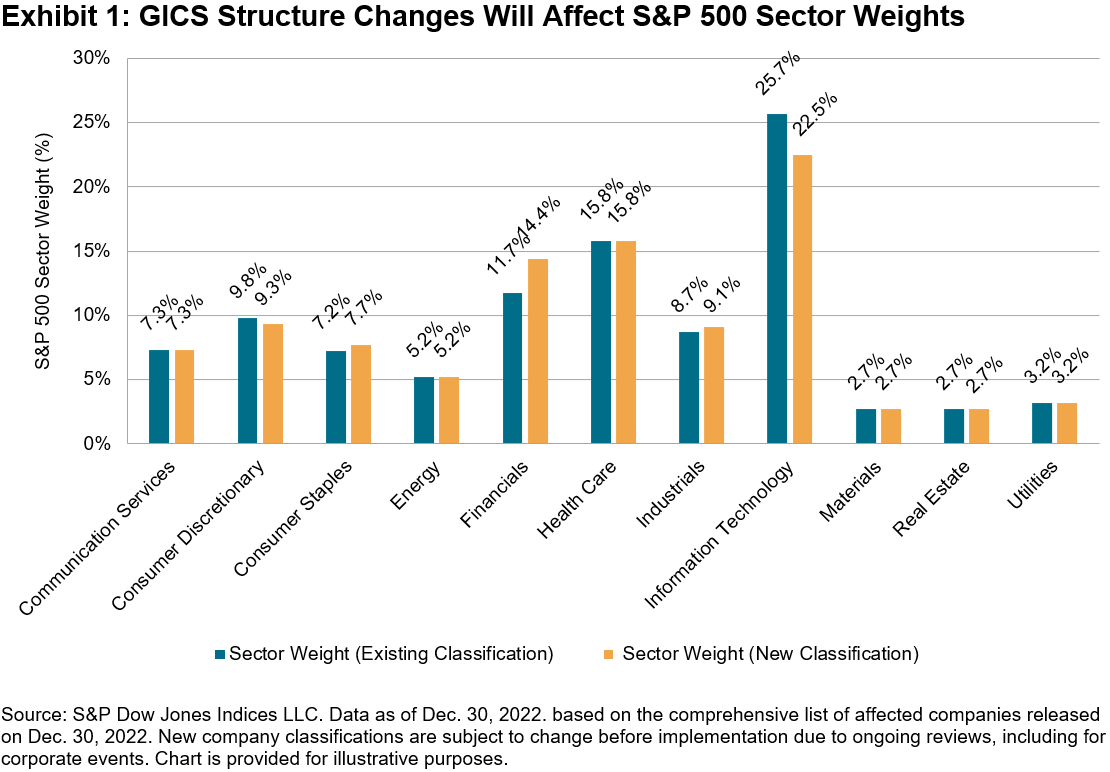
After the close on March 17, 2023, changes to the Global Industry Classification Standard (GICS®) structure will go into effect in GICS Direct and in S&P DJI’s indices. These changes will affect most sectors and will change what it means to be sector neutral. For example, Exhibit 1 compares the S&P 500 sector weights at the end of 2022 under the existing GICS structure compared to the new structure, assuming it had already gone into effect. Information Technology and Consumer Discretionary’ s weights are set to fall, while Financials and Industrials’ weights are set to increase. Here is an overview of some of the biggest upcoming changes.
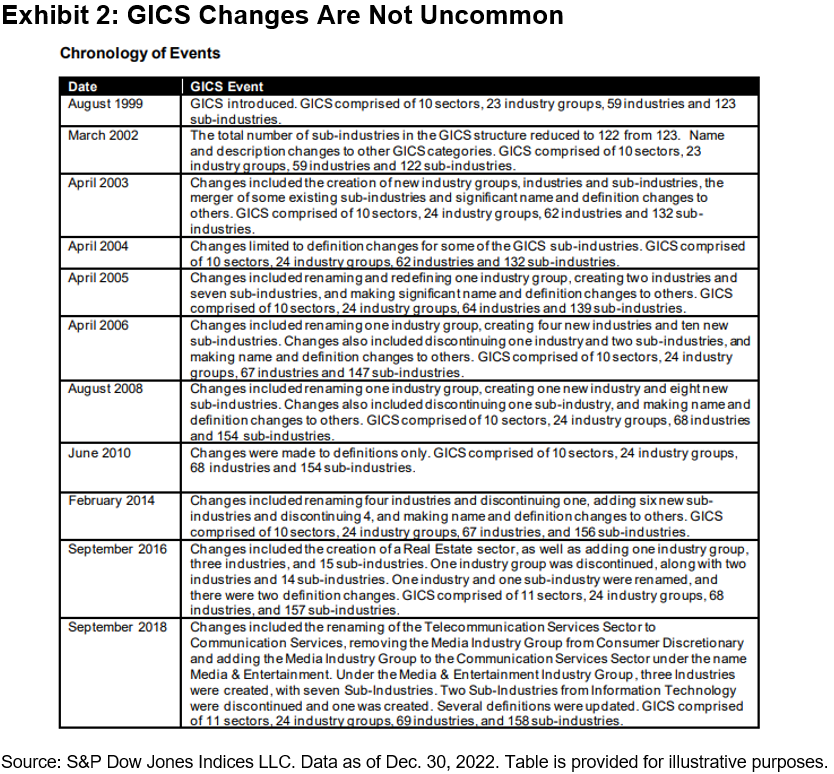
GICS Is Reviewed Annually to Ensure It Continues to Reflect Global Equity Markets
Launched in 1999, GICS provides a single, consistent framework to classify companies, allowing for global sector and industry comparisons. Companies are assigned to a sub-industry according to their principal business activities, based on revenues (mainly) as well as earnings and market perception. Allocation to a sub-industry then determines—in decreasing order of granularity—membership to an industry, an industry group and a headline sector. The GICS framework is reviewed annually to ensure that the structure continues to reflect global equity markets.
Exhibit 2 shows that there have been several updates over the years, including the creation of Real Estate as standalone sector (2016) and the renaming of Telecommunication Services to Communication Services (2018). The upcoming GICS changes will affect most GICS sectors and will leave us with 11 sectors, 25 industry groups, 74 industries and 163 sub-industries.
Updates to Consumer Discretionary and Consumer Staples Reflect the Evolution of the Retail Landscape
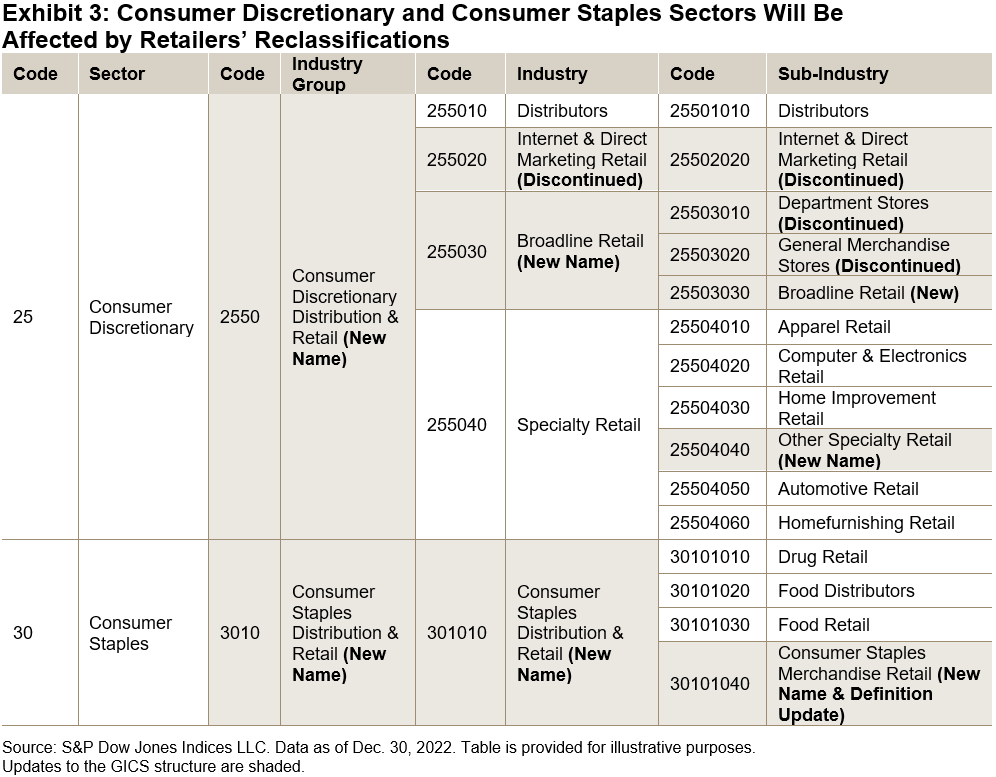
A key update in March 2023 is that retailers will be classified based on the nature of goods sold rather than according to the underlying technology used to deliver the product or service. This update reflects the fact that retailers have increasingly taken an omni-channel approach to sell their products, reducing the demarcation between existing segments.
Exhibit 3 summarizes the impact across the Consumer Discretionary and Consumer Staples sectors. For example, the General Merchandise Stores and Department Stores sub-industries will be merged into a new sub-industry called Broadline Retail, which will also capture some of the companies (e.g., Amazon and eBay) in the soon-to-be discontinued Internet & Direct Marketing Retail sub-industry. Retailers that generate a majority of revenue or earnings from staples such as food, household and personal care products will be migrated to Consumer Staples.
Several Information Technology Companies Will Move to Other Sectors
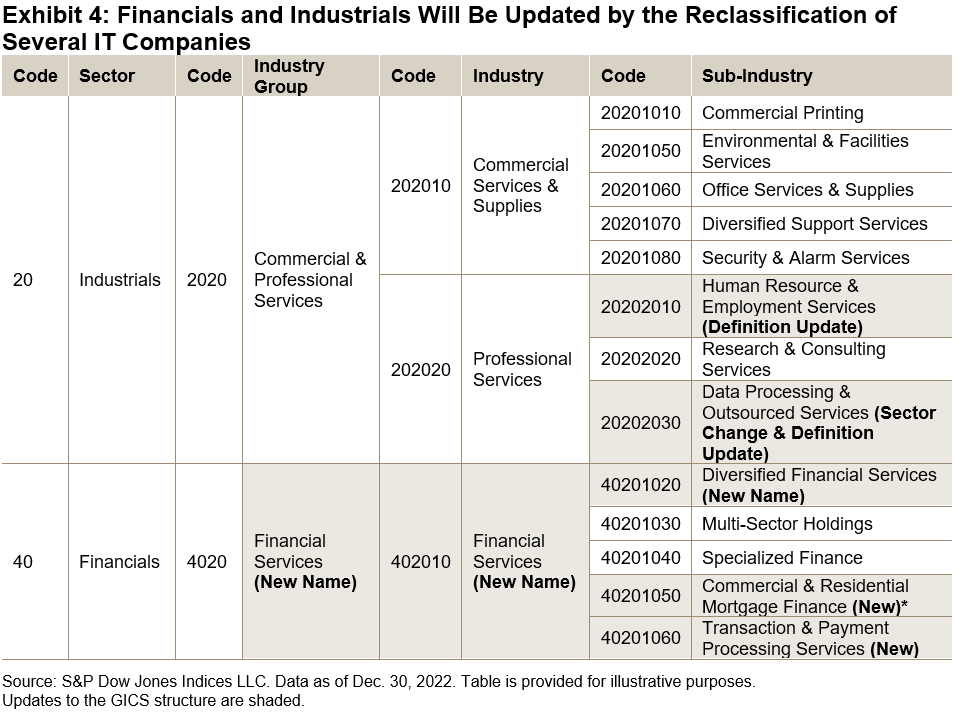
Information Technology will also be affected by the upcoming changes: the Data Processing & Outsourced Services sub-industry is being discontinued to reflect the close alignment with business support activities in other sectors. Companies in the sub-industry will migrate to: Industrials under a definition update or under Human Resources & Employment Services; to Financials under Transaction and Payment Processing; or to Consumer Discretionary under Hotels, Resorts & Cruise Lines.
These changes will affect indices’ sector weights. For example, the Data Processing & Outsourced Services sub-industry accounts for around 3% of the S&P 500’s weight as of January 2023, and 2 of the largest 10 S&P 500 IT companies (Visa and Mastercard) will migrate to Financials.
Elsewhere, the upcoming GICS changes update the classification of Transportation, Banks and Thrifts & Mortgage Finance, as well as providing greater granularity in the classification of Real Estate Investment Trusts (REITs).
A full overview of the latest revisions to GICS can be found here, and the current and historical GICS classifications—including definitions—can be downloaded here.
The posts on this blog are opinions, not advice. Please read our Disclaimers.Surveying Style Indices
- Categories Equities, Factors
- Tags 2023, Craig Lazzara, equities, factors, Financial Advisors, growth investing, growth vs. value, indexing, pure growth, pure style, pure value, S&P 500 Growth, S&P 500 Pure Growth, S&P 500 Pure Value, S&P 500 Value, S&P Pure Style, S&P Pure Style Indices, S&P Style, Style, style bias, U.S. style, US FA, value investing
How can index construction inform style selection? S&P DJI’s Craig Lazzara takes a closer look at the S&P Style and S&P Pure Style Indices and how these different approaches to indexing Growth and Value are designed to help advisors align strategies with client objectives.
The posts on this blog are opinions, not advice. Please read our Disclaimers.