Get Indexology® Blog updates via email.

In This List

The Dow Jones Dividend 100 Indices Part 2: Strong Fundamentals and the Benefits of Diversification

Indexing Income: How Are Insurers Diversifying with Dividends?

Latin American Equities Outperformed Global Regions in 2022

The Dow Jones Dividend 100 Indices Part 1: A Focus on Dividend Sustainability and Quality

Examining Tactical Approaches to Sectors

The Dow Jones Dividend 100 Indices Part 2: Strong Fundamentals and the Benefits of Diversification

Contributor Image
George Valantasis

Associate Director, Factors and Dividends

S&P Dow Jones Indices

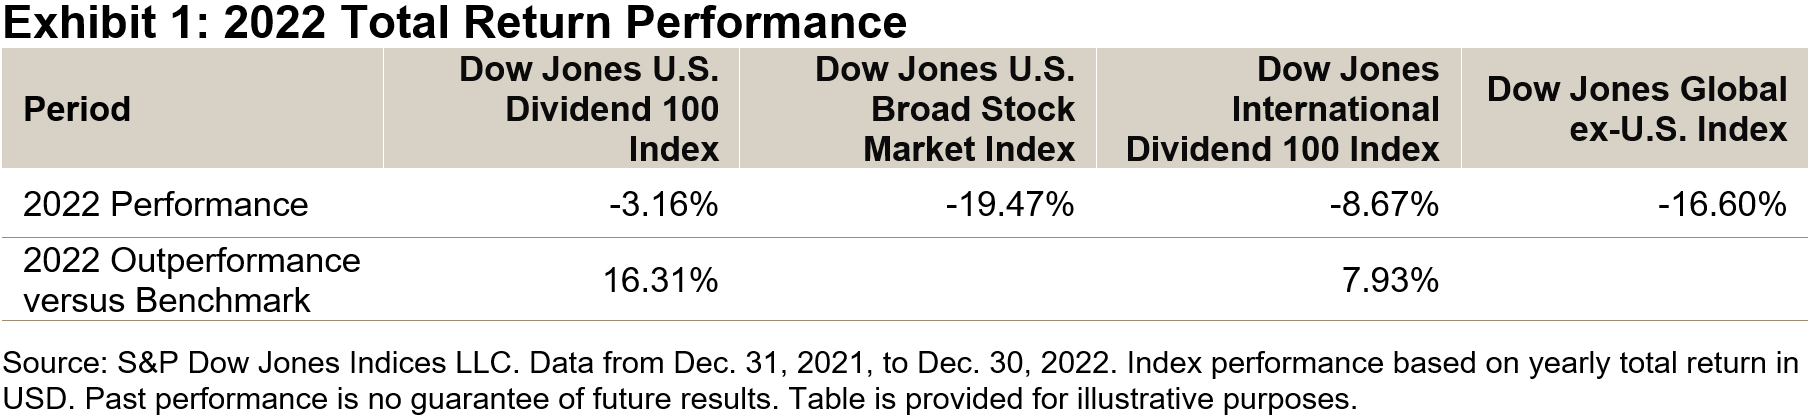
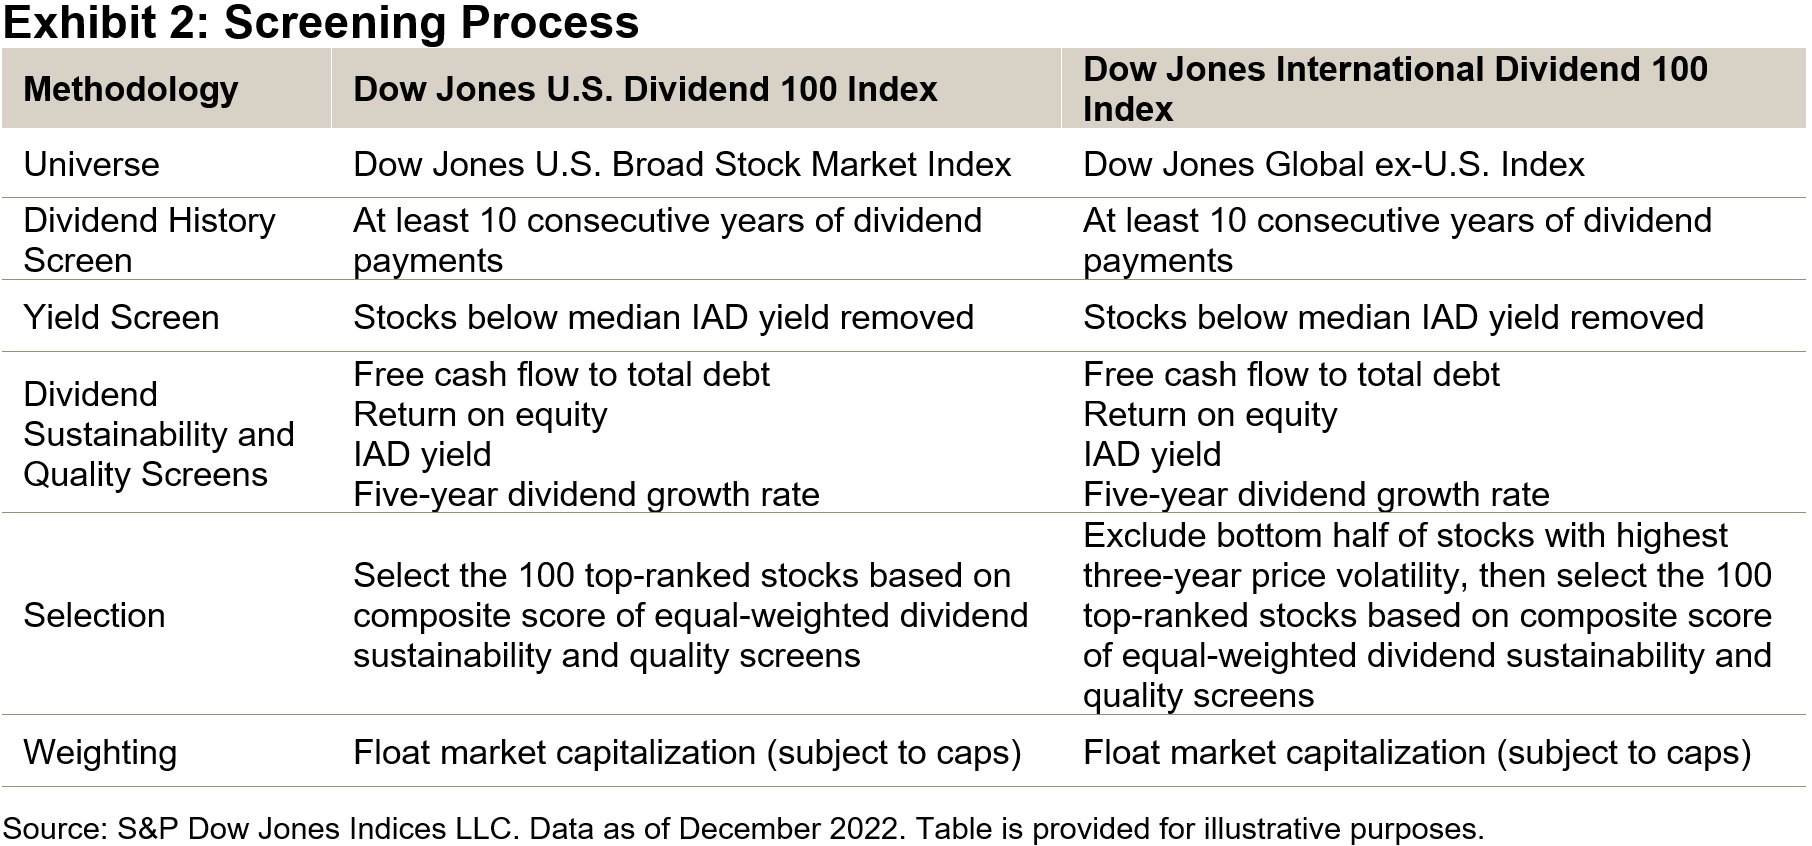
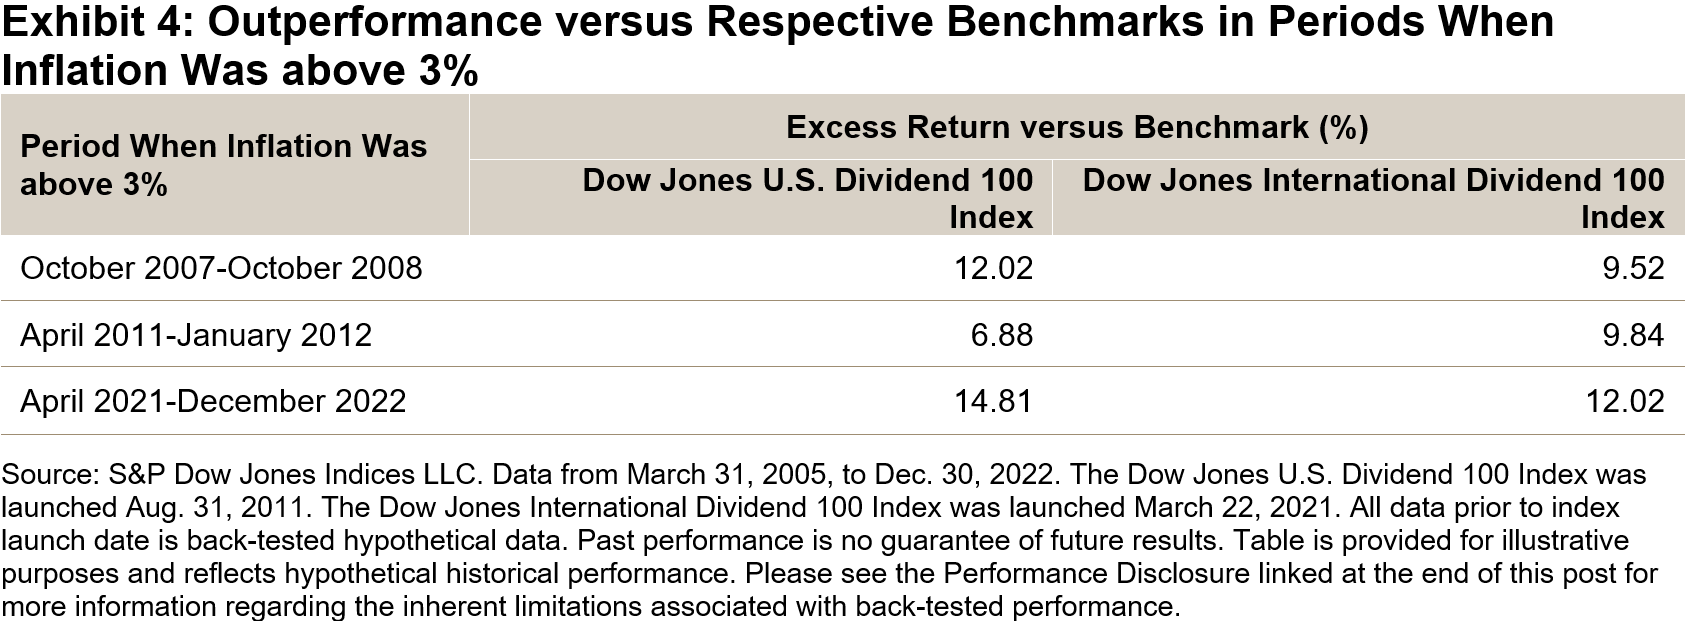
In part one of this series, we highlighted how the stringent dividend sustainability and quality screens of the Dow Jones U.S. Dividend 100 Index and Dow Jones International Dividend 100 Index may have led to their outperformance in 2022 and other inflationary periods.

In this installment, we will analyze the positive effects that these screens had on the fundamentals of both indices, as well as examine examples of combining the U.S. and international indices to harness possible diversification benefits.

Comparing Fundamentals

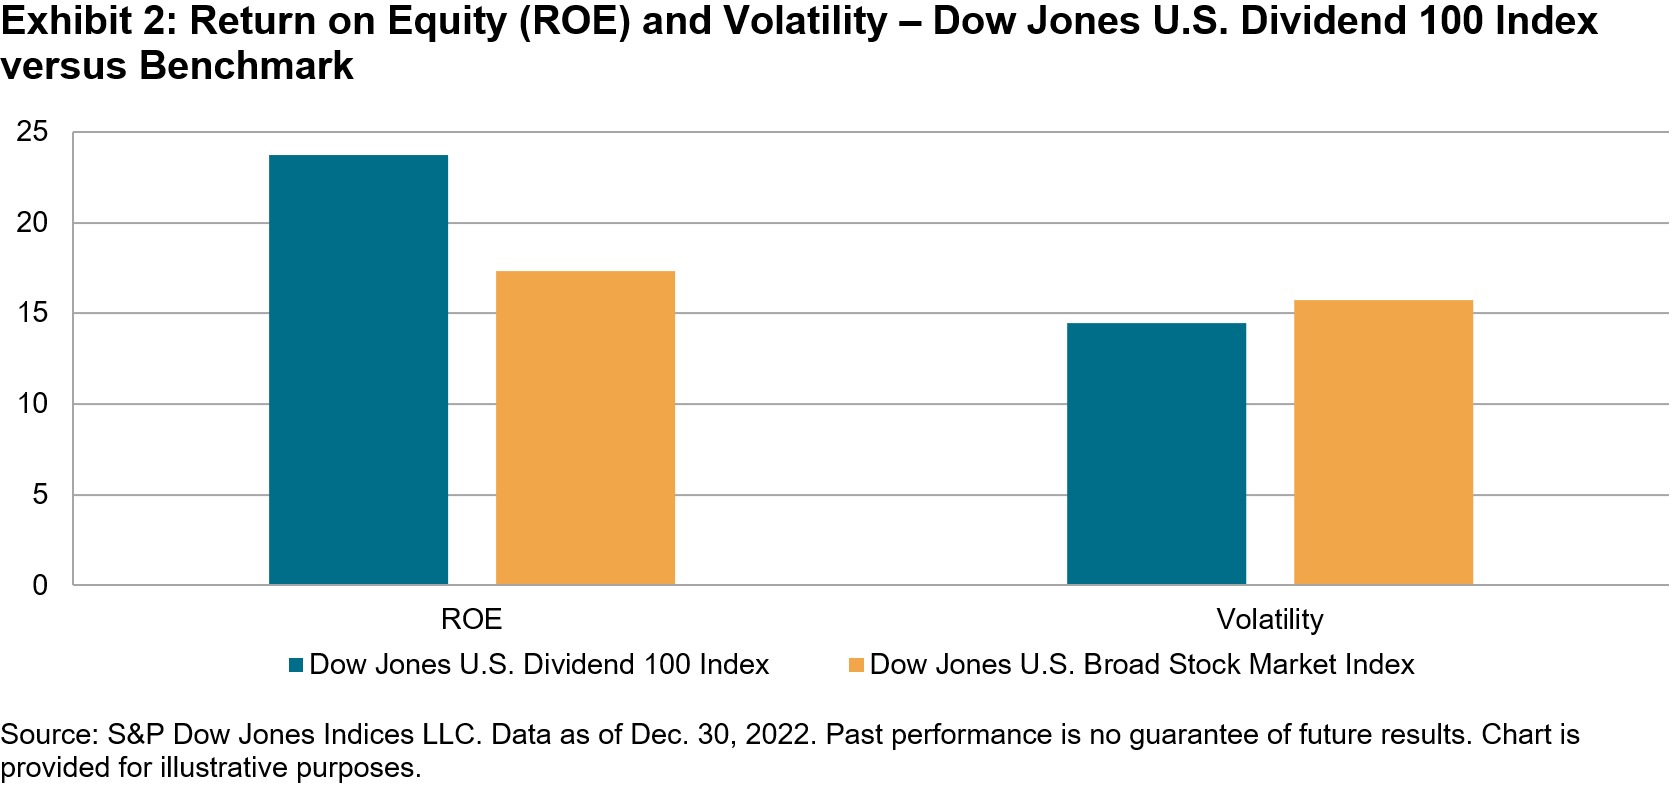
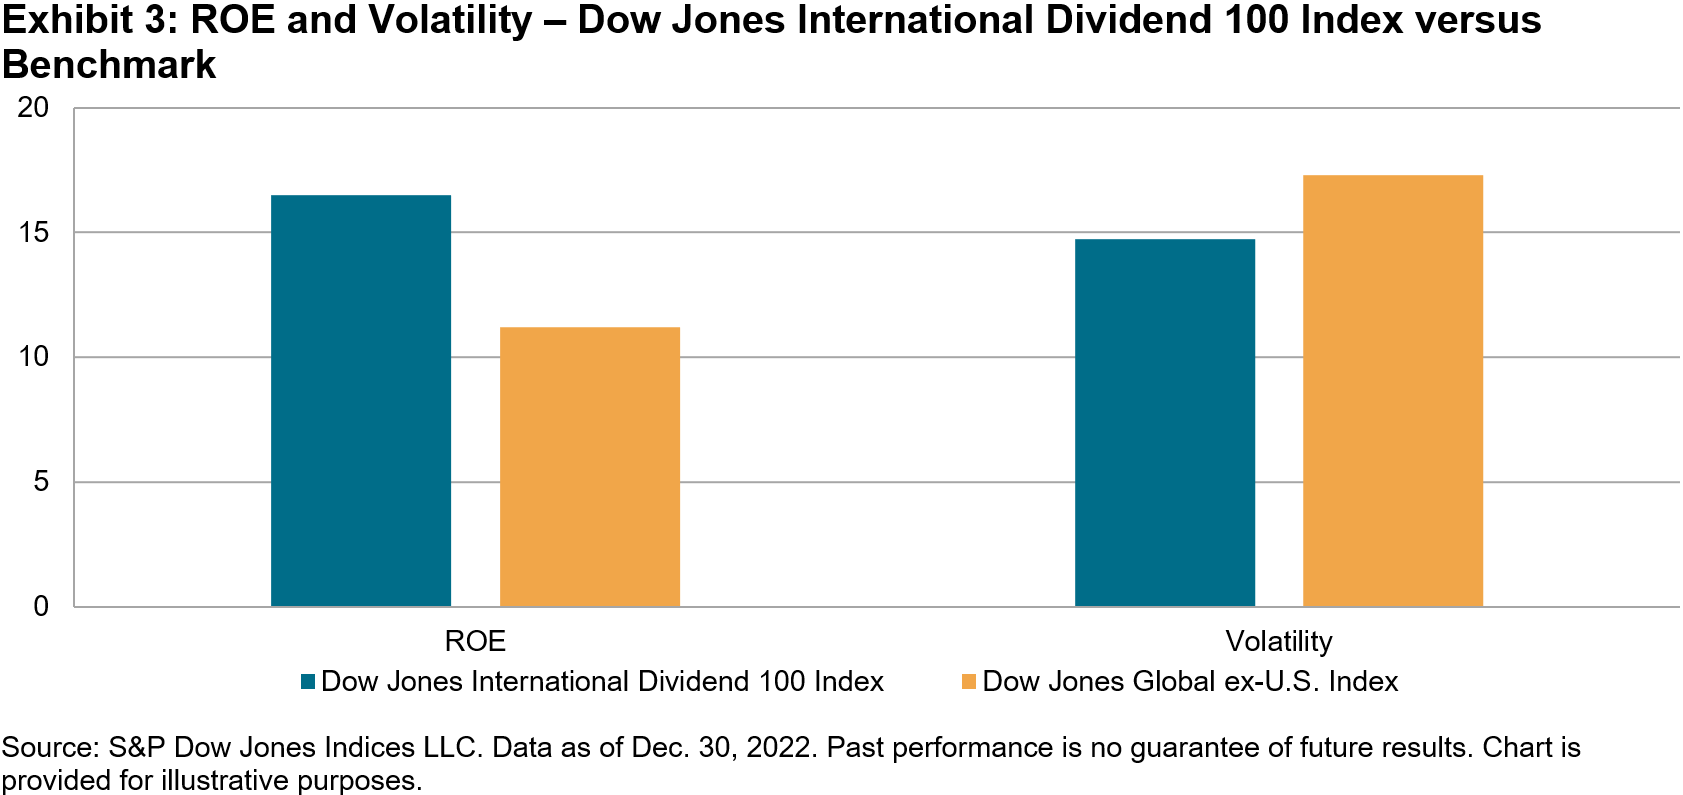
Exhibits 1, 2 and 3 show the significantly improved value and quality metrics that both Dow Jones 100 Indices had compared with their respective benchmarks. Exhibit 1 shows that both Dow Jones Dividend 100 Indices traded at a discount to their respective benchmarks on every valuation metric. A value tilt may prove important in a rising interest rate environment, because value stocks tend to receive larger cash flows in the near term, and therefore typically have lower durations relative to growth stocks. Holding all else equal, value stocks may perform better in a rising interest rate environment compared with growth stocks.1

Furthermore, as Exhibits 2 and 3 show, both Dow Jones Dividend 100 Indices held a quality advantage and volatility reduction compared with their respective benchmarks. These features may have proved particularly beneficial amid 2022’s rapidly rising interest rates and deteriorating economic environment.

Potential Diversification Benefits

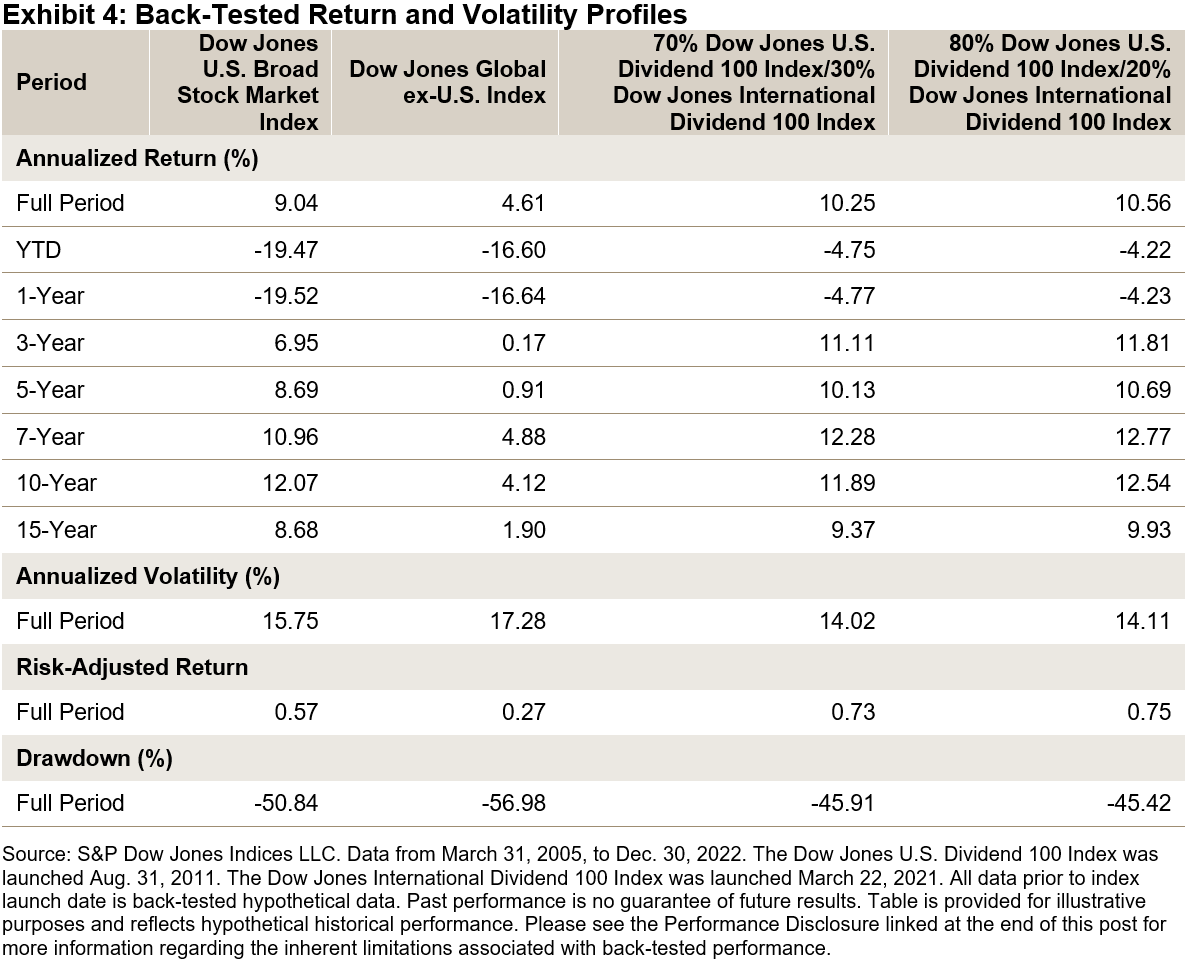
An interesting option for those wanting to reduce volatility while potentially enhancing dividend yield is to pair the Dow Jones International Dividend 100 Index with the Dow Jones U.S. Dividend 100 Index. Exhibit 4 illustrates two hypothetical weighting scenarios and their simulated performance. The first scenario allocates 70% weight to the U.S. index and 30% to the international index, while the second scenario allocates 80% weight to the U.S. index and 20% to the international index.

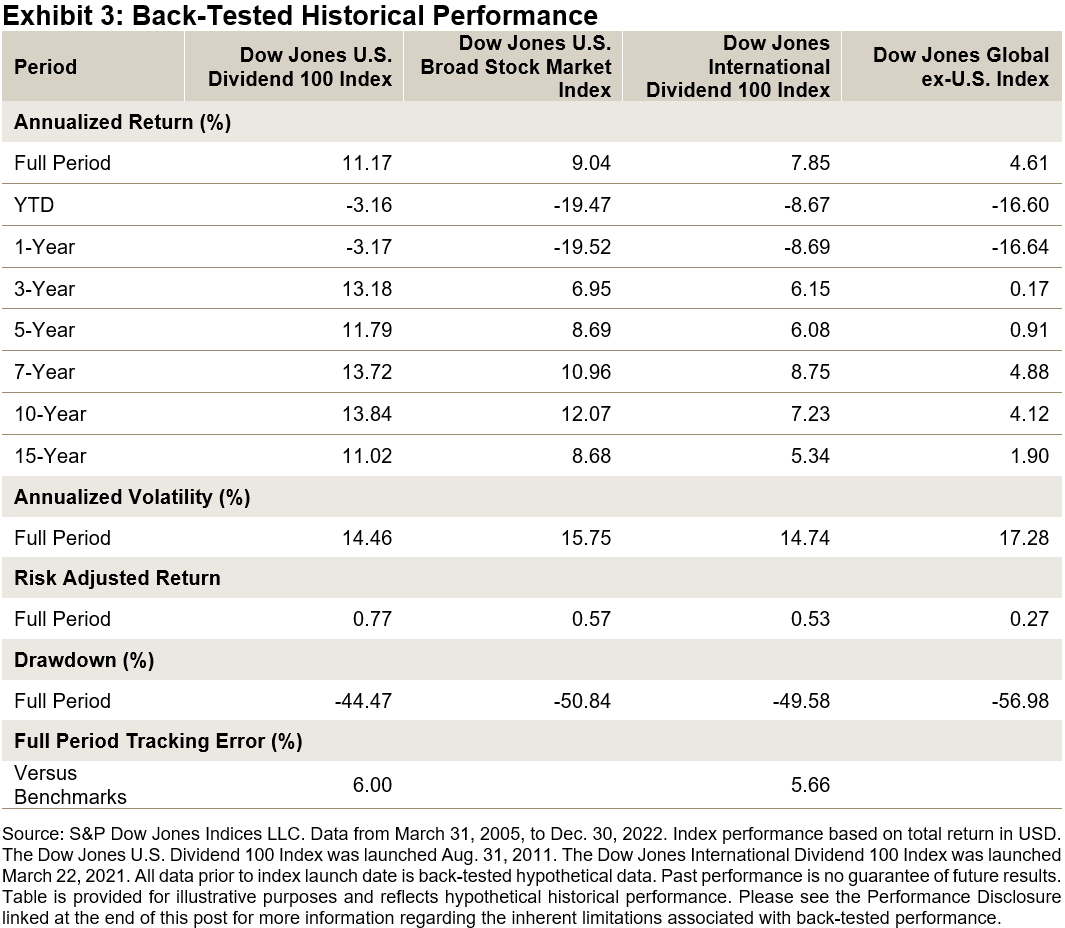
When observing the back-tested period of this hypothetical combined index starting in March 2005, the 70%/30% scenario had a full period of annualized 10.25% performance, exceeding both benchmarks, with volatility reduced to 14.02%. In the 80%/20% scenario, the annualized performance was to 10.56%, while the volatility was 14.11%. the back-tested hypothetical risk-adjusted return and maximum drawdown were significantly improved versus both benchmarks.

Conclusion

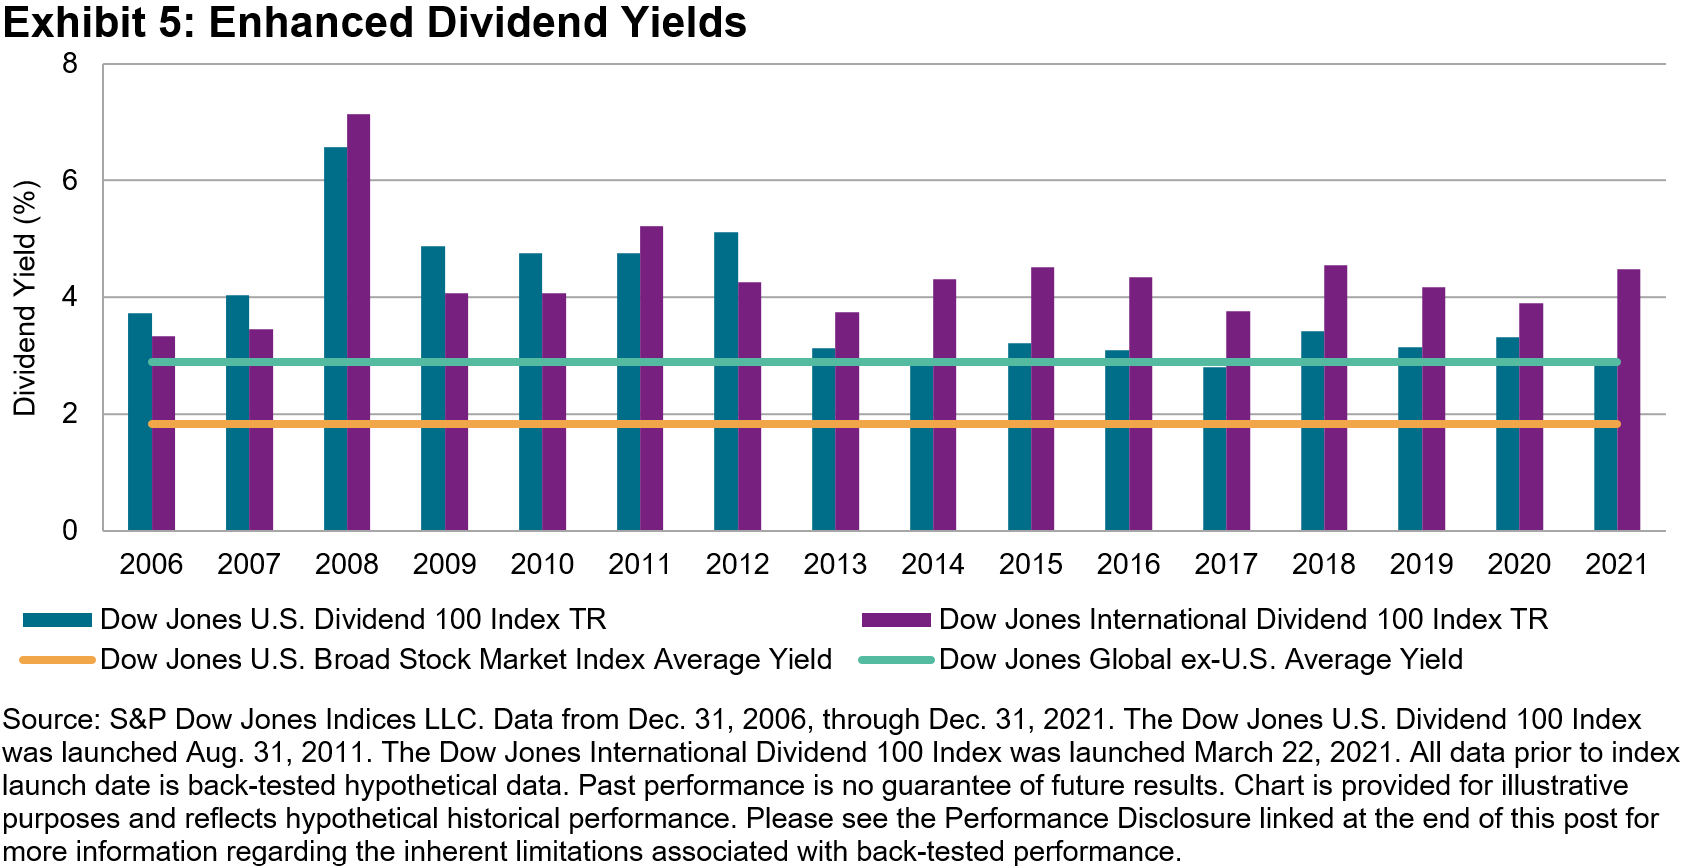
As discussed in part one, the Dow Jones U.S. Dividend 100 Index and Dow Jones International Dividend 100 Index performed well versus their benchmarks in 2022, despite a difficult economic environment. This may in part be due to their higher yields and fundamentals relative to their benchmarks.

For institutions only, not for retail investors.

l https://www.institutionalinvestor.com/article/b1wd19khdzwj89/In-an-Inflationary-Environment-Value-Stocks-Offer-a-Refuge

The posts on this blog are opinions, not advice. Please read our Disclaimers.

Indexing Income: How Are Insurers Diversifying with Dividends?

As insurers face one of the most challenging bond markets in decades, many insurance companies are looking for different ways to generate revenue. S&P DJI’s Raghu Ramachandran and Rupert Watts join State Street Global Advisors’ Ben Woloshin for a closer look at how and why some insurers are implementing indexed-based equity strategies.

The posts on this blog are opinions, not advice. Please read our Disclaimers.

Latin American Equities Outperformed Global Regions in 2022

Contributor Image
Silvia Kitchener

Director, Global Equity Indices, Latin America

S&P Dow Jones Indices

Despite a difficult year for most global equity markets, the S&P Latin America BMI gained 4.9% in 2022, and it was the only major regional equity market to close the year in positive territory. This marked a stark reversal from 2021, when Latin American equities were the sole region in the red, while the S&P 500® and several other regional equity markets hit record highs.

While most equity markets were hampered by rising interest rates, recession concerns and a steep decline in Information Technology and other growth-oriented stocks, Latin American equities benefited from high exposure to commodities and limited exposure to Information Technology, along with currency strength versus the U.S. dollar.

On a quarterly basis, global regions struggled throughout the year. Latin America, on the other hand, was up three of the four quarters, as shown by the performance of the S&P Latin America BMI (see Exhibit 2).

A closer look at the main country indices shows that Argentina’s S&P MERVAL (ARS) posted the largest gains for Q4 (45.3%) and YTD (142.0%). However, these returns are reflective of the country’s high inflation rate. Focusing on the emerging markets in the region, Chile was the top performer in 2022, as reflected by the S&P IPSA, driven mainly by its exposure to mining, which kept it in positive territory in Q2 (while other regions posted losses in that period). Peru and Colombia, despite recent political instability with newer elected governments, ended the year losing a mere 2% each. The largest markets in the region, Brazil and Mexico, both had their ups and downs; in the end, Brazil was able to generate higher returns, driven by its mining and oil & gas companies, helping the S&P Brazil LargeMidCap (BRL) gain 3.5%, while Mexico’s S&P/BMV IRT (MXN) was down 5.7% for the year.

Sector analysis shows that the one-year returns were mixed. The rise in oil prices drove the Energy sector (41.2%) to outperform. Other top performers among the S&P Latin America BMI sectors were Real Estate (16.3%) and Utilities (14.5%), however Financials (8.8%) and Materials (9.1%), which are represented by the largest companies in the region, had the greatest contribution to returns after Energy (see Exhibit 4).

In terms of securities, Exhibit 5 shows the top 10 companies with the largest contribution to returns in 2022. On the other side of the spectrum, some of the largest companies in the region that underperformed for the year were Mexico’s America Movil, Grupo Mexico and Cemex.

For more information on how Latin American benchmarks performed in Q4 2022, read the latest Latin America Scorecard.

The posts on this blog are opinions, not advice. Please read our Disclaimers.

The Dow Jones Dividend 100 Indices Part 1: A Focus on Dividend Sustainability and Quality

Contributor Image
George Valantasis

Associate Director, Factors and Dividends

S&P Dow Jones Indices

Looking back, 2022 was an impressive year for passive dividend indices, both with respect to performance and inflows on the back of rising interest rates. The Dow Jones U.S. Dividend 100 Index and Dow Jones International Dividend 100 Index were two of the standout performers, which may be due to their emphasis on strong fundamentals and robust dividend payments.

In this blog, we will examine the two indices’ focus on dividend sustainability and quality as well as review their historical performance and dividend yields. In a subsequent blog, we will analyze their fundamentals and provide back-tested historical simulations combining the U.S. and international versions for those wishing to see the benefits of diversification.

Stringent Fundamental Screening

Both Dow Jones Dividend Indices use stringent fundamental screening when selecting constituents. In fact, multiple screens are applied, including value, growth and, most extensively, quality (there is also a low volatility screen applied to the international version).

Their methodologies begin by including only companies that have paid dividends for at least 10 consecutive years. Stocks are then ranked by indicated annualized dividend (IAD) yield, with those below the eligible median stock’s IAD yield being removed.

Next, the 100 top-ranked stocks are selected based on their equal-weighted composite score consisting of free cash flow (FCF) to total debt, return on equity (ROE), IAD yield and five-year dividend growth rate. The Dow Jones International Dividend 100 Index includes an additional step of filtering out the bottom half of stocks with the highest three-year price volatility. Lastly, both indices weight constituents quarterly, using a float-market-capitalization approach (subject to weight caps).

This emphasis on multi-factor screening is unique and leads to superior fundamental metrics versus their benchmarks, which we will examine in part two of this blog series. Specifically, quality measures such as FCF to total debt and ROE are important. FCF to total debt measures how long it will take a company to repay its debt using solely its free cash flow, and ROE measures how efficiently a company employs shareholder capital to generate profits.

Performance

Over the long term, Exhibit 3 shows that the Dow Jones Dividend 100 Indices generated significantly higher risk-adjusted returns over the full back-tested period versus their respective benchmarks. Both achieved this by generating higher absolute returns while also exhibiting less volatility. The max drawdowns were also improved, by over 6% for the Dow Jones U.S Dividend 100 Index and over 7% for the Dow Jones International Dividend 100 Index.

Exhibit 4 displays the outperformance of both Dow Jones Dividend 100 Indices versus their respective benchmarks in periods when the year-over-year CPI rate exceeded 3% for at least six consecutive months. Both indices significantly outperformed their respective benchmarks in the three most severe inflationary periods dating back to 2005. During the current inflationary period, the Dow Jones U.S. Dividend 100 Index and Dow Jones International Dividend 100 Index have outperformed their respective benchmarks by 14.81% and 12.02%, respectively.

Not surprisingly, dividend yields also outperformed their benchmarks. The average yield of the Dow Jones U.S. Dividend 100 Index was 3.86% over the full period versus 1.83% for the Dow Jones U.S. Broad Stock Market Index. The average yield of the Dow Jones International Dividend 100 Index was 4.33% versus 2.89% for the Dow Jones Global ex-U.S. BMI.

Conclusion

The Dow Jones U.S. Dividend 100 Index and Dow Jones International Dividend 100 Index have performed well relative to their benchmarks in 2022, in an economic environment affected by rapidly rising interest rates, increasing geopolitical risks and slowing economic growth. Stay tuned for part two of this blog series, where we will analyze the fundamentals of these two indices and examine hypothetical portfolios that combine them.

The posts on this blog are opinions, not advice. Please read our Disclaimers.

Examining Tactical Approaches to Sectors

Why does sector dispersion matter and how can it inform tactical approaches to sectors? S&P DJI’s Elizabeth Bebb and Invesco’s András Vig explore how sector dispersion can impact long-term asset allocations.

The posts on this blog are opinions, not advice. Please read our Disclaimers.