Get Indexology® Blog updates via email.

In This List

Commodities Challenged by Slowing Global Growth in November

Introducing the S&P Focused Indices

Measuring Megatrends with Indices

Transparency, FTX, CeFi and DeFi

What Is SPIVA? A Closer Look at 20 Years of the Active vs. Passive Debate

Commodities Challenged by Slowing Global Growth in November

Contributor Image
Fiona Boal

Managing Director, Global Head of Equities

S&P Dow Jones Indices

Commodities, represented by the broad-based S&P GSCI, fell 1.7% in November on the back of weakness in the petroleum and grains complexes. Global commodities markets were particularly hit this month by worries over rare demonstrations in China against COVID-19 curbs, with oil and grains falling to multi-month lows and safe-haven gold rising. After 11 months, the S&P GSCI was up 27.8% YTD, defying higher interest rates and growing fears of a prolonged global economic slowdown.

The S&P GSCI All Crude has lost over a third of its value since peaking in early March (and giving up all gains following the Russia-Ukraine conflict); it might be said that oil prices are nodding in agreement with Treasury yields regarding an approaching economic slowdown. In the petroleum complex, a relatively tight global supply picture is competing with fears of an economic slowdown, a strong U.S. dollar, government intervention to address skyrocketing retail energy prices and signs that energy consumers have taken steps to limit consumption. A drop in financial market participation in the major oil derivative markets has contributed to higher levels of volatility. Market participants will be eagerly awaiting a decision from EU member countries regarding a price cap on Russian oil in early December, as well as the Dec. 4, 2022, OPEC+ meeting to provide further market direction.

The S&P GSCI Grains declined 4.3% in November. In the wheat market, cheap supplies from Russia and elsewhere in the Black Sea region have kept a lid on prices. In contrast, soybeans were supported by strong onshore soymeal demand in China. Argentina’s decision to give a temporary exchange rate for soy exporters until the end of the year will likely encourage a surge of exports in December. The S&P GSCI Cotton rose 20.4% in November but remained more than 50% off its May high. As apparel sales contract, the collapse in cotton prices has been attributed to weaker Chinese demand for cotton yarn, in what could be a sign that core inflation has started to wane. The S&P GSCI Livestock was unchanged over the month.

Industrial metals have so far avoided the malaise caused by Chinese unrest, and expectations of a global slowdown instead focused on steps announced by China aimed at bailing out its struggling real estate sector. The S&P GSCI Industrial Metals rose 12.2% over the month, while nickel rallied 23.9%.

The S&P GSCI Gold gained 6.8% in November, ending a seven-month losing streak. Signs that the U.S. Fed could scale back the pace of its interest rate hikes, along with the ongoing failures in the cryptocurrency ecosystem, helped support the so-called safe-haven asset.

To learn more about the S&P GSCI and related indices, check out our Commodities Theme Page.

The posts on this blog are opinions, not advice. Please read our Disclaimers.

Introducing the S&P Focused Indices

Contributor Image
Fei Wang

Senior Analyst, U.S. Equity Indices

S&P Dow Jones Indices

The growth of index-based passive investing can be attributed to its transparency, efficiency and low cost, along with active management shortcomings. More recently, buoyed by the growth of direct indexing, there has also been increased demand for indices that select a subset of constituents from underlying benchmarks and are designed to meet specified objectives.

S&P DJI recently launched the S&P Focused Indices, which are designed with direct indexing use cases in mind.

S&P Focused Indices Methodology Overview

The S&P Focused Index Series currently comprises three indices: S&P 500® Focused 50 Index, S&P 500 Focused 100 Index and S&P 500 Catholic Values Focused 100 Index. The first two are based on the S&P 500, and the third index is based on the S&P 500 Catholic Values Index. The target company counts are 50, 100 and 100, respectively, and the indices are reconstituted annually.

Each S&P Focused Index is designed to have similar Global Industry Classification Standard (GICS®) industry group weights as its underlying index, which has also resulted in similar sector weights historically.

Exhibit 1 compares the GICS sector and industry group weights of each S&P Focused Index against its benchmark, as of Oct. 31, 2022. The results were similar to their benchmarks; differences were typically less than 1%.

Back-Tested Performance History

Perhaps unsurprisingly, the similarity in sector and industry group weights between the S&P Focused Indices and their respective underlying indices contributed to similar long-term performance, historically. For example, only 0.03% separated the annualized returns of the S&P 500 Focused 50 Index and S&P 500 since December 2009.

However, greater deviations were observed over shorter horizons. For instance, the S&P 500 Focused 50 Index outperformed the S&P 500 by 2.36% YTD and by 2.99% over the past 12 months.
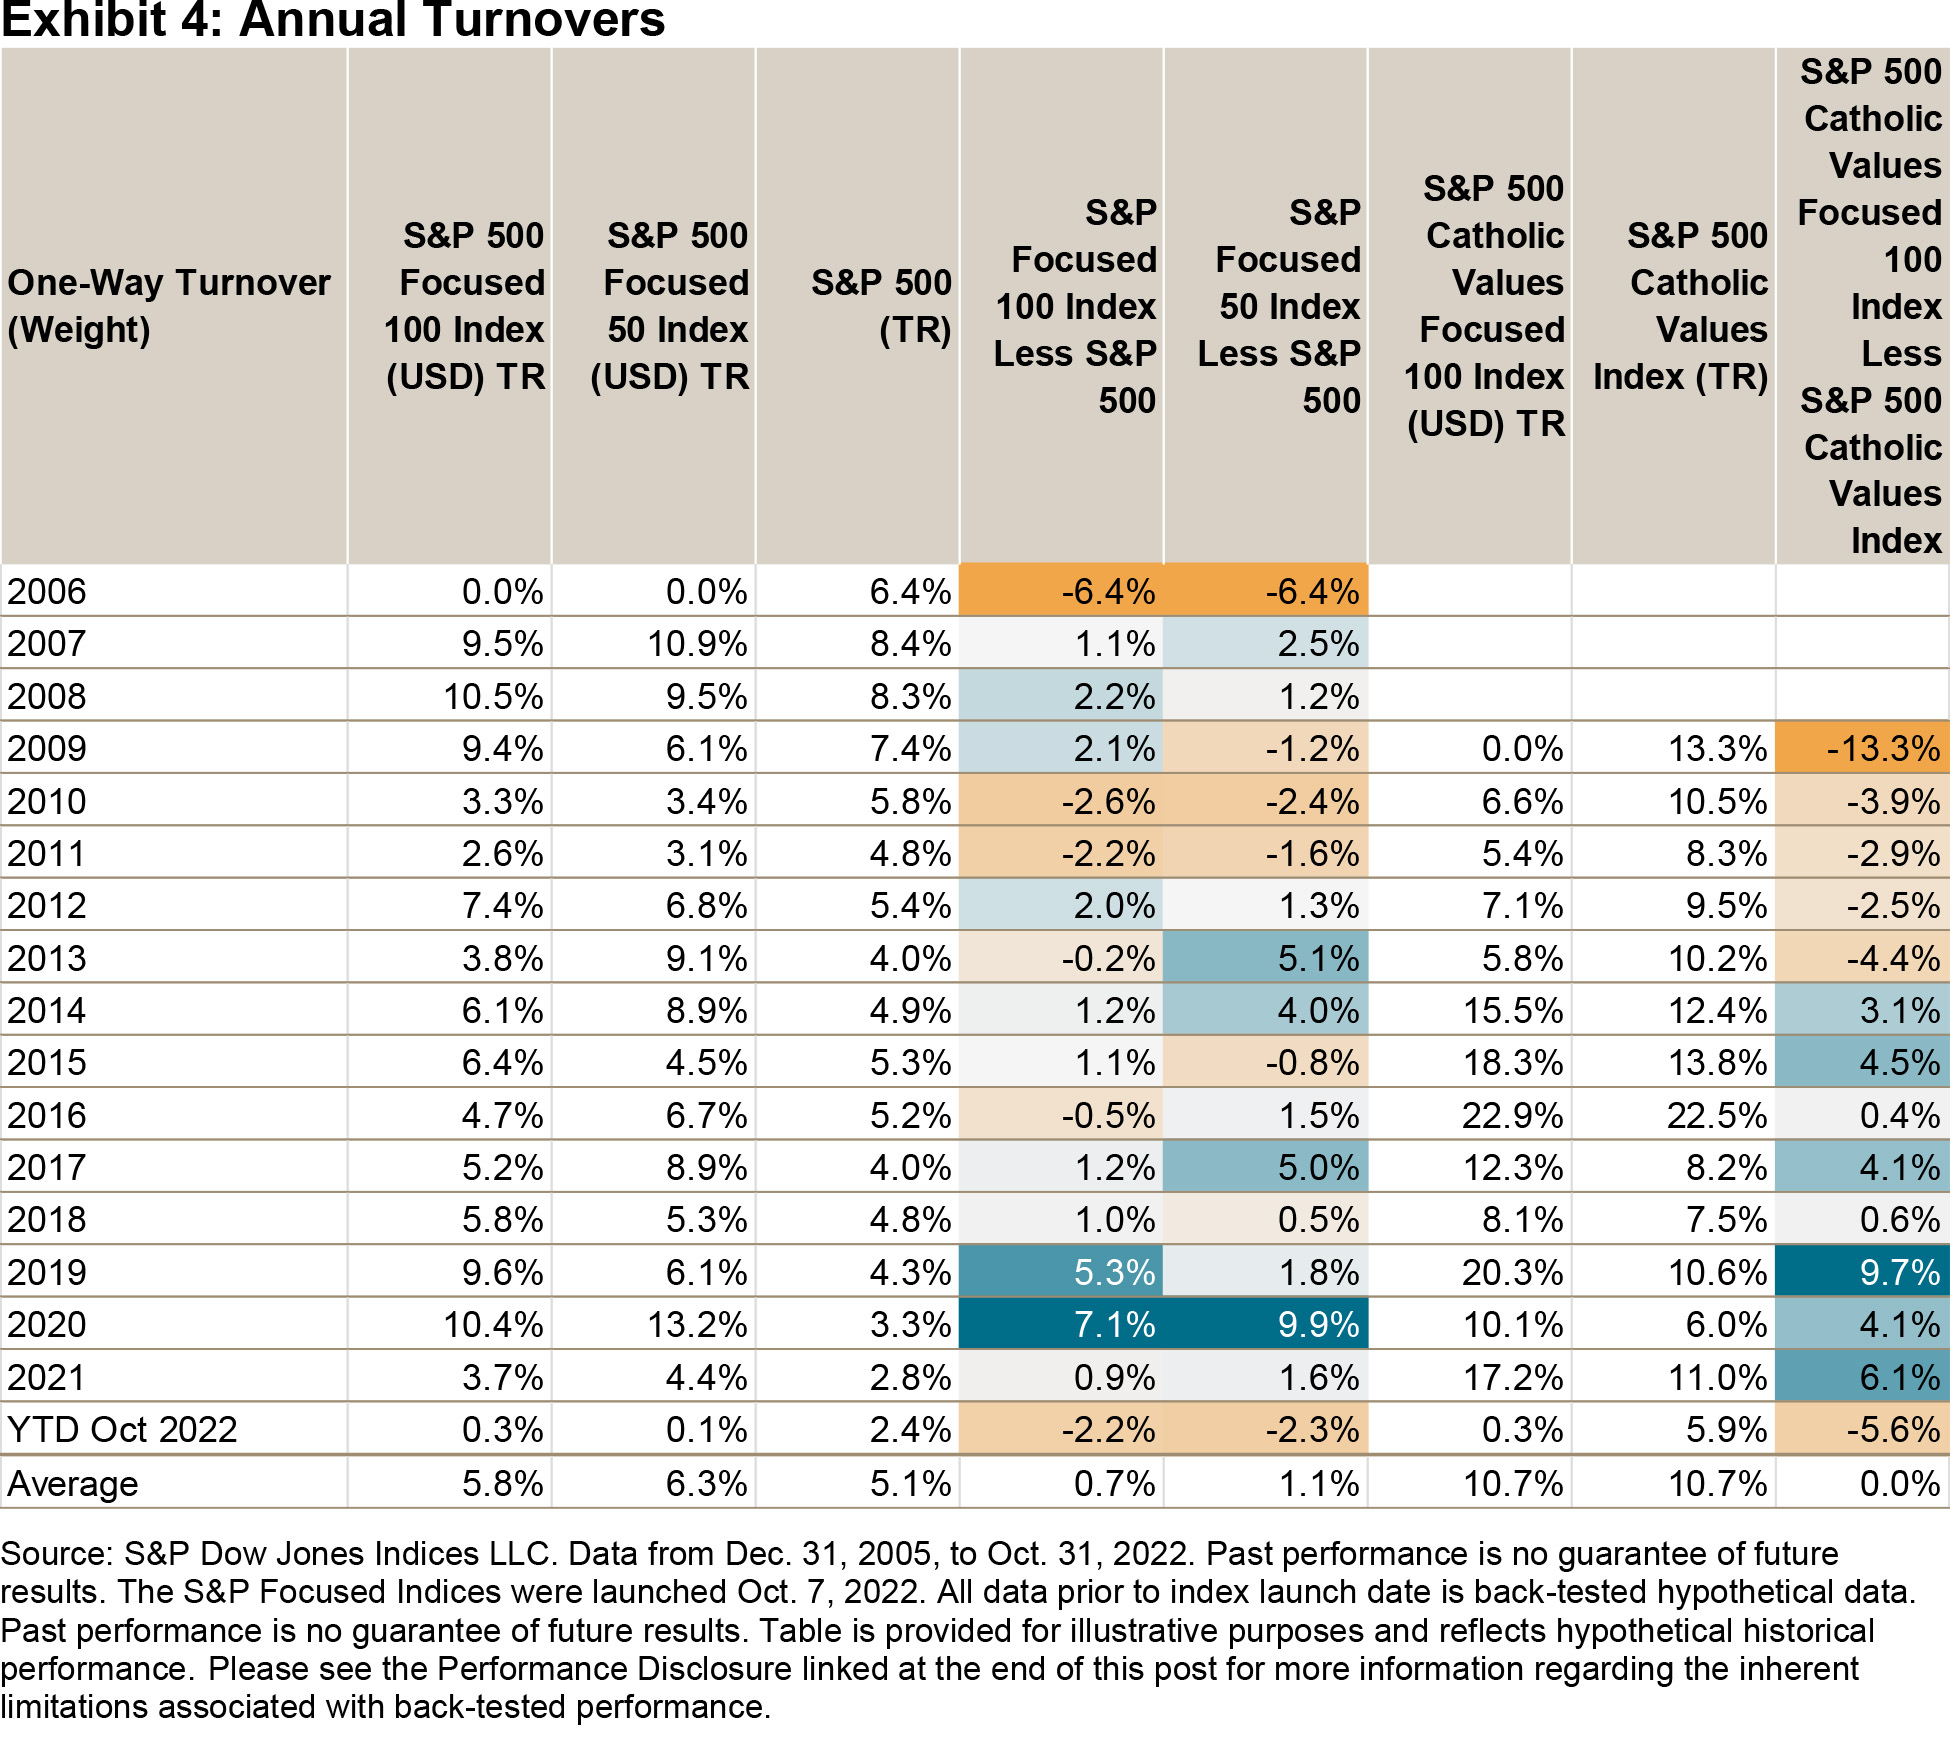
Exhibit 4 shows that the S&P Focused Indices’ construction provided similar turnover figures as their benchmarks, historically.

As a result, the S&P Focused Indices’ construction may be relevant for direct indexing managers looking to achieve similar sector and industry group weights as their respective underlying indices, but with fewer names.


The posts on this blog are opinions, not advice. Please read our Disclaimers.

Measuring Megatrends with Indices

How do the S&P Kensho New Economies track long-term transformational trends? S&P DJI’s Anu Ganti and State Street Global Advisors’ Dan Braz take a closer look at how machine learning and a unique methodology may be construed as a fusion of active/passive in a rules-based framework.

The posts on this blog are opinions, not advice. Please read our Disclaimers.

Transparency, FTX, CeFi and DeFi

Contributor Image
Sharon Liebowitz

Former Head of Innovation

S&P Dow Jones Indices

By now, the news in early November about the collapse of FTX, one of the largest global cryptocurrency exchanges, is sinking in. At S&P Dow Jones Indices, we often discuss the challenges of the cryptocurrency ecosystem and its risks across multiple dimensions. These include asset-level risks, technology risks, market risks and regulatory risks, as well as unknown and sizeable systemic risks. As the fate of SBF (Sam Bankman-Fried) and his FTX exchange get sorted out by the judicial system and the court of public opinion, one thing most can agree on is that they never saw this coming.

This opaque area within the crypto ecosystem could use some clarification. While the technology surrounding digital assets creates transparency—with its decentralized, secure and immutable ledgers—the surrounding ecosystem is not always transparent.

Exchanges potentially lack transparency. There are now hundreds of exchanges that trade 24/7 globally, and not all operate at the same standard; i.e. technology, governance, etc. As the FTX collapse unfolded, S&P Dow Jones Indices’ cryptocurrency price provider Lukka, quickly removed both FTX.com and FTX.US from its list of eligible exchanges.

Crypto exchanges can be divided into two categories—centralized and decentralized.

FTX, Binance and Coinbase are all examples of centralized exchanges (part of centralized finance or CeFi). Centralized exchanges (CEXes) are typically controlled by a single entity and operate using a central order book—the trades go through an intermediary; that is, the exchange.

Decentralized exchanges (DEXes), such as UniSwap or Aave, by contrast, have no intermediary—instead, they use smart contracts (pieces of software code) and an automated market maker (AMM) to execute transactions. Often, a DEX is set up as a decentralized autonomous organization (DAO), and decisions are made using governance tokens.

This brings us to the tokens associated with various exchanges. FTX created FTT1, a token that provided its holder a discount on FTX trading fees. FTT also could be staked (locked up) for additional rewards such as lower fees and higher rebates or used as collateral for derivatives or margin positions on FTX. Similarly, Binance exchange created BNB,2 a token that allowed discounts, payments and more on the BNB Chain ecosystem. (Coinbase is a publicly traded company that offers USD Coin, a stablecoin.)

By contrast, UNI3 and AAVE4 tokens govern their respective DEXes via on-chain governance. These token holders can propose and vote on protocol upgrades that allow it to be community led and minimize the need for trust.

All the above represent different types of exchanges and tokens, as well as different risks and values. However, they provide little transparency.

And that brings us to the role of indices. Indices bring transparency by measuring the performance of a market. Indices also provide multiple perspectives to track and potentially access a market.

The S&P Cryptocurrency Indices are no different. These indices reflect diversification, a methodology that screens index constituents on various levels, as well as an independent Index Committee, which has discretion over index decisions involving regulatory, structural or legal issues.

FTT, BNB, UNI and AAVE are all constituents of the 50-coin S&P Cryptocurrency LargeCap Index,5 though only BNB is greater than 1% of its makeup as of publication date. The FTX incident shines a light not only on the benefits of diversification, but also on the relative transparency of decentralized finance.

1 https://help.ftx.com/hc/en-us/articles/360027645972-FTX-Token-FTT-FAQ

2 https://www.binance.com/en/bnb

3 https://uniswap.org/governance

4 https://app.aave.com/governance/

5 S&P Dow Jones Indices, as of Nov. 18, 2022.

The posts on this blog are opinions, not advice. Please read our Disclaimers.

What Is SPIVA? A Closer Look at 20 Years of the Active vs. Passive Debate

Explore key takeaways from two decades of the Active vs. Passive debate as S&P DJI’s Tim Edwards and Benedek Vörös pull back the curtain on the SPIVA Scorecard and examine how active managers stack up to their benchmarks.

The posts on this blog are opinions, not advice. Please read our Disclaimers.