Get Indexology® Blog updates via email.

In This List

S&P 500 Decarbonization: Drawing the Path to Net Zero

This Time It Was Easy: SPIVA Canada

Dissecting the Divergent Performance among Latin American Fund Managers

U.S. Dollar Strength Catches Up with Commodities

New Crypto Indices Designed for the Asia Market

S&P 500 Decarbonization: Drawing the Path to Net Zero

Contributor Image
Maya Beyhan

Senior Director, ESG Specialist, Index Investment Strategy

S&P Dow Jones Indices

As reported in S&P DJI’s Climate and ESG Index Dashboard, climate indices can include both absolute and benchmark-relative goals. Absolute goals could include, for example, a certain target level of weighted average emissions among index constituents, while a relative goal might insist on an improvement in comparison to a benchmark such as the S&P 500®. The cost in terms of active share and tracking error for a climate index achieving these goals can have a direct dependency on the changes that take place in the benchmark itself.

For example, if there is an overall reduction in carbon emissions at the benchmark level, a related climate index might more easily meet its absolute carbon goals. It may, however, become more difficult to achieve relative goals, as the opportunity set for improvement narrows.

The S&P 500 offers a case study. Exhibit 1 shows the historical level of the index’s weighted average carbon intensity (WACI), as measured on a 12-month trailing basis since 2007. The series has had a downward slope, decarbonizing by a cumulative 39% in the past 15 years.

A closer look at the notoriously carbon-intensive Energy sector provides additional color on sources of the decline shown in Exhibit 1. Exhibit 2a shows the historical change in WACI for the S&P 500 Energy and the sector’s total weight in the S&P 500. Global energy demand fell by 4% in 2020 due to the COVID-19 pandemic,1 leading to a reduction in energy-related emissions of 6.2% (from 2019 levels). However, global energy demand increased in 2021, more than offsetting the earlier contraction and pushing the S&P 500 Energy WACI back above its 2019 levels.

Exhibit 2a also illustrates the significant decline in the weight of the Energy sector in the S&P 500 over the past 15 years, from 10.9% in 2007 to only 2.7% at the end of 2021. As a result, there was a consistent, material drop in the aggregate contribution to the overall S&P 500 WACI from the Energy sector (see Exhibit 2b).

Consider the S&P 500 Net Zero 2050 Paris-Aligned ESG Index, whose methodology incorporates an absolute target of self-decarbonization by 7% annually, and a benchmark-relative target of a 50% reduction in index-weighted WACI each quarterly index rebalance (relative to the S&P 500). The first target is likely to be relatively easier to maintain in years when the S&P 500 observes a 7% or more decarbonization itself, especially if such reduction is broadly echoed across all constituents. However, in years when the S&P 500 fails to decarbonize by 7% or more, the climate index may be required to increase its active share to hit its annual decarbonization target, with the consequence of higher expected tracking error after the rebalance.

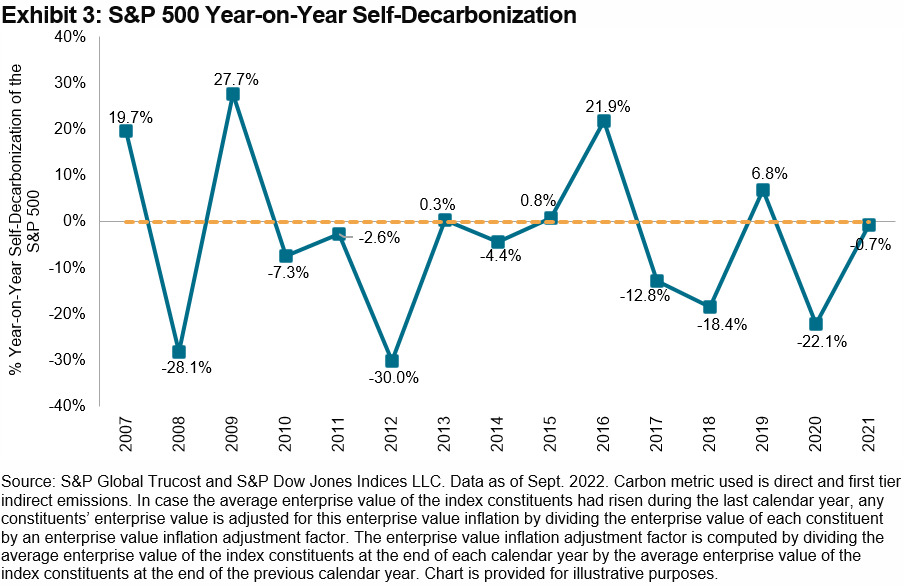
Exhibit 3 shows the annual change in the S&P 500 WACI over the same period studied in Exhibit 1. In only 5 of the 14 years did the benchmark decarbonize by 7% or more, while in 6 of the 14 years, benchmark carbon intensity actually increased.

Such examples highlight the importance of the rate of benchmark self-decarbonization when thinking about the prospects for the relative performance of climate indices and the potential drivers of change. A detailed look at the S&P DJI’s suite of ESG indices’ benchmark-relative improvements in climate metrics is now offered on a quarterly basis via our newly launched Climate & ESG Index Dashboard.

Register here to receive quarterly insights and performance attributions for our range of flagship S&P ESG and Climate Indices.


1 Global Energy Review 2021: https://iea.blob.core.windows.net/assets/d0031107-401d-4a2f-a48b-9eed19457335/GlobalEnergyReview2021.pdf

The posts on this blog are opinions, not advice. Please read our Disclaimers.

This Time It Was Easy: SPIVA Canada

Contributor Image
Joseph Nelesen

Senior Director, Index Investment Strategy

S&P Dow Jones Indices

Each time SPIVA® results are released, we are naturally asked to explain why a certain portion of active managers underperformed in any given fund category. Sometimes, management strategies and market moves defy simple explanations, but at other times an explanation can be plain as day. For actively managed equity funds in Canada, a recent turn to outperformance seems to be attributable to one single, simple and highly creditable example of stock selection.

For context, as of June 30, 2022, 43% of active Canadian equity funds underperformed over the previous 6- and 12-month periods; the best 12-month result since 2013. As shown in Exhibit 1, we find that one large-cap stock alone contributed nearly half (-4.4%) of the S&P/TSX Composite Index’s 9.9% H1 2022 decline.

The culprit was online retailer Shopify, which declined by 76% in the first half of 2022. Shopify’s rise and fall was unusually rapid, surging from a 1% weight in the S&P/TSX Composite Index to 8%—then becoming the largest issue in the index—in just two years ending December 2021. It then fell to a position outside the top 10 in just 6 months. As shown in Exhibit 2, other large weights in the S&P/TSX Composite Index have been relatively stable over time: the exact same names that comprised the top five in June 2017 were again the top five in June 2022.

Actively managed Canadian equity funds might have been forgiven for hopping on board Shopify’s rise and then consequently suffering during its downturn (they would not have been alone). However, previous experiences with the infamously precipitous rise and falls in market cap for Nortel and Blackberry-maker RIM may have taught them a valuable lesson. Exhibit 3 shows that Canadian market participants owned an average of 30% of the other largest constituents’ shares from 2019 through 2021, but Shopify was relatively under-owned, with less than 10% of its shares held by Canadians.

A judicious reluctance to join in on the exuberance over a single internet-related security may also explain the higher rates of active fund underperformance in Canada observed in during the later stages of Shopify’s ascent.1 Of course, its smaller market weight today means that there is a less material opportunity to benefit from the exact same trick in the remainder of 2022.

1 Our SPIVA Canada Year-End 2021 Scorecard reported 89% of actively managed Canadian Equity funds underperformed the S&P/TSX Composite Index over the three years ending Dec. 31, 2021.


The posts on this blog are opinions, not advice. Please read our Disclaimers.

Dissecting the Divergent Performance among Latin American Fund Managers

Contributor Image
Anu Ganti

U.S. Head of Index Investment Strategy

S&P Dow Jones Indices

Lessons from the SPIVA Latin America Mid-Year 2022 Scorecard

The semiannual S&P Indices Versus Active (SPIVA®) Scorecards1 measure the performance of actively managed funds against their corresponding benchmarks in various markets around the world. According to the latest SPIVA Latin America Mid-Year 2022 Scorecard, the YTD performance among active managers across Latin American countries varied significantly.

Chilean equity managers fared the worst in the region, with only 6% of actively managed funds outperforming the S&P Chile BMI. Brazilian Equity managers fared a bit better, with 43% of funds outperforming. Meanwhile, Mexico was a rare bright spot, with 63% of funds beating the local benchmark. One explanation for the stark range in outperformance rates is provided by the overall environment for stock selection. Only 16% of stocks in the S&P Chile BMI outperformed the capitalization-weighted S&P Chile BMI itself, while a higher proportion, 39% of constituents in the S&P Brazil BMI outperformed their benchmark and a full 66% of constituents in Mexico’s S&P/BMV IRT outperformed. Exhibit 1 compares these figures to the percentage of outperforming actively managed equity funds, illustrating a correspondence that suggests in Chile especially, the outperformance of the largest names made it harder for stock pickers to beat the benchmark.

In addition to mixed performance results, Latin American countries also differed in their survivorship rates, as shown in Exhibit 2. After 10 years, approximately 70% of Brazil Equity, Brazil Corporate Bond and Chilean Equity funds no longer existed, with Brazil Corporate Bonds experiencing a steep downward trend after year five. In contrast, Mexico Equity Funds fared much better, with 78% of funds still in existence after 10 years, mirroring their relatively lower long-term underperformance rate compared to the other categories.

Accompanied by the higher volatility in the region, higher stock-level dispersion across countries also led to greater fund selection risk this year, particularly in the Brazil Equity category and especially among Brazil mid-/small-cap funds, with one-year interquartile ranges of 11% and 18%, respectively, as Exhibit 3 illustrates. In these categories, the performance of the “average” fund is perhaps a poor representation of the experience of most funds—some did much better, and others much worse.

The divergent performance of equities across Latin American countries is consistent with the divergent performance of active managers within these countries, highlighting the unique challenges faced in each region. For more insights on Latin America, you can access the latest report here.


1 For more information, see SPIVA Scorecards: An Overview. https://www.spglobal.com/spdji/en/education/article/spiva-scorecards-an-overview

The posts on this blog are opinions, not advice. Please read our Disclaimers.

U.S. Dollar Strength Catches Up with Commodities

Contributor Image
Fiona Boal

Managing Director, Global Head of Equities

S&P Dow Jones Indices

U.S. dollar strength caught up with commodities in September, with the benchmark S&P GSCI falling 7.8%. Almost all physical commodities are priced in USD, and a stronger USD has historically correlated to weaker commodity demand and lower commodity prices. But the S&P GSCI is holding onto a 21.8% YTD gain despite the USD strength, energy prices cooling off substantially and slowing economic growth proving a headwind for industrial metals.

The S&P GSCI Natural Gas fell 26.1% over the month, the worst loss in September for an S&P GSCI constituent. In the European power market, there was also a correction in performance, with the S&P GSCI German Power (Yearly) ending the month 21.2% lower. The challenge in Europe to decouple the price of electricity from the price of natural gas is ongoing, and the impact of imported supply-driven inflation is being felt in every corner of the economy.

News late in the month that the OPEC+ group of oil producers was considering output cuts of more than 1 million barrels per day was not enough to support petroleum prices over the month, with the S&P GSCI Petroleum continuing its decline, ending the month 9.4% lower. Inventories of both crude oil and refined fuels remain at multi-decade lows in the major consumption centers, but a cyclical downturn is forecast to stabilize and rebuild them.

Many of the supply chain issues that plagued the global economy during the COVID-19 pandemic have started to abate; freight costs have cooled, important shipping routes have been detangled and, with the exception of certain regions in China, major industrial hubs have fully reopened. At the same time, market sentiment has wavered and the risk of a coordinated global economic downturn has risen. Within this environment, it is understandable that industrial metals have struggled. The S&P GSCI Industrial Metals is down 18.7% YTD and nickel is the only individual metal hanging onto positive performance over the first nine months of the year.

With the U.S. Fed continuing to hike rates aggressively to combat high inflation, the S&P GSCI Gold continued to suffer in September, dropping another 2.9% after falling the same amount in August. Gold typically has the most negative correlation to the U.S. Dollar and the third quarter was no exception. The S&P GSCI Silver was a bright spot within the precious metals, rising 6.7% for the month, but it is still trading near the lows for the year.

The S&P GSCI Agriculture was flat for the month due to highly divergent moves among the constituents. Wheat prices rose 11% despite the largest Russian crop ever, as a global drought and supply chain issues hit grain production and transportation. Global stocks for wheat are the lowest since the 2017/2018 season. Softs fell 9%, with the S&P GSCI Cotton dropping by 24.4% and completely reversing the move from August, with prices now trading near the year’s lows.

The posts on this blog are opinions, not advice. Please read our Disclaimers.

New Crypto Indices Designed for the Asia Market

Contributor Image
Sharon Liebowitz

Former Head of Innovation

S&P Dow Jones Indices

Cryptocurrencies were designed to be decentralized and borderless, and different regions have different rates of adoption and use. In Asia, a new report by Accenture titled “Digital assets: Unclaimed territory in Asia”1 reported that 52% of affluent investors held digital assets as of Q1 2022, and the percentage was expected to rise to 73% by year-end 2022. The report also noted that over 80% of Singapore’s market participants demonstrated a strong interest in digital assets.

According to a recent article in the Wall Street Journal,2 Singapore’s status as a crypto hub grew when its rival, Hong Kong, lost some appeal when China cracked down on crypto trading and mining in 2021. Many established firms quickly relocated to Singapore.

With crypto innovation and investor interest plus excitement around the upcoming Token2049 Singapore conference in September 2022, we see Asia—and Singapore specifically—shine as a crypto hub. To that end, we are preparing to launch new indices specifically designed for the APAC market.

The first wave of the launch will include two indices:

S&P DJI’s independent indices have a long track record of bringing transparency to a wide range of markets across asset classes and geographies, and we believe they can do the same for this emerging asset class in Asia.

The first index, S&P Cryptocurrency Top 10 Index (Singapore Close), is designed to measure the performance of the largest 10 cryptocurrencies by market capitalization.3 It uses a 9PM Singapore close to capture trading in the Asian market. Just as the stocks in the S&P 500® make up about 80% of the total U.S. equity market cap, this new index represents approximately 85% of the S&P Cryptocurrency Broad Digital Market (BDM) Index as of September 2022.

One feature of this index is a custodian screen, which may enhance investability by requiring all coins to be held by at least two institutional-grade custodians. A custodian screen helps address the many challenges of cryptocurrency custody. We have touched on some of these issues in an earlier blog. As part of the index methodology, each constituent coin must be covered by a minimum of two custodians that demonstrate both appropriate technology security—either multi-party computing (MPC) or Multi-Sig—and information security standards, as defined by SOC II or ISO27001. Appropriate custody makes it easier for asset managers to hold and invest in the coins.

For those looking to mitigate volatility in the cryptocurrency market, we are also providing a risk control feature for this index: the S&P Cryptocurrency Top 10 Dynamic Rebalancing Risk Control 40% Index. This new index seeks to limit the volatility of the underlying S&P Cryptocurrency Index to a target level of 40% by adjusting the exposure to the underlying index and allocating to U.S. dollars. The index is rebalanced on a dynamic basis; that is, when the 10% threshold based on exposure is crossed (S&P Risk Control Indices are also available for traditional asset classes—equities, commodities and more).

For S&P DJI, these new indices represent one more way to bring transparency and leadership to this emerging asset class.

For additional details, please refer to S&P Digital Market Indices Methodology, S&P Risk Control Indices Methodology & Parameters for current parameters, and to the S&P Risk Control Indices section of the S&P DJI Index Mathematics Methodology.


1 Accenture Wealth Management, “Digital assets: Unclaimed territory,” 2022, p. 4.

2 Yu, Elaine and Caitlin Ostroff, “Crypto’s Collapse Deals New Challenge for Regulators in Singapore,” Wall Street Journal, Aug. 11, 2022.

3 Market capitalization corresponds to coin supply multiplied by coin price for cryptocurrencies.


The posts on this blog are opinions, not advice. Please read our Disclaimers.