Get Indexology® Blog updates via email.

In This List

Value’s Resurgence in the S&P/ASX 200

Tracking Trends with Indices

Equity Woes Continue

Defense and Volatility

Indexing the Performance of the E-Commerce Ecosystem

Value’s Resurgence in the S&P/ASX 200

Contributor Image
Sean Freer

Director, Global Equity Indices

S&P Dow Jones Indices

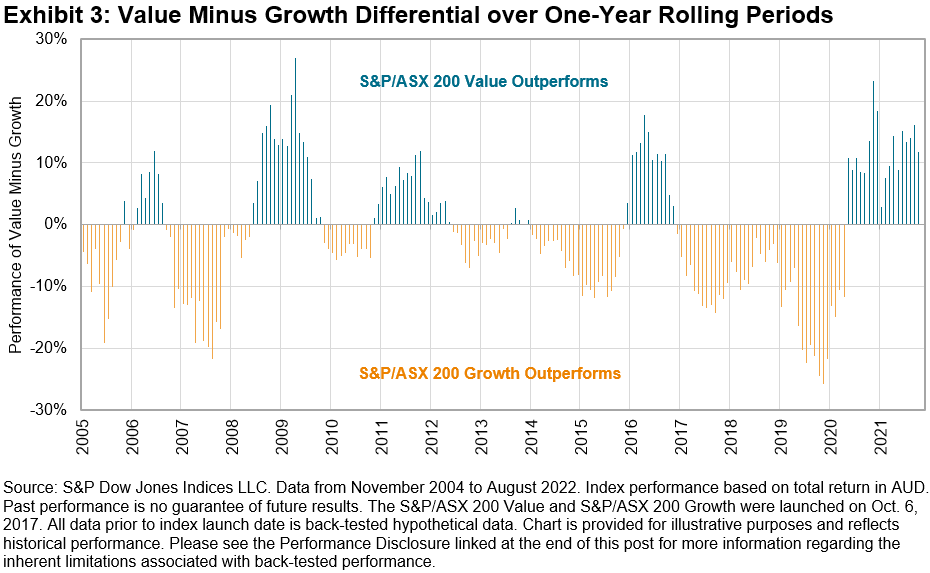
Those who implement style investing will have noticed a recent reversal of fortunes for the value approach following a long spell of underperformance. Since the inception of the S&P/ASX 200 Growth and S&P/ASX 200 Value in 2017, the back-tested approach has seen growth top value in 12 out of the past 17 calendar years.

However, with growth peaking in Australia and broadly across developed markets in 2020 (2021 in the U.S.), the rotation toward value is well underway. The digital innovation-led market with a prolonged period of loose monetary policy has given way to high inflation—now reaching multiple decade highs and tightening monetary policies by central banks. In this environment, future company earnings are discounted more heavily, and they are exposed to higher capital and other input costs, which hinders growth.

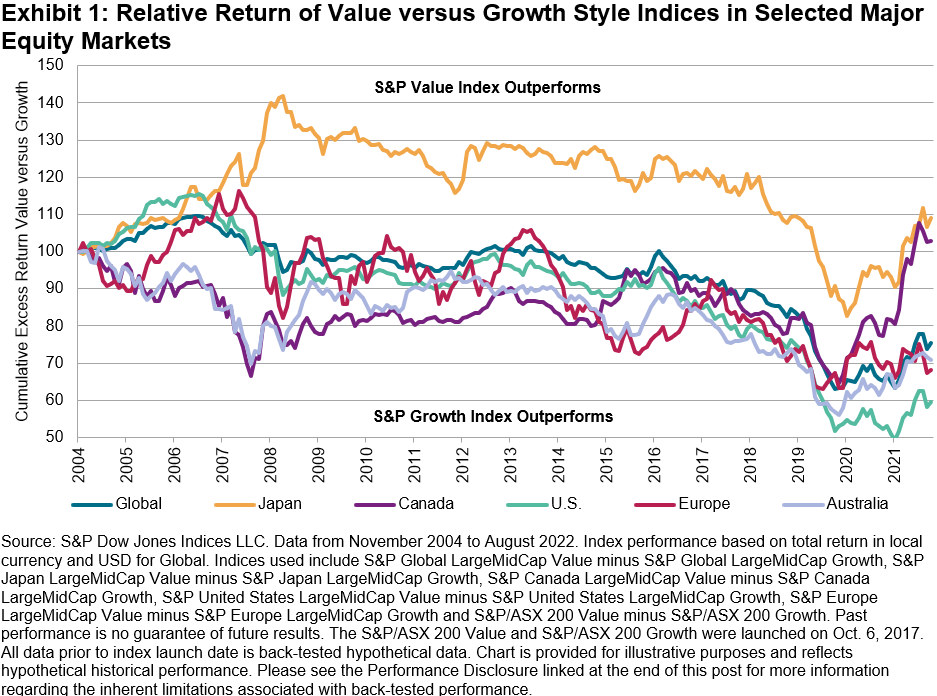
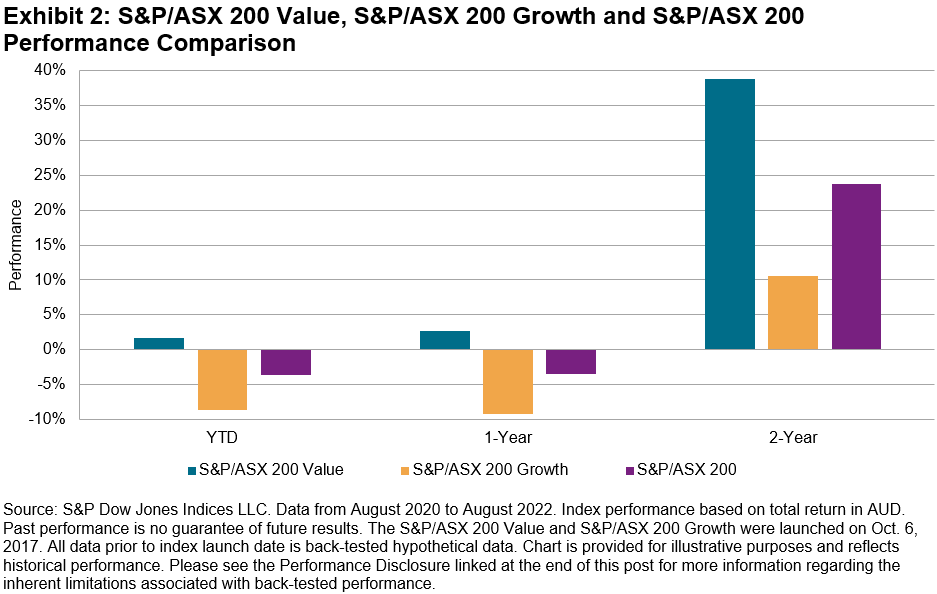
Value outperformed growth in 2021 across the board in developed markets. In Australia, value trumped growth by more than 7% and has accelerated its resurgence in 2022, outperforming growth by over 10% YTD and by more than 20% cumulatively over the past two years (as of Aug. 31, 2022).

Over the one-year period as of Aug. 31, 2022, value exhibited resilience in a falling market, with the S&P/ASX 200 Growth (-9.19%) and the broad market S&P/ASX 200 (-3.43%) declining, while the S&P/ASX 200 Value gained 2.64%. An outperformance spread of nearly 12%.

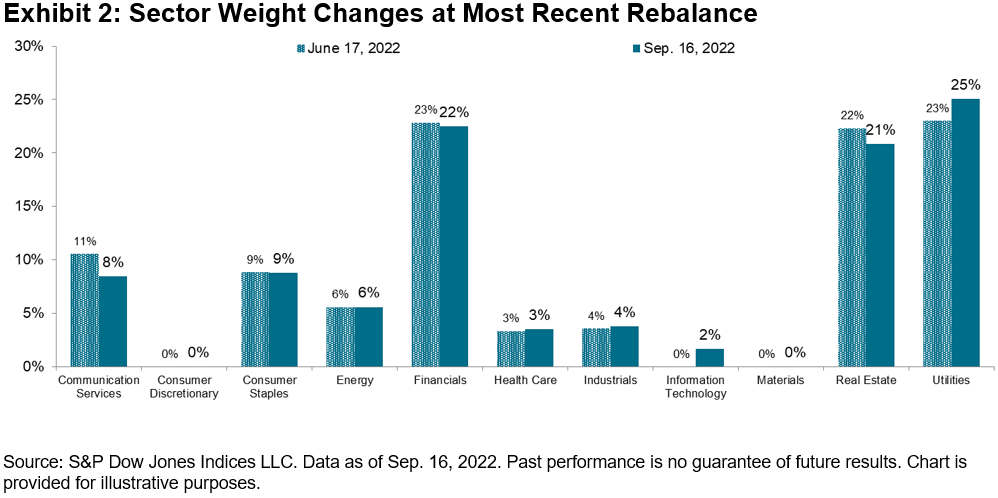
The S&P/ASX 200 Growth and S&P/ASX 200 Value consist of companies with pure growth and value characteristics, respectively, as well as companies within the broader S&P/ASX 200 categorized as “blend.” This style bias results in two distinctive indices from companies within the S&P/ASX 200. Exhibit 4 highlights the difference in sector weights between the value and growth approaches.1

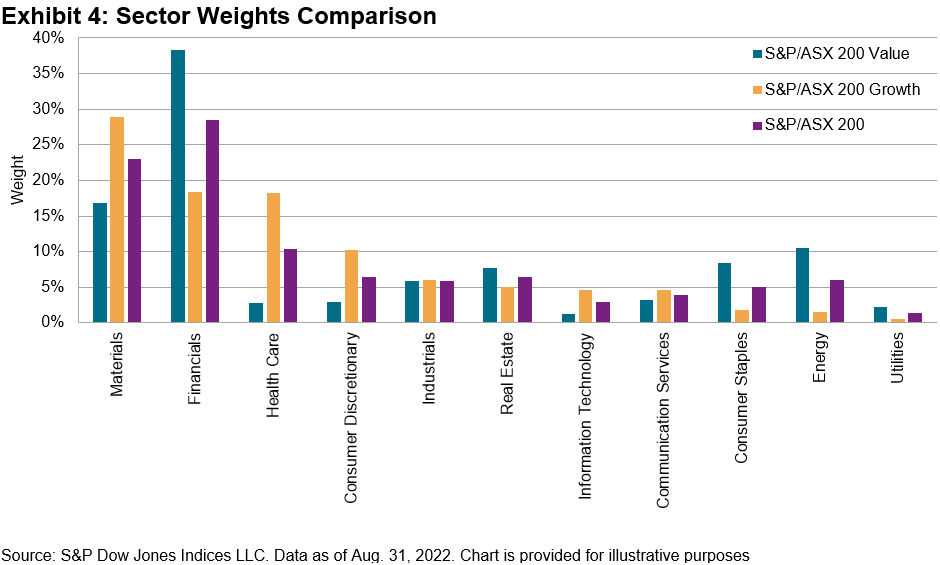
In the current market environment, we can see significant dispersion of returns among sectors, with the one-year difference as of Aug. 31, 2022, between the highest-performing sector (Energy 53.00%) versus the worst-performing sector (Information Technology -34.75%) at 87.75%. This spread is among the highest exhibited over one-year periods going back 10 years. The past 12 months have seen the outperformance of Energy over Materials, Consumer Staples over Consumer Discretionary and Financials over Health Care, and it has resulted in considerable relative gains for the value approach over the broad market.

As expected, the correlation between the growth and value investment styles has significantly lowered compared with longer-term averages. This also rings true in global markets, with value and growth indices in the U.S., Europe and Japan displaying similar dynamics over recent months—a value-led comeback, higher sector dispersion and lower correlation following a long period of growth outperformance.

Australian investors haven’t historically been as style aware with their domestic equity exposure compared to those in the U.S. and other developed markets. Given such distinctive performance characteristics, the S&P/ASX 200 Growth and S&P/ASX 200 Value offer a unique lens through which to evaluate market dynamics compared to the broad market S&P/ASX 200.

1 Please refer to the methodology document for S&P/ASX Indices for more information: https://www.spglobal.com/spdji/en/documents/methodologies/methodology-sp-asx-200-style.pdf.


The posts on this blog are opinions, not advice. Please read our Disclaimers.

Tracking Trends with Indices

How can indices help investors understand what’s driving market trends amid inflation, rising rates, and volatility? S&P DJI’s Anu Ganti and Hamish Preston take a closer look at key trends and  what they could mean for active management and asset allocation moving forward.

The posts on this blog are opinions, not advice. Please read our Disclaimers.

Equity Woes Continue

Contributor Image
Fei Mei Chan

Former Director, Core Product Management

S&P Dow Jones Indices

Canadian equities continued their decline, losing another 8.76% (through September 15, 2022) since the last rebalance of the S&P/TSX Low Volatility Index on June 17.  Characteristically for a falling market, Low Volatility outperformed (by 13 basis points), declining 8.63%.

As it had done in June, volatility again increased for every sector of the S&P/TSX Composite Index. Energy, Health Care and Technology were among sectors with the biggest hike in volatility.

Despite this, the latest rebalance for the S&P/TSX Composite Low Volatility Index (effective at the close of trading on Sep. 16, 2022) either maintained or added to positions in these sectors. The index screens for the lowest volatility at the stock level, so these results suggest that there are pockets of relative stability even within higher-volatility sectors.

Financials, Real Estate and Utilities continue to be the most overweighted sectors in the Low Volatility index.

The posts on this blog are opinions, not advice. Please read our Disclaimers.

Defense and Volatility

Contributor Image
Craig Lazzara

Former Managing Director, Index Investment Strategy

S&P Dow Jones Indices

As the equity market has waned and waxed in 2022, investor interest has naturally turned toward ways of mitigating portfolio losses. Some factor indices can serve this goal, but investors searching for a defensive strategy need to define their search carefully.

It’s natural to think that defensive strategies will be less volatile than the market as a whole, and this is a useful intuition. Some factor indices, in fact, have produced lower-than-market volatility with greater-than-market return. When such indices are combined with fixed income securities, the resultant efficient frontier often dominates combinations of fixed income with a cap-weighted market index.

That said, the essential requirement of a defensive index is not that it reduce volatility, but rather that it demonstrate a particular pattern of relative performance. Defensive factor indices aim to reduce losses in a declining market while also participating in rising markets. We often summarize this by referring to the “two Ps”—protection (in down markets) and participation (in up markets), while stressing that neither P is perfect.

Importantly (and counterintuitively), defensive indices are not necessarily less volatile than the benchmark from which they are derived, as Exhibit 1 illustrates.

The hypothetical factor index in the exhibit outperformed its hypothetical benchmark, although with higher volatility. Yet it is clearly a defensive index. When the benchmark rises, the factor is more likely to underperform than to outperform, and its average value added is negative. When the benchmark declines, the factor is more likely to outperform, and its average value added is positive. It delivers, in other words, on both Ps, participating in up markets and protecting in down markets.

Defensive indices will typically be less volatile than their parents. But not always. Investors seeking a defensive profile should take care not to rely on volatility statistics alone.

The posts on this blog are opinions, not advice. Please read our Disclaimers.

Indexing the Performance of the E-Commerce Ecosystem

Contributor Image
Claire Yi

Former Analyst, Strategy Indices

S&P Dow Jones Indices

Introduction to the E-Commerce Ecosystem

E-commerce is the abbreviation for electronic commerce, which is the purchasing and selling of goods and services, or the transmitting of funds or data, using the internet for the whole or part of a transaction. Usually, sellers utilize e-market platforms to open online storefronts, and buyers use the platform to shop for specific items. Sellers rely on technology companies to build infrastructures such as websites, analytics tools and cloud services. They also utilize social media to drive traffic, promote offerings and gain insights. Digital payment solutions enable buyers and sellers to close the transaction without offline interaction. These components together form the e-commerce ecosystem.

The history of e-commerce can be traced back to 1969, when Dr. John R. Goltz and Jeffrey Wilkins established the first e-commerce company, CompuServe.1 In the 1990s, many game-changing events in this industry happened, such as the arrival of the World Wide Web and the launch of online marketplaces like Amazon (1995), eBay (1995) and Alibaba (1999). PayPal rolled out the first e-commerce payment system to process fund transactions in 1998. Meanwhile, search engines such as Yahoo! and Google were established, which made online searching and marketing easier. Post-2000, e-commerce developed rapidly. UNITAD’s data shows that e-commerce’s share of global retail trade went from almost 0% 20 years ago to about 17% in 2020.2

The COVID-19 pandemic in 2020 forced most consumers to shift from offline to online shopping. However, in the past 18 months, e-commerce companies faced strong headwinds from the reopening of the economy, tightening regulation and lowered valuation under rate hikes.

Index Construction

S&P DJI recently launched the S&P Global E-Commerce Ecosystem Index, which is designed to track the performance of companies that have business exposure to e-commerce. In order to capture the whole value chain, the index identifies four business areas relevant to the ecosystem: online retail, social media, electronic payment and direct e-commerce support and solutions. Exhibit 1 shows the index weight breakdown of business areas.

We utilize FactSet’s Revere Business Industry Classification System (RBICS) data to select and assign scores to companies. Companies must generate at least 20% of revenue from e-commerce-related business or have an RBICS focus on any of the determined sub-industries (see details in the methodology). Then, companies will be assigned an exposure score of 1/0.75/0.5, depending on their aggregated percentage of revenue related to e-commerce (see Exhibit 2). Each of the RBICS sub-industries is mapped to one of the four business areas in the ecosystem (see details in Exhibit 5). The top 50 constituents are selected and weighted based on the product of total market capitalization and exposure score to balance the index capacity and exposure purity.

Exhibit 3 shows that e-commerce-related companies have experienced a challenging period since 2021. The index lost over 42% in the 12-month period ending July 31, 2022. From a country allocation perspective, 68% the index weight was allocated to companies in the U.S., and China had the second-highest weight at 17% (see Exhibit 4).

The recent drawdown was not unique to e-commerce companies; it prevailed in the growth sector. The S&P 500 Growth lost 28% in the first six months of 2022, and the Dow Jones Internet Composite Index lost 44% during the same period. Despite the performance headwind this year, e-commerce is not leaving our lives. In October 2021, Facebook announced its new endeavor into the Metaverse, which could introduce a new era for how people shop in the virtual world. The S&P Global E-Commerce Ecosystem Index is one possible way to track the evolution of e-commerce businesses in the long run.

1 Shiprocket, The History Of eCommerce & Its Evolution – A Timeline

2 UNITAD, How COVID-19 triggered the digital and e-commerce turning point

The posts on this blog are opinions, not advice. Please read our Disclaimers.