Get Indexology® Blog updates via email.

In This List

Putting the Pedal to the Metal: The S&P Global Core Battery Metals Index

Commodities Hit the Brakes in June

S&P QVM Top 90% Indices: An Examination of the June 2022 Rebalance

Introducing the First Global Voluntary Carbon Market Index

The S&P ESG Dividend Aristocrats Index Series: One Year Later

Putting the Pedal to the Metal: The S&P Global Core Battery Metals Index

Contributor Image
Rupert Watts

Head of Factors and Dividends

S&P Dow Jones Indices

While electric vehicles have been attractive to environmentally conscious consumers for several decades, in recent years, they have come into their own as innovation has made them more accessible and practical. With the current prices at the pump, now more than ever, consumers are turning to electric vehicles as a greener and more economical option. As Exhibit 1 shows, sales of “plug-in” electric vehicles are expected to grow significantly through 2026. As demand for electric vehicles and other technologies strengthens, so does the need for rechargeable batteries.

Booming Battery Metals Markets

Considering the current and anticipated demand for rechargeable batteries, markets for their input commodities have been booming. For market participants seeking to participate in this trend, S&P Dow Jones Indices (S&P DJI) recently launched the S&P Global Core Battery Metals Index. The index seeks to track global companies engaged in producing and mining three core battery metals: cobalt, lithium and nickel.

Partnership with S&P Global Commodity Insights

To develop this index, S&P DJI partnered with S&P Global Commodity Insights (S&P GCI). Given their expertise in metals and mining, S&P GCI played a significant role in defining the rules of the index.

They identified cobalt, lithium and nickel as the three core battery metals that the index would track via producing companies. These metals were selected since they are typically the key metals used in active cathode materials deployed in high-performance batteries.

To accurately capture the battery metals’ production values, the index sources data from S&P GCI’s Metals and Mining dataset. Provided via the S&P Capital IQ Pro platform, this industry-leading dataset includes over 4,500 mining companies and over 37,000 mining properties.

Methodology Overview

To be eligible for inclusion, companies must be a member of the S&P Global BMI. Additionally, companies must have been a producer of either cobalt, lithium or nickel for the previous year (as measured by S&P GCI’s Metals and Mining Dataset). All eligible companies are included in the index.

Qualifying companies are weighted proportionate to their production-value-to-revenue ratio. To calculate this ratio, the sum of the production value across the three battery metals is divided by the revenue from the previous year (in USD). Constituents are then ranked in ascending order so that the companies with the highest proportion of battery metal production are given the largest rank. Each company’s final weight is calculated by its rank divided by the sum of all ranks (subject to liquidity capping). In this way, the index overweights companies where the production of these core battery metals represents a significant portion of their business.

Statistical Analysis

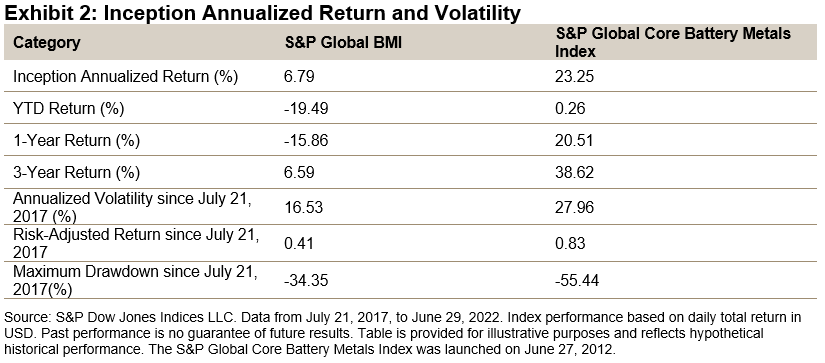
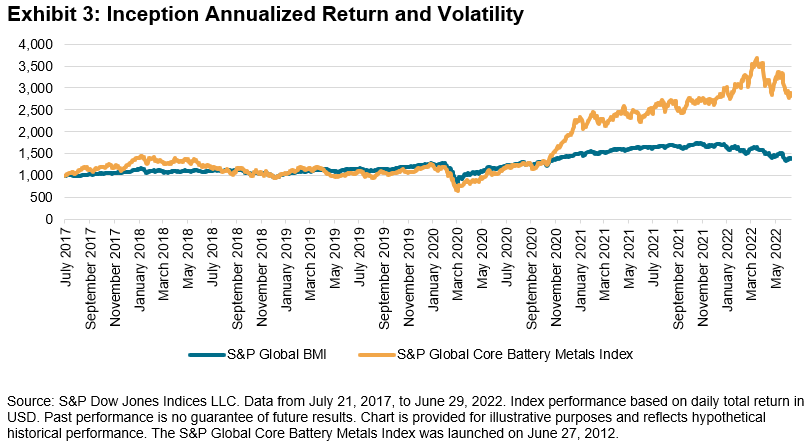
The first value date for the S&P Global Core Battery Metals Index was set as July 21, 2017, when enough companies were represented in the dataset. Since then, the index has earned an annualized return of 23.25%, outperforming its benchmark by almost 16.5%. Most of this outperformance was achieved in the last couple of years on the back of the booming metals markets.

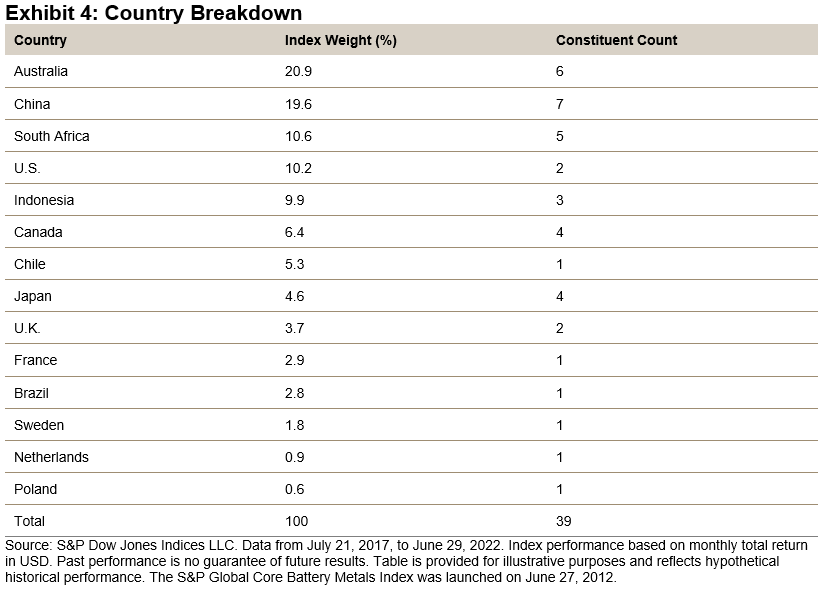
Let’s now examine the country breakdown for the S&P Global Core Battery Metals Index. As one might expect, the index weighs heavily toward Australia and China, the two top-producing countries for battery raw materials. However, the index has a strong representation across over a dozen counties (see Exhibit 4).

In two subsequent blogs, we will further explore the methodological details and index characteristics. In fact, our colleagues at S&P GCI will author the next blog, focusing on the Metals and Mining dataset that the index leverages to source battery metals’ production values. Stay tuned!


The posts on this blog are opinions, not advice. Please read our Disclaimers.

Commodities Hit the Brakes in June

Contributor Image
Fiona Boal

Managing Director, Global Head of Equities

S&P Dow Jones Indices

The prospect of higher interest rates, fears of a prolonged global economic slowdown and a strong U.S. dollar put the brakes on commodities prices in June. The S&P GSCI, the broad commodities benchmark, ended the month down 7.6%, taking YTD performance to 35.8%, still the best first half performance since 2008.

The deteriorating economic outlook trumped fears regarding the impact of sanctions on Russian oil supplies in June. The S&P GSCI Petroleum fell 4.6% over the month. However, the biggest correction in energy prices in June came in the form of a 33.3% decline in S&P GSCI Natural Gas. The fall in U.S. natural gas prices in June belied what remains a tight global gas market. Russia continued to severely limit gas supplies to Europe and various governments across Europe are intervening in the market by way of direct payments to households, financial support to failing utilities and orders to replenish storage ahead of winter.

One bright spot in the commodities markets in June was EU carbon emissions, with the S&P GSCI Carbon Emission Allowances (EUA) rallying 7.3%. Strength in the so-called clean dark spread, a measure of the profitability of coal-fired electricity generation incorporating the cost of offsetting production with carbon credits, has seen more coal being used in the power generation mix and hence more EUAs purchased for compliance. From a regulatory standpoint, there has been significant debate regarding possible reforms to carbon price control mechanisms in Europe, which may affect price discovery over the medium term.

Industrial metals had the worst first half of the year since the Global Financial Crisis. The S&P GSCI Industrial Metals fell 13.8% over the month and was down 12.1% YTD. Prices have plummeted, as worries about a slowdown in industrial activity across major economies have dovetailed, with slumping demand in China. Copper, the great economic bellwether, fell 12.4% over the month and ended the first half of the year down 14.7%.

Against a backdrop of aggressive central bank policy action and a strong U.S. dollar, gold has been unable to turn a trick so far in 2022, while silver has been battered by fears of weakening industrial demand. After some strength earlier in the year, the S&P GSCI Precious Metals ended the first half of the year down 2.7%.

By the end of June, S&P GSCI Agriculture had fallen 18.0%, since making a multi-year high on May 17, 2022. Most of the decline was attributed to wheat and cotton. Wheat prices have been pressured by the expanding harvest of winter wheat in the Northern Hemisphere and the prospect of getting grain shipped out of the Black Sea region improving. Like other demand-sensitive commodities, the risk of a looming recession weighed heavily on the cotton market.

A recovery in feeder cattle prices, buoyed by the correction in feed prices, helped the S&P GSCI Livestock eke out a modest gain in June.

The posts on this blog are opinions, not advice. Please read our Disclaimers.

S&P QVM Top 90% Indices: An Examination of the June 2022 Rebalance

Contributor Image
Wenli Bill Hao

Director, Factors and Dividends Indices, Product Management and Development

S&P Dow Jones Indices

This blog is the second in the quarterly blog series we recently introduced to provide transparency into rebalance adds and drops for our S&P Quality, Value & Momentum Top 90% Multi-factor Indices (S&P QVM Top 90% Indices). The S&P QVM Top 90% Indices seek to track constituents in the top 90% of their universe, ranked by their average multi-factor score (subject to constraints) and float-market-cap weighted.

Exhibits 1, 2 and 3 summarize the June 2022 rebalance adds and drops for these indices as well as the decile ranks of their individual quality, value and momentum scores. As a reminder, the 1st decile includes companies ranked in the top 10% of the universe (by their respective factor scores), the 2nd decile includes companies ranked in the next highest 10%, and so on through to the 10th decile.

S&P 500® QVM Top 90% Index Rebalance Adds/Drops

There were 18 adds and 14 drops in the June 2022 rebalance. Since the March 2022 rebalance, Cerner Corp and People’s United Financial Inc were removed from the index, as they were acquired by Oracle and M&T Bank, respectively. Additionally, Under Armour Inc. and IPG Photonics were removed from the S&P 500.

Based on the overall multi-factor score ranks, 17% of the adds ranked in the top half of the universe, driven relatively evenly by all three factors. Similarly, all three factors contributed in relatively equal proportions to drops. Of the drops, 36% were in the 10th decile based on quality and momentum scores, while 21% were in the 10th decile based on value score.

S&P MidCap 400® QVM Top 90% Index Rebalance Adds/Drops:

Seven companies were removed either due to acquisition events or movements across the cap range since the March 2022 rebalance. Therefore, there were seven more adds than drops in the June 2022 rebalance.

Momentum and quality scores primarily drove the drops from the index. Of the drops, 45% were in the 10th decile based on their quality score, 27% based on their value score and 55% based on their momentum score.

For the adds, 28% of companies had at least two factors ranked in the top half of the universe, and roughly one-half were in the top half based on their momentum score rank.

S&P SmallCap 600® QVM Top 90% Index Rebalance Adds/Drops:

There were 12 more adds than drops in the June 2022 rebalance. Renewable Energy Group Inc. was acquired by Chevron, while the other 11 companies were removed because they were dropped from the S&P SmallCap 600.

With respect to the adds, about half were ranked in the top half of the universe based on their momentum and value scores. In terms of the drops, most of the companies ranked quite poorly across all three factors. Of the drops, 22% were in the 10th decile based on quality score, 39% based on value score and 50% based on momentum score.

Sector Weights

Due to the index construction methodology, large deviations from the benchmark sector weight are uncommon. Exhibits 4, 5 and 6 compare the pre- and post-rebalance active sector weights for each of the three S&P QVM Top 90% Indices.

Exhibit 4 shows that the relatively large underweight in the Consumer Discretionary sector decreased slightly, as have the overweights in IT and Financials. However, the overweight in Health Care slightly increased.


For the S&P 400 universe, the largest underweights were in Health Care and IT, which decreased and increased, respectively. The largest overweight was in Financials, which slightly decreased. Consumer Discretionary, which had an overweight pre-rebalancing, flipped to a slight underweight after the rebalance.

For the S&P SmallCap 600 QVM Top 90% Index, Energy and Health Care had the largest underweight, at approximately -0.80%, while Financials had the largest overweight, at 1.33%, after the June 2022 rebalance.

The posts on this blog are opinions, not advice. Please read our Disclaimers.

Introducing the First Global Voluntary Carbon Market Index

Contributor Image
Jim Wiederhold

Former Director, Commodities and Real Assets

S&P Dow Jones Indices

The S&P GSCI Global Voluntary Carbon Liquidity Weighted is the first-to-market benchmark for the current performance of global voluntary carbon futures markets. The index is designed to track the CBL Nature-Based Global Emissions Offset (NGO) futures, underpinned by the Verified Carbon Standard registry, and the CBL Global Emissions Offset (GEO) futures, allowing delivery from CORSIA-eligible carbon offset credits from all three major registries (see Exhibit 1). Both futures contracts are traded at the CME Group. In contrast to compliant markets like the EU Allowances, voluntary carbon markets are not government mandated but go through stringent verification and validation channels to ensure underlying projects have an impact—whether that be reforestation, avoided deforestation, renewable energy, or carbon capture, among others.

The underlying futures contracts from the CME Group are some of the newest offerings in the carbon market. The speed with which liquidity has built in these contracts and the growth in issuance (and retirement) activity indicates a strong appetite for voluntary offset credits by the private sector (see Exhibit 2). A key instrument in the world’s ability to combat climate change and accomplish the energy transition from fossil fuels to electrification, the voluntary carbon marketplace will likely continue to gain importance while providing price discovery and ease of transacting for many market participants who want to verify their reduction of tons of CO2 equivalent.

This index may be of interest because market participants can see the price appreciation potential, or they would like to hedge their climate risk exposures. Due to the evolving nature of carbon markets, an important characteristic of the index is the flexibility to reweight, add or remove constituents at regular intervals to ensure that it can adapt over time.

Constituents in the index are weighted semiannually based on their current underlying liquidity. Minimum contract trading and liquidity rules for constituent inclusion, similar in design to the eligibility criteria used for the broad S&P GSCI, are also applied. Exhibit 3 highlights some of the important characteristics of the S&P Global Voluntary Carbon Liquidity Weighted Index.

This new index demonstrates S&P DJI’s continued efforts to provide innovative and new thematic alternative benchmarks in the commodities space. This theme offers exposure to the energy transition. With other major asset classes suffering heavy losses in the first half of 2022, the diversification benefits of alternatives have never been more apparent. For more information, visit our commodities investment theme page and check out S&P Global Commodity Insights’ energy transition resources.

The posts on this blog are opinions, not advice. Please read our Disclaimers.

The S&P ESG Dividend Aristocrats Index Series: One Year Later

Contributor Image
Luca Ramotti

Senior Analyst, Thematic Indices

S&P Dow Jones Indices

Dividends have historically provided a significant source of returns.  A recent blog stated dividends have become an important source of household income for U.S. investors and accounted for 7.3% of personal income as of Q1 2022, climbing from 3.2% in 1980. Over the same period, interest income has declined in share from 16.2% to 9.2%. In the current environment of rising inflation and interest rates, dividends may also provide the benefit as an inflation hedge.

One year ago, S&P DJI expanded its S&P Dividend Aristocrats® (DA) Indices with a new index series focusing on both dividends and ESG, targeting companies that couple consistent dividend growth with minimum ESG standards.1 Despite offering an additional layer of sustainability, the newly launched S&P ESG Dividend Aristocrats (ESG DA) Index Series have historically been able to offer low tracking error and a dividend yield comparable to those of the historical non-ESG version.

With one year of live history, we review the performance and characteristics of the S&P ESG Dividend Aristocrats Index Series.

Similar Performance and Low Tracking Error

2021 was challenging for stock markets globally, with the return of central banks tightening globally and rising inflation after years of declining yields. Nonetheless, the S&P ESG Dividend Aristocrats Index Series managed to ride this period delivering similar and often better performance compared to its non-ESG counterparts. Furthermore, despite some market headwinds, the S&P ESG Dividend Aristocrats Indices increased their dividend yield over the past 12 months, further emphasizing the resilience of such strategies.

Increasing Dividend Yield

Exhibit 2 shows the realized trailing 12-month dividend yield for the S&P ESG Dividend Aristocrats Indices against their respective S&P Dividend Aristocrats Indices and broad benchmark indices. Over the past 12 months, the S&P Dividend Aristocrats Index Series offered comparable dividend yields and delivered a sizable yield pick-up compared with the benchmark.

Exhibit 3 shows the difference between the trailing 12-month dividend yield from May 31, 2021, to May 31, 2022. Interestingly, the S&P ESG Dividend Aristocrats Indices’ dividend yield increased over the course of the past 12 months, not only in absolute terms but also compared with the standard S&P Dividend Aristocrats versions. Although the yield was still lower, the spread has been tightening. The current market dynamics may be driving these fluctuations in yield spreads. However, it is worth noting that with additional screens applied to the ESG versions of Dividend Aristocrats, yields of the S&P ESG Dividend Aristocrats Indices could remain at a discount to their non-ESG counterparts.

Underweight Utilities

In terms of sector representation, the results were quite mixed, with different S&P ESG Dividend Aristocrats Indices overweighting different sectors (see Exhibit 4). However, one common trait is that the Utilities sector was systematically underrepresented. The reason for the Utilities underweight may lie in the index methodology, which excludes companies involved in thermal coal, among others. Compared with 2021, we didn’t identify any major trends in sector weights that remained broadly similar in both versions.

Improvement in S&P DJI ESG Score

The S&P ESG Dividend Aristocrats Indices delivered an improvement in the S&P DJI ESG Scores, averaging at 16%. Improvements were quite pronounced for the U.S, developed markets and global indices. In eurozone, the impact of the ESG screens and filter was lower, but this can be explained by the non-ESG version already having a high S&P DJI ESG Score. Furthermore, we noticed a general improvement in the S&P DJI ESG Scores since the launch of the index, except for the eurozone, where the score remained consistently high.

One year after their launch, the S&P ESG Dividend Aristocrats Index Series succeeded in providing similar performance and dividend yield, while keeping an eye on sustainability, and the series has recently expanded with the launch of the S&P 500 ESG Dividend Aristocrats Index.

The S&P ESG Dividend Aristocrats Index Series is designed to identify companies that combine consistent dividend growth with sustainability characteristics, providing an additional option for long-term, income-focused investors that are looking for high quality, dividend-paying companies with sustainable business models.


1 For a more in-depth look into this index series, see https://www.spglobal.com/spdji/en/education/article/aligning-income-with-esg-the-sp-esg-dividend-aristocrats/.

The posts on this blog are opinions, not advice. Please read our Disclaimers.