Get Indexology® Blog updates via email.

In This List

S&P QVM Top 90% Indices: Looking under the Hood of the March 2022 Rebalance

Hedging Diversification Bets

Commodities Continued to March Higher Last Month

A Streamlined Approach to Multi-Asset with the S&P Target Risk Indices

Sizing Sectors

S&P QVM Top 90% Indices: Looking under the Hood of the March 2022 Rebalance

Contributor Image
Rupert Watts

Head of Factors and Dividends

S&P Dow Jones Indices

Since their launch in April 2021, the S&P Quality, Value, and Momentum Top 90% Multi-factor Indices (the “S&P QVM Top 90% Indices”) have been a great addition to our multi-factor lineup. These indices are designed to track companies in the top 90% of their respective underlying index universe, ranked by their multi-factor score.

To support this index series, we plan to publish quarterly blogs providing transparency into rebalance adds and drops. Exhibits 1, 2 and 3 summarize the March 2022 rebalance adds and drops for these indices, as well as the decile rank of their individual quality, value and momentum scores.

The 1st decile includes companies ranked in the top 10% of the universe (by their respective factor score), the 2nd decile includes companies ranked in the next highest 10%, and so on through to the 10th decile.

S&P 500® QVM Top 90% Index Rebalance Adds/Drops:

Since the December 2021 rebalance, Gap Inc. has been removed from the index as it moved to the S&P MidCap 400®, and IHS Markit has been removed since it merged with our parent company, S&P Global. This explains why there were 13 drops and 15 adds in the March 2022 rebalance.

Risk-adjusted return played a major role in the drops, with 61% in the 10th decile based on momentum score. Based on quality score, 30% of the drops were in the 10th decile, and based on value score, 38% were in the 10th decile.

Based on the overall multi-factor score rank, 40% of the adds ranked in the top half of the universe, mostly driven by quality and momentum.

S&P MidCap 400 QVM Top 90% Index Rebalance Adds/Drops:

Seven companies had been removed either due to corporate action related events or due to movements across the cap range since the December 2021 rebalance. Therefore, there were seven more adds than drops in the March 2022 rebalance.

Company fundamentals had a significant impact on the drops, as 75% were in the 10th decile based on value score. Based on momentum score, 50% of drops were in the 10th decile, and 25% were in the 10th decile based on quality score.

From reviewing the adds, 60% of companies had at least two factors ranked in the top half of the universe, and two-thirds were in the top half based on quality score rank.

S&P SmallCap 600® QVM Top 90% Index Rebalance Adds/Drops:

There were nine more adds than drops in the March 2022 rebalance, since nine companies had been removed either due to corporate action related events or movements across the cap range.

In terms of the drops, most of the companies ranked quite poorly across all three factors. Based on quality score, 44% of drops were in the 10th decile, 33% were in the 10th decile based on value score, and 33% were in the 10th decile based on momentum score.

With respect to the adds, about half were ranked in the top half of the universe based on momentum score.

Sector Weights

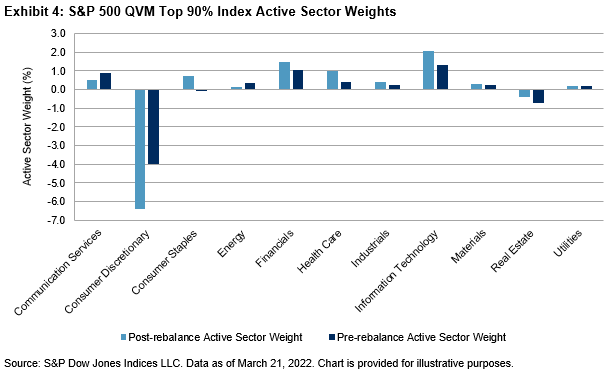
Due to the index construction methodology, significant deviations from the benchmark sector weight are uncommon. Exhibits 4, 5 and 6 show the pre- and post-rebalance active sector weights for each of the three S&P QVM Top 90% Indices.

Exhibit 4 shows that the relatively large underweight in the Consumer Discretionary sector has increased, as have the overweights in IT, Financials and Health Care.

For the S&P MidCap 400 universe, the largest underweights are in Health Care and IT, which increased and decreased, respectively. The largest overweights are in Financials and Consumer Discretionary.

For the S&P SmallCap 600 QVM Top 90% Index, Health Care has the largest underweight, at -1.35%, and Financials has the largest overweight, at 1.46%.

The posts on this blog are opinions, not advice. Please read our Disclaimers.

Hedging Diversification Bets

Contributor Image
Fei Mei Chan

Former Director, Core Product Management

S&P Dow Jones Indices

Low volatility strategies were designed for times like the ones we’ve experienced so far in 2022. Year-to-date through March 31, 2022, equities have struggled. In the U.S., the S&P 500® was down 4.6% YTD. The S&P Developed Ex-U.S. BMI and the S&P Emerging Plus LargeMidCap fared even worse, plummeting 5.6% and 6.7% YTD, respectively. But emerging markets have underperformed broader global benchmarks and the U.S. since long before the first quarter of 2022. In the past 25 years, the S&P Emerging Plus LargeMidCap gained 6.8%, while the S&P 500 was up 8.6%.

Hindsight, of course, is 20/20, and we don’t know how emerging markets will perform relative to their developed counterparts going forward. Often, people look to international markets to diversify their home-country investments—and with good reason. The correlation between the S&P 500 and S&P Emerging Plus LargeMidCap over the past 25 years was 0.74. Diversification may be the “only free lunch in finance,” but the performance of emerging markets does tend to be more volatile—49% more volatile than the S&P 500, to be precise.

What tend to be more reliable, however, are strategies that are explicitly designed to extract a certain pattern of returns relative to the broader market. In the past 25 years, the S&P BMI Emerging Markets Low Volatility Index returned 8.6%, compared with 6.8% for its underlying index.

By losing less when markets fall, low volatility strategies have typically outperformed over the long run. This phenomenon is observable universally across markets. The resulting performance pattern is captured in Exhibit 2, which shows the relative performance of the S&P BMI Emerging Markets Low Volatility Index (vertical axis) against the monthly performance of the S&P Emerging Plus LargeMidCap (horizontal axis).

In times of high stress, low volatility strategies tend to have more bandwidth to offer a buffer against volatility. This has proven to be true in the case of the S&P 500 and S&P 500 Low Volatility Index so far in 2022, declining 4.6% and 1.7%, respectively. It has been even more impactful in the case of emerging markets, where conditions are innately more volatile. In the first quarter of 2022, the S&P BMI Emerging Markets Low Volatility Index outperformed its underlying index by 11.3%.

The posts on this blog are opinions, not advice. Please read our Disclaimers.

Commodities Continued to March Higher Last Month

Contributor Image
Jim Wiederhold

Former Director, Commodities and Real Assets

S&P Dow Jones Indices

The S&P GSCI posted its best quarterly return in decades, as inflation continued to post the highest readings in decades. Commodities rose another 9.63% in March after an 8.8% rise in February. Geopolitical conflict and inflation were the two main reasons for the broad-based uptick in commodities prices (see Exhibit 1).

The S&P GSCI Energy continued to lead the way last month, up 12.47% in March. The uncertain supply situation from Russia, the world’s largest natural gas exporter and third largest oil exporter, led the U.S. to release a record amount of emergency oil from the Strategic Petroleum Reserve. Germany, highly dependent on Russian energy, initiated an emergency plan that could lead to energy rationing.

The S&P GSCI Agriculture rose 6.15%, as cotton and sugar rose by double digits, while coffee and soybeans dipped negative. The S&P GSCI Corn rose 8.44%, while the S&P GSCI Wheat rose 7.75% in March. Both grains were top exports from Russia and Ukraine but now shipments have been disrupted as the conflict continues and Black Sea ports have been sidelined. Egypt is highly dependent on wheat imports, with 80% coming from that region. Delayed shipments led the country to look to alternative countries such as the U.S. Wheat supplies in the U.S. are at their lowest levels in 14 years.

Within the S&P GSCI Industrial Metals, nickel recorded one of its biggest spikes in the history of the contract. After a wild ride with trading suspended after a massive short squeeze harangued the world’s largest nickel and stainless steel company, the S&P GSCI Nickel finished the month up 31.25%. The S&P GSCI Zinc rose 14.21%, as smelter production stalled and exchange stocks continued to move lower toward 15-year lows.

While all this volatility occurred in other sectors, the S&P GSCI Precious Metals quietly rose 2.70% due to its safe-haven status and a somewhat more cautious U.S. Fed tightening expectations caused tailwinds.

The posts on this blog are opinions, not advice. Please read our Disclaimers.

A Streamlined Approach to Multi-Asset with the S&P Target Risk Indices

Contributor Image
Melody Duan

Former Senior Analyst, Multi-Asset Indices

S&P Dow Jones Indices

Multi-asset strategies have been getting more attention the last few years from market participants seeking pre-packaged solutions to diversification. As more strategies evolve to be increasingly complex, including black-box allocation algorithms, multiple signals, and 10 or more components, we felt it was time to highlight a simpler, transparent index-based approach.

The S&P Target Risk Indices follow a target allocation strategy with preset allocations to equities and fixed income. The suite consists of four multi-asset indices, each corresponding to a particular risk level, designed to represent a risk spectrum from conservative to aggressive. Each index has varying levels of allocation to equities and fixed income aligned with their respective risk bucket—the more conservative indices have higher exposure to fixed income, while the more aggressive indices have higher exposure to equities (see Exhibit 1).

Designed to offer diversification by asset class and by region, the indices comprise seven liquid components across the U.S., developed and emerging markets representing equities and fixed income (see Exhibit 2).

While the stock-bond allocations are set, the methodology follows a set of rules to determine weights among the components within each asset class. Within fixed income, weights are distributed with 85% to the USD broad market and 15% to international aggregate.

Within equities, weights are based on the relative proportions of the float-adjusted market capitalization (FMC) of the reference indices for each component. For example, weights are first distributed between developed and emerging markets using the FMC of the S&P Developed BMI and the S&P Emerging BMI. We further distribute the developed market weight between the U.S. and ex-U.S. following the same procedure, and so on.

The addition of fixed income into an index can limit downside and may provide stability during bear markets. During the bear markets in 2002 and 2008, we see this come into play as the more conservative indices (conservative and moderate) produced better returns than the more aggressive ones (growth and aggressive), while the S&P Composite 1500® was the worst performer (see Exhibit 3). Stability in returns balances the relatively lower total returns during periods of strong equity performance.

The risk-reduction benefits of larger allocations to less volatile fixed income assets are more prominent when measured over the long term (see Exhibit 4). The risk-adjusted returns of the portfolios, defined as annualized return over annualized volatility, was highest in the conservative index (1.09) and decreased as the portfolios became more aggressive. While the aggressive index was not as risk efficient (0.54), it had the highest annualized return in absolute terms; market participants with higher risk tolerances typically have longer investment horizons and tend to place a higher focus on long-term capital growth.

In this blog, we highlighted the key features of the S&P Target Risk Indices, including the convenience of a simple and transparent pre-packaged multi-asset solution, the flexibility in choosing different risk profiles and the potential risk reduction provided by the addition of fixed income.

The posts on this blog are opinions, not advice. Please read our Disclaimers.

Sizing Sectors

Contributor Image
Anu Ganti

U.S. Head of Index Investment Strategy

S&P Dow Jones Indices

After peaks in S&P 500® concentration, the S&P 500 Equal Weight Index has tended to outperform, suggesting that there is a relationship between changes in concentration and the relative performance of equal weighting. But, does this relationship also occur at the sector level?

Using the historical adjusted HHI (Herfindahl-Hirschman Index), we’ve previously established that concentration tends to mean-revert in most sectors. Changes in concentration affect the relative performance of the equal-weighted versions of each sector. Exhibit 1 compares the relative performance of equal-weighted sector strategies to their adjusted HHI. Equal-weighted sectors tend to outperform after peaks in their sector concentration. This is particularly noticeable for Information Technology.

The negative correlations that we consistently observe in Exhibit 1 between monthly changes in adjusted HHI and relative equal-weighted performance illustrate an important point: changes in equal-weighted relative performance and changes in concentration are not two separate things, but two aspects of the same thing. If larger stocks outperform smaller ones, concentration will increase, and equal weight will underperform. Similarly, if smaller stocks outperform, concentration will decrease, and equal weight will outperform.

Recent levels of concentration vary across sectors, as we see in Exhibit 2, which plots the historical range of the adjusted HHI for the S&P 500 and its sectors, along with a bar chart showing current levels. The range of concentration also varies widely across sectors. For example, Industrials had the widest adjusted HHI range, while Utilities had the narrowest range among sectors. We can also infer that the adjusted HHIs for Energy, Industrials and Materials have been at historically low levels, while those for Information Technology and Consumer Discretionary have been relatively high.

Sector concentration has important implications for index weighting decisions. Since Information Technology and Consumer Discretionary’s adjusted HHIs are at historically high levels, equal weighting within these sectors might be worth considering rather than cap weighting, since concentration tends to mean-revert over time. In contrast, the adjusted HHIs for Energy, Industrials and Materials are at historically low levels. This means that cap-weighted sector strategies could be beneficial if these currently low concentration levels move upward.

The posts on this blog are opinions, not advice. Please read our Disclaimers.