Get Indexology® Blog updates via email.

In This List

Green Pools: Evolving ESG Trading Ecosystems

Going Electric: Introducing the S&P GSCI Electric Vehicle Metals

Face-to-Face with the Metaverse

Beyond Bitcoin: Why Digital Assets Need a Classification System

Holding Period Returns

Green Pools: Evolving ESG Trading Ecosystems

Contributor Image
Sherifa Issifu

Senior Analyst, U.S. Equity Indices

S&P Dow Jones Indices

Compared to the wide range of liquid, tradable instruments associated to more traditional benchmarks like the S&P 500®, the trading ecosystem of ESG-based investment products is still in its infancy. But, with the increased volume in listed futures linked to the S&P 500 ESG Index and S&P Europe 350® ESG Index, change is afoot.

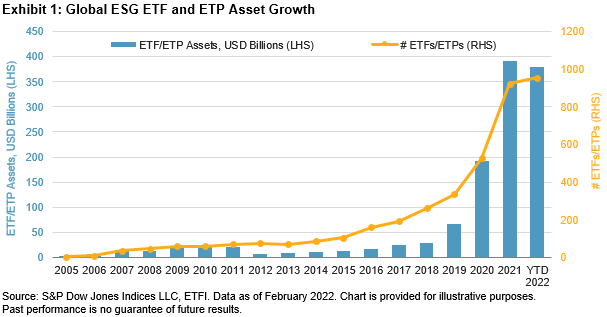
Of course, market participants have used exchange-traded vehicles for ESG investing for quite some time. The first ESG ETF launched 20 years ago, and there are now nearly 1,000 ETFs and ETPs listed globally with approximately USD 400 billion in assets as of February 2022, a massive contrast to the USD 2 billion in assets in 2005, according to ETFGI.

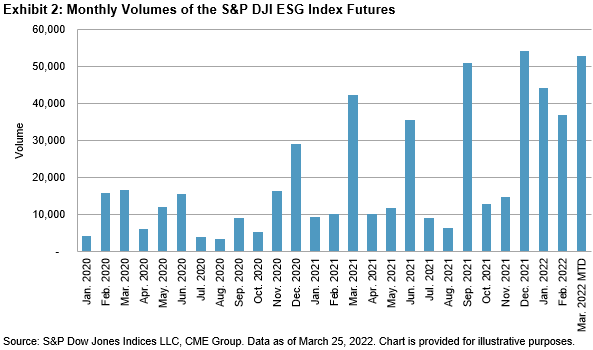
However, the growth of a true trading ecosystem around ESG products is a newer phenomenon. The futures based on S&P DJI ESG Indices have been at the forefront of the development: the S&P 500 variant has the highest dollar volume of any equity index-based ESG future, according to independent research by Graham Capital Management. As Exhibit 2 shows, volumes in S&P DJI ESG futures initially tended to cluster around quarter-end, when positions in front-month contracts are usually rolled or closed. But in 2022, this has begun to change, with more consistent trading through the quarterly cycle.

A 2021 research piece by CME Group titled “Answering the liquidity question” also pointed out that futures on indices of leading benchmarks can be transferred into their ESG futures variants, which means that market makers may be able to rely on global pools of futures, options and ETF liquidity to facilitate trading. Meanwhile, accompanied by the growth in liquidity, index options and ETF options linked to the S&P ESG Indices have also been introduced, providing investors with a broader range of risk management tools to participate, hedge or speculate within U.S markets through a “green” lens.

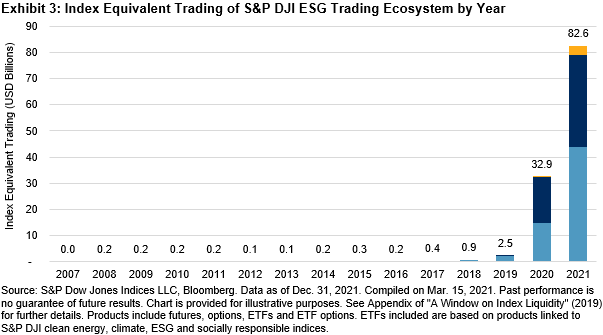
Highlighting the growing importance of ESG index-related futures, Exhibit 3 shows the annual dollar value in trading of all products within the S&P DJI ESG ecosystem, including ETFs, futures and options linked to ESG-themed indices. In terms of the economic value of traded index exposure, ESG futures now make up about 50% of the S&P DJI ESG trading ecosystem.

Why does this matter? If ESG is to become more mainstream, investors may look for ease and speed of execution comparable to traditional benchmarks such as the S&P 500. Futures and options can play an important role in strengthening investor confidence by creating new and deeper pools of liquidity, and by bringing the price scrutiny of a small army of arbitrageurs to “police” price discrepancies. A robust network of tradeable products may entice such arbitrageurs, and there are signs that precisely such a network has begun to develop around the S&P 500 ESG Index and the broader S&P DJI ESG ecosystem.

The posts on this blog are opinions, not advice. Please read our Disclaimers.

Going Electric: Introducing the S&P GSCI Electric Vehicle Metals

Contributor Image
Fiona Boal

Managing Director, Global Head of Equities

S&P Dow Jones Indices

As the world has begun to focus on new technology to aid in the global energy transition, electric vehicles (EV) are becoming more a part of everyday life. S&P Dow Jones Indices (S&P DJI) has collaborated with S&P Global Commodity Insights (SPGCI) to launch the S&P GSCI Electric Vehicle Metals, which seeks to track the metal commodities used in the production of electric vehicles.

The index was created in response to client demand for investable thematic strategies that offer exposure to the global energy transition. The energy transition represents both a significant challenge and opportunity to financial market participants, and nowhere is that dichotomy more obvious than in commodities markets.

The S&P GSCI Electric Vehicle Metals is a commodities futures-based index that is designed to reflect the performance of the tradeable metals used in the production of an EV. The expertise of SPGCI is leveraged for data to help determine the index constituents and production weights to ensure the index broadly reflects the relative metal usage in a representative EV. An important characteristic of the index is the flexibility to reweight, add or remove constituents at regular intervals to ensure that it can adapt to changes in EV technology and the launch and adoption of new metals futures contracts.

Constituents in the index are weighted based on their current metal usage in an average EV multiplied by the average per unit price for the metal, thereby representing the relative cost (or value) of the metal components in an EV. Minimum contract trading and liquidity rules for constituent inclusion, similar in design to the eligibility criteria used for the broad S&P GSCI, are also applied. Additionally, battery metal constituents, as defined by SPGCI but including cobalt and lithium, are capped based on contract trading volume and liquidity requirements to ensure that the index is both replicable and investable. Exhibit 1 illustrates the index constituents at launch and representative weights following the January 2022 rebalance. Exhibit 2 compares the recent performance of the index with the broad-based S&P GSCI.

Another important characteristic of the index is that it is based on commodities futures, not equities. The presence of equity market beta in thematic equity indices can make it difficult for these indices to truly reflect the performance of a particular theme or component of the real economy. It may not be possible to know which companies will win the battle for EV supremacy, but measuring the supply and demand dynamics and price performance of the underlying physical components that will be needed to build out the EV fleet is relatively straightforward.

The S&P GSCI Electric Vehicle Metals is the first S&P DJI index to incorporate data from SPGCI. It is exciting to bring together the expertise of two analytically independent S&P Global divisions on such an important and relevant segment of the investment landscape. Together, we hope to improve market transparency and offer market participants the ability to build unique investment strategies across a growing segment of the energy transition.

The posts on this blog are opinions, not advice. Please read our Disclaimers.

Face-to-Face with the Metaverse

Contributor Image
Srineel Jalagani

Senior Director, Thematic Indices

S&P Dow Jones Indices

Metaverse on the Runway to Reality

S&P DJI recently launched the S&P Kensho Metaverse Index, which is designed to track the growing group of technologies under the metaverse banner. The origin story of the metaverse can be traced back to a science fiction novel in the early ‘90s. Since then, it has seen many reincarnations under different names.1 Nonetheless, one core idea has remained constant through its iterations—an immersive virtual world that allows users across the globe to participate in activities and interact using their digital avatars.

How is the latest metaverse different than its predecessors? The aspirational features and related infrastructure development for the latest version of the metaverse are bringing the idea of a true digital world closer to reality than ever before. A confluence of advances in multiple fields, including but not limited to computational hardware, cloud software, content management, digital payments and flexible work schedules, have all played a part in the popular embrace of the metaverse. Some of the distinct features for this chapter of metaverse evolution that set it apart are as follows.2

  • Interoperability that underpins its scalability across multiple social platforms
  • A push to leverage both a faster decentralized internet (5G, Web 3.0) and untethered devices with sizable onboard computational power, to accommodate synchronous rendering and an unlimited number of users
  • Multi-disciplinary application areas that expand the scope and speed of its global acceptance; various estimates put metaverse-related revenue to hit approximately USD 800 billion by 2024, reflecting a CAGR of 13% since 20203

Focus on Core Building Blocks

Given the breadth of potential metaverse applications, our approach for constructing a metaverse index focuses on the following four pivotal themes, which in our view, form the backbone of the seamless metaverse experience.

  • XR Enabling Software and Applications: Software applications driving interactions within the high-capacity digital environments
  • XR Enabling Equipment: Hardware driving the immersive low-latency digital user experience
  • Infrastructure Technologies: Edge computing and cloud-based data infrastructure that will enable real-time capabilities
  • Digital Finance: Virtual payments and digital currencies that will facilitate frictionless commerce within the metaverse

Index Construction and Methodology Underscores Its Differentiation

With our metaverse index scope defined, we apply our innovative S&P Kensho Index construction methodology to generate the list of individual stocks eligible for inclusion. This procedure harnesses natural language processing techniques meshed with our experts’ oversight to define a rules-based approach in selecting U.S.-listed stocks whose business objectives and revenue disclosures include relevant text to the index’s focus areas. For our metaverse index, we limit the basket to companies whose core business is one of the four areas defined above, tailored to pick stocks essential to the theme. The S&P Kensho Metaverse Index has a relatively small overlap with Nasdaq 100 and S&P Software & Services Select Industry Index (see Exhibit 1), highlighting its emphasis on incipient stocks within this growing theme. The S&P Kensho Metaverse Index’s stock overlap even with some of its similar-themed competitors is roughly about one-half of its constituents. This can be attributed to our targeted sub-themes within the metaverse, which doesn’t have one stated consensus industry definition.

The S&P Kensho Metaverse Index’s current constitution (as of March 22, 2022) contains 30 stocks and is weighted primarily toward the Infrastructure Technologies segment (51%), followed by XR Enabling Software and Applications (36%), XR Enabling Equipment (10%) and Digital Finance (4%) (see Exhibit 2).

The S&P Kensho framework’s adaptive and forward-looking characteristics help to ensure current constituents’ continued relevance to the index’s theme, as well as room for new constituents to account for evolution within this nascent area. Additionally, our liquidity-adjusted equal weighting methodology seeks to reduce index concentration and increase its investability.

1 https://www.cnbctv18.com/business/industrial-ai-startup-detect-technologies-signs-global-pact-with-shell-12908962.htm

2 https://www.td.org/atd-blog/what-is-the-metaverse-where-we-are-and-where-were-headed

3 https://www.bloomberg.com/professional/blog/metaverse-may-be-800-billion-market-next-tech-platform/

4 For more information about these ETF holdings, please see the following websites: https://www.invesco.com/us/financial-products/etfs/product-detail?audienceType=Investor&productId=ETF-QQQM. https://www.fountetfs.com/product/mtvr. https://www.proshares.com/our-etfs/strategic/vers/. https://www.roundhillinvestments.com/etf/metv/. https://www.subversiveetfs.com/punk.

5 For more information about these ETF holdings, please see the following websites: https://www.fountetfs.com/product/mtvr. https://www.proshares.com/our-etfs/strategic/vers/. https://www.roundhillinvestments.com/etf/metv/. https://www.subversiveetfs.com/punk

The posts on this blog are opinions, not advice. Please read our Disclaimers.

Beyond Bitcoin: Why Digital Assets Need a Classification System

Contributor Image
James McDonald

Product Manager, Enterprise Data Team

Lukka

A few weeks ago, after communicating that I would be pivoting my career into the digital assets space and focusing on data, a long-time friend asked me, “Oh, you mean working with cryptocurrencies and helping people manage their bitcoins?” I paused and then explained that there is more to the digital assets markets than Bitcoin, and the deeper you go, the more interesting it becomes. However, the question stuck with me. I realized that my friend was not the only one with a narrow view of digital assets. The absence of a formal classification structure creates a barrier for new digital assets investors to understand the market segments beyond Bitcoin and Ethereum.

Three years ago, my friend would have been right. Cryptocurrency investing was generally thought of as buying Bitcoin or Ethereum, or maybe Litecoin. Today, that could mean anything—buying an NFT, discovering new ways to borrow, lend, and trade via DeFi protocols, or purchasing virtual real estate in Decentraland to make money renting the space out. This evolution is why investors and market participants are shifting their nomenclature from “cryptocurrencies” to “digital assets,” as the latter more accurately defines the emergence of a new asset class that extends beyond the original payment/currency-focused use cases.

How Diverse Is the Digital Asset Ecosystem?

While Bitcoin remains the dominant asset by market cap, the dominant sector for the top 50 assets is currently Smart Contract Platforms (sometimes also called “Layer-1s”). A digital assets investor may use this information to begin researching other emerging Smart Contract Platforms that are not in the top 50 and create an investment thesis derived from a comparable company analysis. This is not that dissimilar from how an equity manager may form an opinion on assets that may outperform their respective sectors. Similar to equities, this analysis would not be possible without first categorizing the universe of digital assets via a standardized sector classification system.

Why It Matters

The benefits of adopting a sector classification share one underlying similarity: they push forward the maturation of the digital assets asset class.

Traditional market participants are beginning to see that digital assets are not confined to a single use case, such as general payment, but are more accurately represented as a new asset class that is disrupting many legacy business verticals.

  • Standardized classification systems are a natural part of the growth of any new asset class—they can lead to new products and new allocation methodologies, as well as pave the way for increased adoption and legitimacy.
  • Sectoring digital assets could introduce many new capabilities within the digital assets markets and open the doors to a new era of legitimacy and acceptance from the traditional financial world.

Now that we have established there is more to digital assets than Bitcoin and Ethereum, stay tuned for our second piece outlining what a standardized classification system means for the emerging digital assets asset class.


Lukka’s Capabilities

Lukka is a firm that helps solve some of the greatest financial challenges in crypto, but has the intellectual resources, along with the data and processing capabilities, to test hypothetical scenarios like the one here. For more information on how Lukka puts data to work across multiple finance sectors, traditional and decentralized, supporting industries from insurance to Formula E, go to our website at Lukka.tech


DISCLAIMER

THE INFORMATION CONTAINED IN THIS BULLETIN PROVIDES ONLY A GENERAL OVERVIEW OF CURRENT  ISSUES RELATED TO DEBT FINANCING IN CRYPTOCURRENCY MARKETS AND SHALL IN NO EVENT BE CONSTRUED AS THE RENDERING BY LUKKA OF PROFESSIONAL ADVICE OR SERVICES. AS SUCH, THE INFORMATION PROVIDED IN THIS BULLETIN SHOULD NOT BE USED BY YOU AS A SUBSTITUTE FOR CONSULTATION WITH PROFESSIONAL ADVISORS. BEFORE MAKING ANY DECISION OR TAKING ANY ACTION REGARDING YOUR DIGITAL CURRENCIES OR THE DEBT TREATMENT THEREOF, YOU SHOULD ALWAYS CONSULT WITH AN APPROPRIATE FINANCIAL, LICENSED TAX, ACCOUNTING, OR OTHER PROFESSIONAL. TO THE FULLEST EXTENT PERMITTED BY LAW, IN NO EVENT WILL LUKKA(INCLUDING ITS RELATED ENTITIES, OWNERS, AGENTS, DIRECTORS, OFFICERS, ADVISORS, OR EMPLOYEES) BE LIABLE TO ANY READER OF THIS BULLETIN OR ANYONE ELSE FOR ANY DIRECT, INDIRECT, OR CONSEQUENTIAL LOSS OR LOSS OF PROFIT ARISING FROM THE USE OF THIS BULLETIN, ITS CONTENTS, ITS OMISSIONS, RELIANCE ON THE INFORMATION CONTAINED WITHIN IT, OR ON OPINIONS COMMUNICATED IN RELATION THERETO OR OTHERWISE ARISING IN CONNECTION THEREWITH.

The posts on this blog are opinions, not advice. Please read our Disclaimers.

Holding Period Returns

Contributor Image
Craig Lazzara

Former Managing Director, Index Investment Strategy

S&P Dow Jones Indices

What is the appropriate observational period for evaluating an investment strategy?

This question is important, because different observational periods can produce different conclusions. For example, for the first 11 weeks of 2022, one of our better-performing factor indices has been the S&P 500® Low Volatility Index. Through March 18, 2022, Low Vol had declined 4.7%, versus a 6.1% decline for the S&P 500. This incremental value, however, did not accrue smoothly. Low Vol outperformed in only six of the year’s first 11 weeks; in mid-February, in fact, its year-to-date performance lagged that of the S&P 500 by more than 100 basis points.

At some level, this is a silly comparison; no sensible analyst would worry about performance over a period as short as a week. But to say that a week is not an appropriate observational period does not tell us what an appropriate period is.

We reconstitute Low Volatility and other factor indices periodically; for Low Volatility, these changes take place quarterly in February, May, August, and November. Over the course of a year, therefore, Low Volatility holds four distinct baskets of stocks, and the holding period of each basket does not correspond to a neat unit of calendar time. When we look at February’s performance, for example, we’re looking at the performance of two different baskets, since a rebalancing transaction took place on Feb. 18, 2022.

Rather than using calendar units, therefore, a logical alternative is to make our observational period coincide with the index’s rebalancing schedule. We can ask not how Low Vol performed over a month or a quarter, but how each individual basket of low volatility stocks performed during its time in the index.

Low volatility strategies aim to dampen the returns of the parent index from which they are derived—to offer protection when the parent index declines and to participate (although regrettably not fully) when the parent index rises. If we examine months when the S&P 500 declines, Low Vol typically outperforms, and vice versa when the market rises. We’ve observed this result in low volatility strategies globally, and they confirm what our initial backtests of the low vol concept led us to expect.

We see the identical pattern when we observe distinct low volatility baskets rather than calendar months. The upper graph in Exhibit 1 shows that, for baskets held during periods when the S&P 500 declined significantly, Low Vol outperformed by an average of 4.79%; the lower graph shows that 82% of those baskets outperformed. As market performance improved, the relative performance of Low Volatility declined.

All observational periods are arbitrary, but some are more arbitrary than others. Using basket holding periods is arguably the least arbitrary option available. Its results support our understanding of the low volatility factor.

The posts on this blog are opinions, not advice. Please read our Disclaimers.