Get Indexology® Blog updates via email.

In This List

Holding Period Returns

How Does the S&P Europe 350 ESG Index Work?

India's ETF Market: Sustainability and Innovation

Canadian Equities Offer Some Solace amid World Turmoil

The Odds Are Against You

Holding Period Returns

Contributor Image
Craig Lazzara

Former Managing Director, Index Investment Strategy

S&P Dow Jones Indices

What is the appropriate observational period for evaluating an investment strategy?

This question is important, because different observational periods can produce different conclusions. For example, for the first 11 weeks of 2022, one of our better-performing factor indices has been the S&P 500® Low Volatility Index. Through March 18, 2022, Low Vol had declined 4.7%, versus a 6.1% decline for the S&P 500. This incremental value, however, did not accrue smoothly. Low Vol outperformed in only six of the year’s first 11 weeks; in mid-February, in fact, its year-to-date performance lagged that of the S&P 500 by more than 100 basis points.

At some level, this is a silly comparison; no sensible analyst would worry about performance over a period as short as a week. But to say that a week is not an appropriate observational period does not tell us what an appropriate period is.

We reconstitute Low Volatility and other factor indices periodically; for Low Volatility, these changes take place quarterly in February, May, August, and November. Over the course of a year, therefore, Low Volatility holds four distinct baskets of stocks, and the holding period of each basket does not correspond to a neat unit of calendar time. When we look at February’s performance, for example, we’re looking at the performance of two different baskets, since a rebalancing transaction took place on Feb. 18, 2022.

Rather than using calendar units, therefore, a logical alternative is to make our observational period coincide with the index’s rebalancing schedule. We can ask not how Low Vol performed over a month or a quarter, but how each individual basket of low volatility stocks performed during its time in the index.

Low volatility strategies aim to dampen the returns of the parent index from which they are derived—to offer protection when the parent index declines and to participate (although regrettably not fully) when the parent index rises. If we examine months when the S&P 500 declines, Low Vol typically outperforms, and vice versa when the market rises. We’ve observed this result in low volatility strategies globally, and they confirm what our initial backtests of the low vol concept led us to expect.

We see the identical pattern when we observe distinct low volatility baskets rather than calendar months. The upper graph in Exhibit 1 shows that, for baskets held during periods when the S&P 500 declined significantly, Low Vol outperformed by an average of 4.79%; the lower graph shows that 82% of those baskets outperformed. As market performance improved, the relative performance of Low Volatility declined.

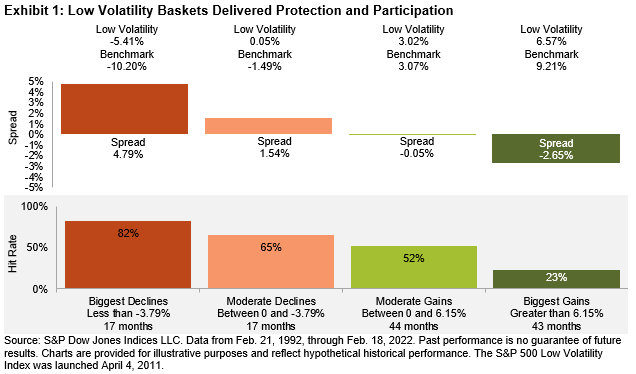
All observational periods are arbitrary, but some are more arbitrary than others. Using basket holding periods is arguably the least arbitrary option available. Its results support our understanding of the low volatility factor.

The posts on this blog are opinions, not advice. Please read our Disclaimers.

How Does the S&P Europe 350 ESG Index Work?

Contributor Image
Barbara Velado

Senior Analyst, Research & Design, Sustainability Indices

S&P Dow Jones Indices

Launched in 2019, the S&P Europe 350® ESG Index is designed to represent a broad-based, sustainable European benchmark. The index looks to provide an efficient tool for those aiming to focus on the European market, while aligning investments with ESG principles. Here, we dive into how the index achieves this—and why index design matters.

How Is the Index Designed?

The S&P Europe 350 ESG Index brings ESG considerations to the headline S&P Europe 350, which seeks to track the large-cap developed European market, spanning 16 countries. First, the index applies baseline exclusions by removing companies involved in business activities such as tobacco, controversial weapons and thermal coal. The index further removes companies in the bottom 25% by S&P DJI ESG Score within each industry group. Companies are then selected by their S&P DJI ESG Score, with the index targeting 75% of each GICS® industry group by market cap.

The Impact of Exclusions

When considering exclusions by industry group, Capital Goods and Food, Beverage & Tobacco are the most affected on absolute index weight terms. This is due to their high exposure to controversial weapons and tobacco (see Exhibit 2). When analyzing excluded weight as a percentage of its total industry group weight, Software & Services is the most affected, due to low S&P DJI ESG Scores.1

The Importance of S&P DJI ESG Scores

S&P DJI ESG Scores play a crucial role in the selection process for the S&P Europe 350 ESG Index. When considering each GICS industry group, companies with low S&P DJI ESG Scores may be eligible, but not selected. As scores improve, we see companies make it into the index (see Exhibit 3). This highlights the importance of integrating S&P DJI ESG Scores into the methodology, as it ensures the index not only removes companies involved in detrimental business activities, but selects the best sustainability performers.

What Does the S&P Europe 350 ESG Index Achieve?

Through this simple, rules-based approach, the S&P Europe 350 ESG Index accomplishes two parallel objectives:

  1. Raises the sustainability bar relative to its underlying index (see Exhibit 4); and
  2. Maintains an industry-group neutral composition relative to the underlying index.

The index shows enhanced sustainability characteristics, as well as dimensional environmental, social and governance improvements relative to the underlying index (see Exhibit 5).

By incorporating ESG criteria into a large-cap, broad-based European market, the S&P Europe 350 ESG Index establishes itself as the alternative, sustainable benchmark to the S&P Europe 350. It presents an efficient tool for market participants who increasingly place sustainability and ESG considerations at the core of their strategies.

1 Companies that have an S&P DJI ESG Score in the bottom 25% of scores within their GICS industry group in the S&P Global LargeMidCap and S&P Global 1200 are excluded.

The posts on this blog are opinions, not advice. Please read our Disclaimers.

India's ETF Market: Sustainability and Innovation

Contributor Image
Koel Ghosh

Former Head of South Asia

S&P Dow Jones Indices

The pandemic, along with its disruption, also opened windows to many opportunities. Innovation and new ideas are the key words. Sustainability is not a new idea; however, its focus has accelerated with the pandemic and incidents triggered by climate change. Nations and organizations are adopting ESG measures and bringing its importance to the forefront. Its incorporation into investment strategies has further emphasized its importance. The assets in sustainable funds have crossed USD 2.7 trillion, with over 5,900 funds.1 Europe dominates both in terms of assets and products, followed by the U.S. S&P DJI has had a long history of providing ESG indexing solutions, with some prominent indices such as the S&P 500 ESG Index, S&P Paris-Aligned & Climate Transition Index Series, and a host of options across core, thematics, factors, and fixed income.

In their quest for innovation, providers of financial strategies are evaluating options like the S&P Kensho Indices, which capture the industries and innovation of the fourth industrial revolution. This new generation of indices, powered by artificial intelligence, is designed to track innovation systematically and is helping market participants adopt a quantifiable framework to understand and measure innovation.

Can Passive Be the new Active?

The strong growth in passive investing is encouraging its prospects. India is seeing a heightened interest and the resultant product issuances. Active outperformance is being challenged by indexing strategies. The road to passive investment styles dominating markets is a long one, but with new milestones, there is optimism to get there.

1 MorningStar, https://www.morningstar.com/lp/global-esg-flows-, Global Sustainable Fund Flows: Q4 2021 in Review

The posts on this blog are opinions, not advice. Please read our Disclaimers.

Canadian Equities Offer Some Solace amid World Turmoil

Contributor Image
Fei Mei Chan

Former Director, Core Product Management

S&P Dow Jones Indices

Despite global geopolitical tensions, Canadian equities, in contrast to U.S. equities, seem to be faring well. Since its rebalance on Dec. 17, 2021, the S&P/TSX Composite gained 5.7% (through March 17, 2022). It was no surprise that the S&P/TSX Composite Low Volatility Index lagged—what was surprising was that it lagged by 1.3%, rising 4.4% over the same period. This is a capture of 78% of the upside—significantly higher than the historical upside capture rate of 66%.

Volatility levels remained steady for the most part, with Health Care and Information Technology clocking in the greatest changes, down 6% and up 5%, respectively.

In the latest rebalance for the S&P/TSX Composite Low Volatility Index, effective at the close of trading on March 18, 2022, sector weight changes were minimal. The low volatility index shed what little weight it had in Consumer Discretionary and Information Technology entirely. The slack was mostly picked up by Energy and Real Estate, each adding 2% to its weight. Despite a 6% volatility decline in the sector overall, Health Care’s weight remained steady, pointing to pockets of volatility within the sector.

The posts on this blog are opinions, not advice. Please read our Disclaimers.

The Odds Are Against You

Contributor Image
Craig Lazzara

Former Managing Director, Index Investment Strategy

S&P Dow Jones Indices

S&P Dow Jones Indices’ SPIVA (S&P Index Versus Active) scorecard, first published in 2002, has become our industry’s de facto scorekeeper of the relative performance of active managers. We recently released the U.S. SPIVA results for 2021. Nothing in the 2021 report was surprising, as most active managers continued to underperform benchmarks appropriate to their investment style. Some observations, however, are worth highlighting:

  • 2021 was a particularly difficult year, as 80% of all U.S. active managers underperformed the S&P Composite 1500®. In the large-cap segment, 85% of active managers lagged the S&P 500®. This made 2021 the second-worst year for large-cap managers on record (exceeded only by 2014, a year of record-low dispersion).
  • 2021’s results were especially challenging for large-cap growth managers, 99% of whom underperformed the S&P 500 Growth. Growth managers’ difficulties were especially acute because the largest companies in the growth index, which would have been underweighted by most active managers, performed very well.
  • Although mid- and small-cap managers underperformed at lower rates (62% and 71%, respectively) than large-cap managers, their record in 2021 was much worse than in the recent past. A majority of both mid- and small-cap managers had outperformed in three of the four years between 2017 and 2020, when their performance could benefit from an ability to “drift” up the capitalization scale. In 2021, the performances of the S&P 500, S&P MidCap 400®, and S&P SmallCap 600® were much closer than in the prior four years, meaning that the benefit of drift across the cap scale diminished.
  • Active managers often argue that they should be judged not simply by their returns, but also on their ability to manage portfolio risks over long periods of time. We agree—but SPIVA makes clear that, even after adjustment for risk, more than 90% of active managers, across the capitalization spectrum, underperformed over a 20-year horizon.

Despite some idiosyncrasies, the most important thing about 2021’s SPIVA results is what they share with the prior 20 years’ reports. SPIVA data extend to 2001; in 21 years, a majority of large-capitalization active managers outperformed the S&P 500 only three times. In 18 years out of 21, most large-cap managers lagged the benchmark. This is not an accident or a coincidence; active managers underperform for identifiable, robust, and sustainable reasons. Investors considering the use of active management should realize that the odds are against them.

The posts on this blog are opinions, not advice. Please read our Disclaimers.