Factor indices have two important uses. First, they can be used as benchmarks to help clients of specialist managers disentangle how much of the manager’s performance is attributable simply to factor exposure, and how much is attributable to the manager’s stock selection beyond the factor. Second, factor indices can be used as investment vehicles to “indicize” a factor or set of factors, thereby delivering in passive form a strategy formerly available only via active management.
Our recently released paper, Factor Indices: A Simple Compendium, describes S&P DJI’s approach to eight factors: value, dividend yield, growth, quality, momentum, size, low volatility, and high beta. For each factor, we ranked the constituents of the S&P 500® by factor score, sorting them into equal-weighted quintiles, where Quintiles 1 and 5 contain the stocks with the highest and lowest factor exposure, respectively.
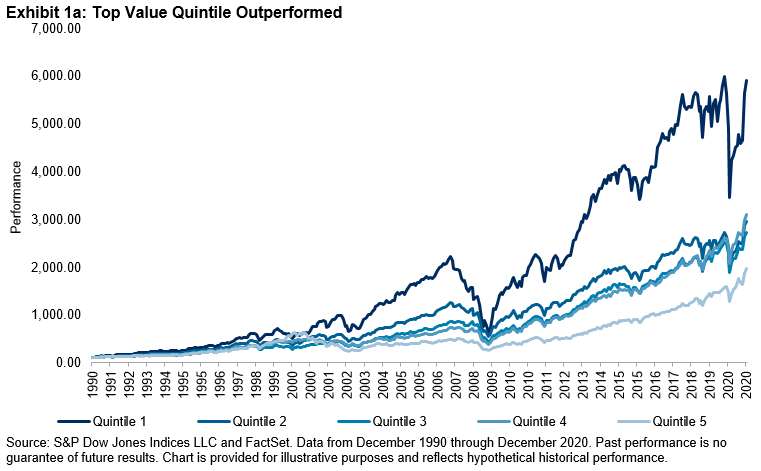
Taking value as an example, Exhibit 1a shows that the cheapest quintile of value stocks handily outperformed the others over time. Quintiles 2-4 are relatively close together, with Quintile 5 trailing. In contrast, Exhibit 1b shows that the quintile analysis for momentum supports an exclusionary approach to portfolio construction, as Quintiles 1-4 are clustered together, while Quintile 5 underperformed significantly. These results show that the performance of quintiles varies across factors; this has important implications for index design.

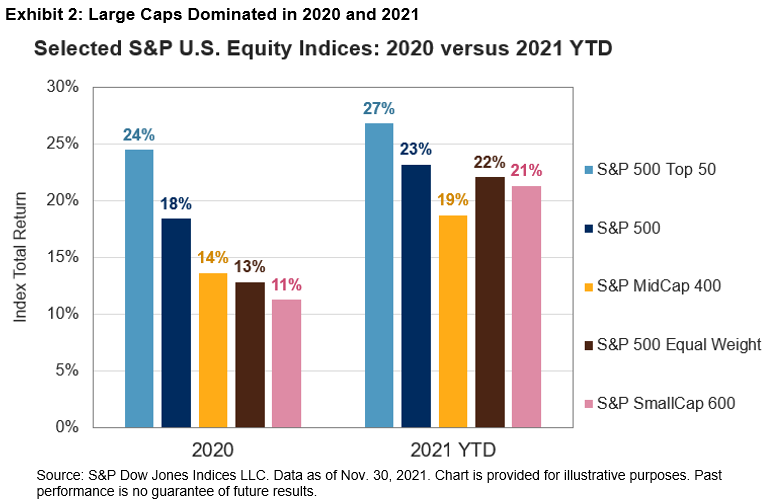
Factor performance also varied across different market regimes. Exhibit 2 shows that Quintile 1 of value, size, and high beta outperformed during rising markets, while Quintile 1 of dividend yield, quality, momentum, and low volatility outperformed during down markets, highlighting their defensive characteristics.

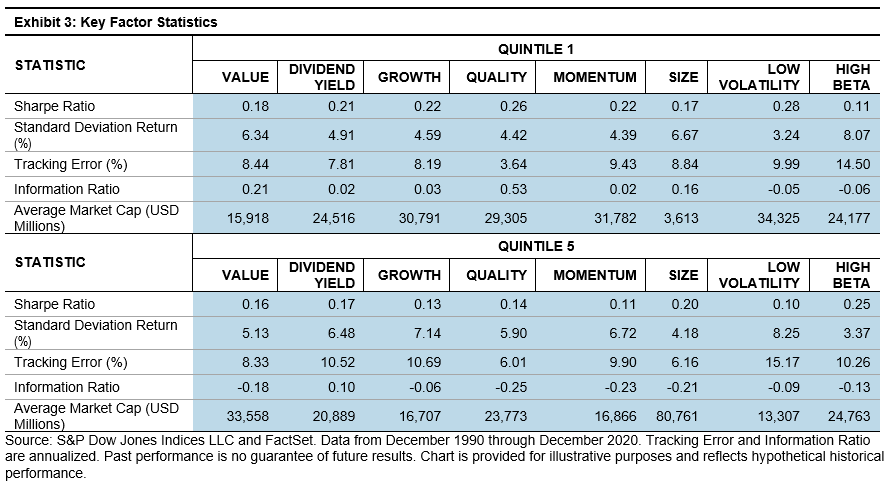
Exhibit 3 allows us to make several other observations about these factors. For the period from 1991 through 2020, Quintile 1 of value, size, and high beta were more volatile than their Quintile 5 counterparts. Looking at Quintile 1 across factors, low volatility had the highest Sharpe Ratio, and quality had the highest Information Ratio. The average market cap of Quintile 1 was greater than that of Quintile 5 for dividend yield, growth, quality, momentum, and low volatility, illustrating a large-cap bias.
Understanding performance differences across factor quintiles is critical to understanding index performance and optimizing index construction.
The posts on this blog are opinions, not advice. Please read our Disclaimers.