We all know that stock market returns vary substantially over time. For example, the S&P 500®’s performance between 1981 and 2020 ranged from -37% (2008) to +38% (1995). The market’s compound annual return for this period was 11.5%.
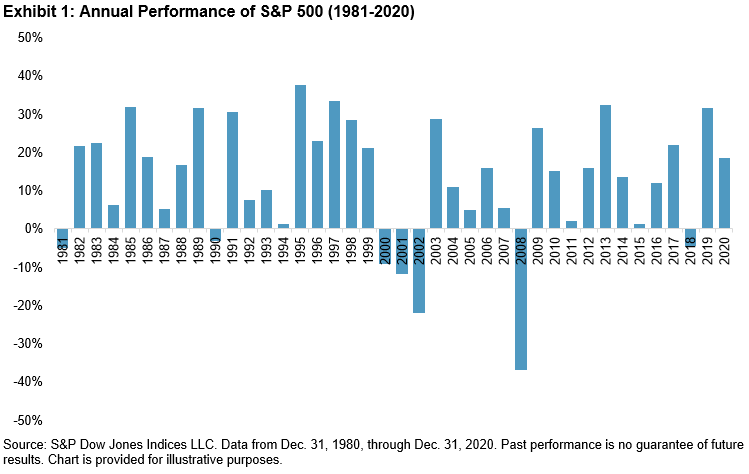
Investors, however, live with actual portfolio values, not abstract rates of return. Obviously, and other things equal, portfolio values will rise with larger contributions and with higher returns. But there is an additional, easily overlooked, source of uncertainty. The market generated a particular set of returns, as shown in Exhibit 1, but those returns occurred in a particular order. If the order had been different, the impact on portfolio values would have been profound. Whether we’re interested in extrapolating into the future or simply in understanding alternative historical outcomes, we need to understand both the average level of returns and the order in which they occurred.
We can illustrate this by considering three alternative scenarios, all using the return data from Exhibit 1. We assume that an investor contributes $1,000 at the beginning of 1981, increasing his investment by 5% every year for 40 years, for a total cumulative contribution of $120,800. For each of our three scenarios, we use the actual returns of a hypothetical investment in the S&P 500, but arrange the order differently. The “Actual Order” scenario shows what would have happened if the returns occurred in exactly the order they did. The “Increasing Return Order” scenario assumes that the worst return came first, then the next-to-worst, and so on until the best return occurred in year 40. The “Decreasing Return Order” scenario makes the opposite assumption; the best return would have occurred first, and the worst in year 40.
For all three scenarios in Exhibit 2, the market’s compound growth rate is the same. For all three scenarios, the amount and timing of the investor’s hypothetical contributions are the same. And yet the highest hypothetical portfolio value is nearly 18 times greater than the lowest. Clearly, the order in which returns could have occurred matters a great deal. Actual historical performance lies between the two extremes (and is much closer to the lower than to the upper bound).

Exhibit 2 illustrates an important truth: a portfolio outcome depends in part, but only in part, on the returns the market delivers. Portfolio values also depend importantly on the order of returns. Modeling portfolios requires us to deal with both sources of uncertainty.
The posts on this blog are opinions, not advice. Please read our Disclaimers.