Get Indexology® Blog updates via email.

In This List

A Hypothetical Look at 35 Years with Indices That Use SPX Index Options

The S&P 500 and DJIA: Divergent Paths to Similar Results

Understanding the Basics of Sustainability Part 2: Focusing on Net Zero

Using Market Fluctuations to Unlock Opportunity

Tilting Toward Sustainability with the S&P/NZX 50 Portfolio ESG Tilted Index

A Hypothetical Look at 35 Years with Indices That Use SPX Index Options

Contributor Image
Matt Moran

Head of Index Insights

Cboe Global Markets

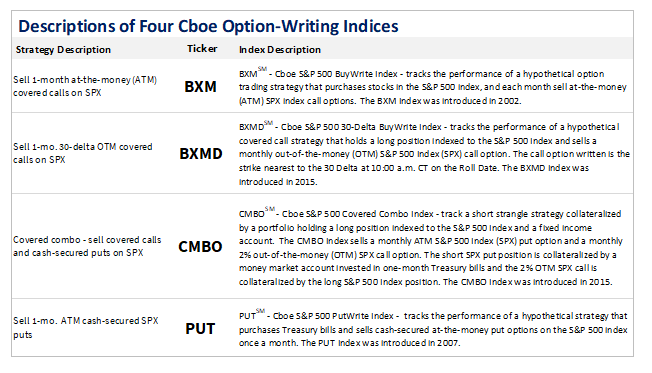
Four Option Benchmark Indices

In order to assess how hypothetical options strategies performed in various market regimes over the past 35 years, investors use some or all of these four key benchmark indices that sell S&P 500 options as part of the their index methodology and that have histories going back to June 30, 1986. As shown in the table below, the four options indices were announced in either 2002, 2007 or 2015, and the data histories before the announcements are backtested.

Use of S&P 500 Cash-Settled Options

All four of the above benchmark indices incorporate a methodology pursuant to which the indices “sell” S&P 500 options. In the past quarter (1) the average daily volume in notional terms for the large-sized S&P 500 (SPX® and SPXW) cash-settled index options topped $500 billion, and (2) the average daily open interest was 14.4 million contacts for the S&P 500 (SPX and SPXW) options, and 400,511 for the Mini-SPX (XSPSM) cash-settled index options.

Risk-Adjusted Returns

When looking at back-tested data for the past 35 years, three of the “option-writing” indices – PUT, BXMD, and CMBO – reflected higher risk-adjusted returns (as measured by the Sortino Ratio) than the other six indices in the table below. For discussions of option-writing indices, and the Sortino Ratio and other measures of risk-adjusted returns, please see the white papers by Wilshire, Callan, and Ibbotson Associates. The papers also have discussions of the volatility risk premium that may facilitate long-term risk-adjusted returns by index option-writing strategies.

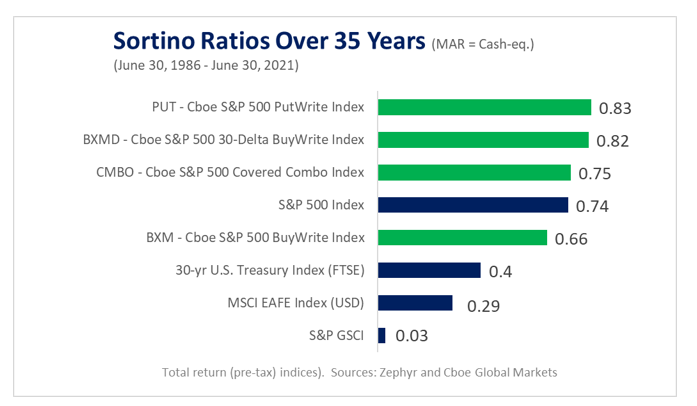
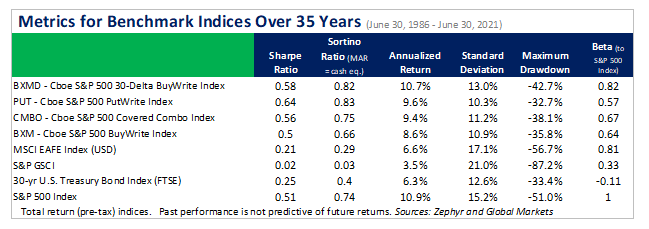
Table with Metrics for “Option-Writing” Indices

Key highlights in the table below with the back-tested 35-year performance of four Cboe option-writing indices and four other indices:

  • Lower Standard Deviations: All 4 Cboe S&P indices had lower standard deviations than the stock and commodity indices.
  • Less Severe Maximum Drawdowns: All 4 Cboe S&P indices had less severe maximum drawdowns than the stock and commodity indices.
  • RiskAdjusted Returns: Three of the Cboe S&P indices (BXMD, PUT, and CMBO) had higher risk-adjusted returns (as measured by the Sharpe and Sortino Ratios) than the other 5 indices.
  • Annualized Returns: The annualized returns of the 4 Cboe S&P indices were higher than those of the MSCI EAFE Index (USD), the 30-Year US Treasury Bond Index (FTSE), and S&P GSCI (for commodities), but less than that of the S&P 500 Index.
  • Lower Betas: The four Cboe S&P indices had betas to the S&P 500 that ranged from 0.57 to 0.82, indicating that they may be examined for potential to help diversify certain portfolios.

To Learn More

++++++++++++++++++++

Disclaimer

Options involve risk and are not suitable for all investors. Prior to buying or selling an option, a person must receive a copy of Characteristics and Risks of Standardized Options. Copies are available from your broker or from The Options Clearing Corporation, One North Wacker Drive, Suite 500, Chicago, Illinois 60606 or at www.theocc.com. The BXMSM, BXMDSM, PUTSM, CMBOSM, and PPUTSM indexes (the “Indexes”) are designed to represent proposed hypothetical options strategies. The actual performance of investment vehicles such as mutual funds or managed accounts can have significant differences from the performance of the Indexes. Investors attempting to replicate the Indexes should discuss with their advisors possible timing and liquidity issues. Like many passive benchmarks, the Indexes do not take into account significant factors such as transaction costs and taxes. The four Cboe S&P indexes in this blog were announced in either 2002, 2007, or 2015.  information presented prior to the announcement dates is back-tested. Back-tested performance is not actual performance, but is hypothetical. A limitation of back-tested information is that it reflects the application of the Index methodology in hindsight. No theoretical approach can completely account for the impact of decisions that might have been made during the actual operation of an index. Cboe Global Indices, LLC calculates and disseminates the Indexes pursuant to an agreement with S&P Dow Jones Indices LLC (“S&P DJI”). BXMSM, PUTSM, CMBOSM and BXMDSM are service marks of Cboe Exchange, Inc. or its affiliates. S&P®, S&P 500® and SPX® are registered trademarks of Standard & Poor’s Financial Services, LLC (“S&P”) and have been licensed for use S&P DJI and sublicensed by Cboe Exchange, Inc.  The S&P 500 and S&P GSCI are products of S&P DJI.  Any products (including options) that have the S&P Index or Indexes as their underlying interest are not sponsored, endorsed, sold or promoted by S&P DJI or S&P and neither S&P DJI nor S&P makes any representations or recommendations concerning the advisability of investing in products that have S&P indexes as their underlying interests.

The posts on this blog are opinions, not advice. Please read our Disclaimers.

The S&P 500 and DJIA: Divergent Paths to Similar Results

Contributor Image
Garrett Glawe

Former Managing Director, Head of U.S. Equity Indices

S&P Dow Jones Indices

The S&P 500® and the Dow Jones Industrial Average® (DJIA) are two of the best known and most used indices in the world. They are both designed to represent U.S. large-cap companies. As we detailed in a recent paper, the S&P 500 and DJIA have similar long-term risk/return profiles. As of April 30, 2021, the DJIA posted a slightly higher 30-year annualized return of 11.16%, relative to 10.60% for the S&P 500. In addition, the three-year rolling correlation between the index returns was high, averaging 0.95 from April 1993 to April 2021.

However, when we look under the hood, we can see that these iconic indices followed different paths to achieve similar results. The S&P 500 currently includes 505 constituent companies, whereas the DJIA only has 30. They also employ different weighting schemes. The S&P 500 is float market capitalization weighted. This means that the weight of each stock depends on the total size of the company, adjusted for shares that do not trade publicly. In contrast, the DJIA is price weighted, so the stock weights are determined simply by their price.

Here we will highlight three key takeaways from the paper.

The Two Indices Have Experienced Cycles of Relative Performance

In Exhibit 1, we have charted the three-year annualized relative returns between the S&P 500 and the DJIA. During periods when the blue line is above zero, the S&P 500 had outperformed the DJIA over the preceding three years. During the period of the tech bubble burst from June 2000 to June 2003, the S&P 500 significantly underperformed the DJIA.  Part of this underperformance was due to the S&P 500 having a higher weight in the Information Technology sector.

The Top 10 Holdings of the Two Indices Are Quite Different

An analyst who first reviewed the top 10 companies in the S&P 500 and DJIA would not guess that the indices have performed similarly over the long term. As shown in Exhibit 2, as of April 30, 2021, there were only two names in common in each list—Microsoft and Visa. In the paper, we walk through the details of how the weight of Microsoft is calculated for each index.

The Indices Have Provided Different Sector Exposures, Which Can Result in Meaningful Return Discrepancies in the Medium Term

Over the three-year period ending April 30, 2021, the S&P 500 outperformed the DJIA by 4.11% annualized. Exhibit 3 shows the results of a three-year Brinson performance attribution to explain the outperformance. In total, Industrials accounted for 2.00% / 4.11% = 49% of the difference. On average over the past three years, the S&P 500 was underweight Industrials by 10.01% during a time when Industrials underperformed the broad market. We can further decompose the Industrials’ 2.00% return contribution into an allocation effect of 1.14% and selection effect of 0.86%.

When first reviewing the S&P 500 and DJIA, market participants may note their similar long-term risk/return profile and high correlation. However, when we look closer, we can analyze a range of important differences including the number of constituents, top 10 holdings, weighting scheme, and sector exposures. Once investors understand these differences, they can make more informed decisions about using these iconic indices as benchmarks or the basis for passive investment.

The posts on this blog are opinions, not advice. Please read our Disclaimers.

Understanding the Basics of Sustainability Part 2: Focusing on Net Zero

Contributor Image
Koel Ghosh

Former Head of South Asia

S&P Dow Jones Indices

The increasing focus on sustainability inclusion is being reflected through the markets’ growing recognition of the financial materiality and impact of ESG issues on corporate balance sheets. Therefore, the range of ESG offerings has expanded to include indices that focus on climate change, carbon efficiency, fossil fuel free, and thematics, which include clean energy and water indices.

The 2016 Paris Climate Agreement resulted in many countries pledging to net zero goals. Net zero, also referred to as carbon neutrality, is the scenario wherein the carbon or greenhouse emissions are balanced by absorbing the same from the atmosphere. Since there are certain industries such as chemical, steel, cement, and some others that cannot achieve absolute zero targets, the goal is to create a “net zero” target. The negative impact of global warming has been recognized worldwide, and action is being taken across industries. Regulators, product providers, and investors have also joined the cause by taking stock of the climate risks in their holdings and alignment to the scenario in which global warming increases by no more than 1.5°C.

In order to help market participants looking to chart a path to net zero, we launched the S&P PACTTM Indices (S&P Paris-Aligned & Climate Transition Indices), which are designed to meet the minimum standards for the EU Paris-aligned and EU Climate Transition Benchmarks. In addition to lowering carbon emissions relative to their underlying benchmarks, the indices also seek to decarbonize on an absolute basis at a rate of 7% year over year. According to the Intergovernmental Panel on Climate Change, this is the rate of decarbonization required to achieve net-zero emissions by 2050 and limit global warming to 1.5°C.

Exhibit 1 demonstrates that the addition of sustainability factors does not necessarily compromise the returns for the index.

The broad layer of sustainability screens available is unlimited for those keen on this strategy. There are different sustainability versions of benchmark indices like the S&P ESG Dividend Aristocrats Index Series, S&P Global Clean Energy Index, S&P Global Water Index, Dow Jones Green Real Estate, etc.

Sustainable factors focus on addressing global issues, and investment strategies are incorporating them in a coordinated effort toward a positive change. The events of the past year have caused many businesses to consider ESG risks and opportunities and the role they play in achieving financial resilience, thereby fueling ESG adoption within the investment community.

In India, companies like Reliance Industries, HDFC Bank, Tata Consultancy, Infosys are pledging their commitment toward net zero, along with several other global companies across the globe. The country’s efforts to align with the global focus on climate change is a tall task involving reduction in coal, which is the primary source of energy and power generation. However, efforts are in progress with initiatives such as the world’s largest solar energy project to generate 175 gigawatts of renewable energy capacity by 2022 and 450 GW by 2030; tackling deforestation; regulatory ESG disclosure requirements for top companies; along with the government focus via varied projects. Even though these are small steps, they are aimed toward the net zero target.

The posts on this blog are opinions, not advice. Please read our Disclaimers.

Using Market Fluctuations to Unlock Opportunity

Volatility often represents uncertainty, but it could also signal opportunity. Take a closer look at how the systematic design of the S&P 500 Dynamic Participation Index may help market participants identify and reflect potential opportunities inside the daily price fluctuations of the S&P 500.

The posts on this blog are opinions, not advice. Please read our Disclaimers.

Tilting Toward Sustainability with the S&P/NZX 50 Portfolio ESG Tilted Index

Contributor Image
Ryan Christianson

Former Associate Director, APAC Lead, ESG Indices

S&P Dow Jones Indices

As they begin their journey in environmental, social, and governance (ESG) investing, many market participants are realizing that there are multiple ways in which an index methodology can incorporate ESG characteristics. Some strategies will look to screen out particular industry groups or companies participating in various business activities, while other strategies will make relative adjustments based on ESG scores. With the exception of a few eligibility criteria that are rather standard with ESG indices, the new S&P/NZX 50 Portfolio ESG Tilted Index takes the latter approach and tilts the weight of companies by their S&P DJI ESG Scores.

Using the S&P/NZX 50 Portfolio Index as the underlying benchmark, the ESG tilted index allows the same diversification across New Zealand sectors, while giving more weight to high ESG performing companies.

Though the history for the S&P/NZX 50 Portfolio ESG Tilted Index is limited due to availability of historical ESG data, since its inception date, the index’s performance has been stellar in comparison to its benchmark. The three- and five-year annualized returns outperformed the benchmark by 0.90% and 1.62%, respectively (see Exhibit 1).

S&P DJI ESG Scores are used as the primary dataset in evaluating the ESG performance of each constituent company. S&P DJI ESG Scores are the second set of ESG scores calculated by S&P Global ESG Research, in addition to the S&P Global ESG Scores that are used to define the Dow Jones Sustainability Indices constituents.

Each year, S&P Global conducts the Corporate Sustainability Assessment (CSA), in which analysts examine over 11,000 companies globally. The CSA has produced one of the world’s most comprehensive databases of financially material sustainability information.

Regarding index exclusions, there are several different business activities that deem a company ineligible for inclusion in the S&P/NZX 50 Portfolio ESG Tilted Index. These categories include controversial weapons, thermal coal, and tobacco. These are the same exclusions found in the S&P 500® ESG Tilted Index. In addition to the aforementioned business activities, in response to regulations and demand seen from the local New Zealand market, the methodology also excludes companies from the Energy sector as well as those that operate in the Casinos and Gaming sub-industry, as defined by GICS®.

Lastly, the index methodology also screens companies based on their accordance to the United Nations Global Compact (UNGC) Principles. This is done by utilizing Sustainalytics’ Global Standards Screening (GSS), which provides an assessment of a company’s impact on stakeholders and the extent to which a company causes, contributes, or is linked to violations of international norms and standards. Companies that are deemed “Non-Compliant” by Sustainalytics are ineligible for index inclusion.

As interest in and availability of ESG strategies are growing around the world, the same can be said for New Zealand. Market participants are making active decisions about the types of funds that they choose, and looking to ensure that those funds are aligned not only with their risk/return expectations, but that they also take material ESG matters into consideration.

There have been recent changes in New Zealand that have also been driving investor interest in ESG. For example, there has been increased attention to how responsible default providers for KiwiSaver (New Zealand pension funds) are with their investment portfolios. Another example is the Ministry of Business, Innovation & Employment applying rules around investments in companies with exposure to fossil fuel production and illegal weapons.

We are keeping an eye on these growing local and global trends to ensure that indexing strategies are in line with the expectations of not just investors, but also the policy makers that govern those respective markets.

The posts on this blog are opinions, not advice. Please read our Disclaimers.