Get Indexology® Blog updates via email.

In This List

Where Do You See Yourself in Five Years? China Stocks Up ahead of Their Latest Five-Year Plan

Motions of the Market

India’s Contribution to the Global Economic Recovery

Performance of the New S&P Risk-Managed Target Date Indices

The Fed’s Corporate Bond Purchases and Their Impact on Corporate Bond Issuance

Where Do You See Yourself in Five Years? China Stocks Up ahead of Their Latest Five-Year Plan

Contributor Image
Jim Wiederhold

Former Director, Commodities and Real Assets

S&P Dow Jones Indices

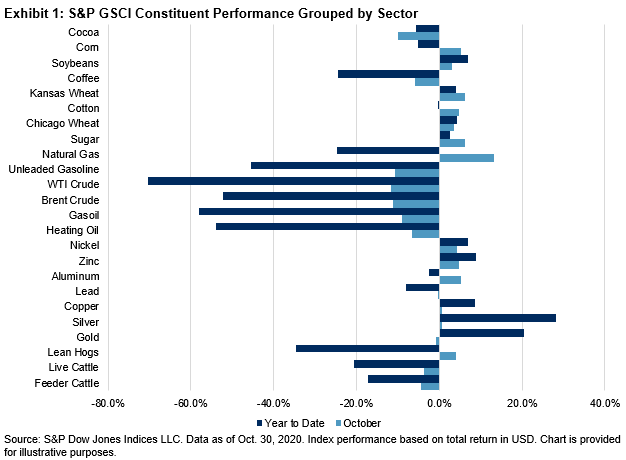
When discussing global economic recoveries, China is usually at the forefront of the conversation. As of Nov. 16, 2020, metal commodities with an industrial focus were the outperformers YTD. China is the world’s top industrial metal destination. Exhibit 1 shows the top 10 performing commodities tracked by S&P DJI. Seven metal commodities made it to the top 10. Recent rebounds in economic data points like PMIs and Industrial Production point to an increased appetite from China for these industrial commodities compared to what was witnessed during the doldrums of the COVID-19 global lockdown earlier this year, as well as any time over the last two years.

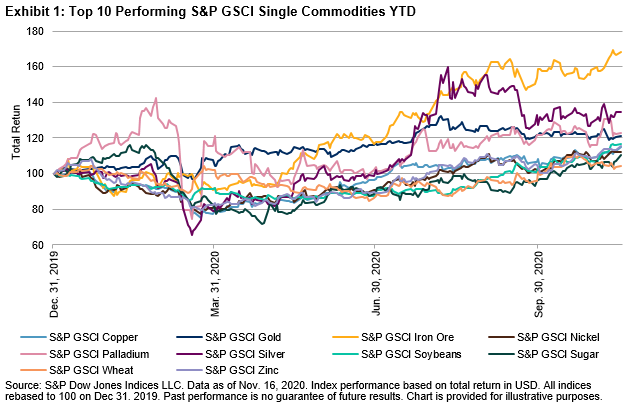
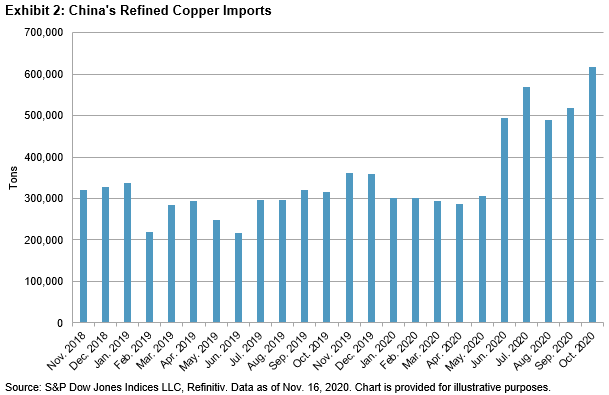
The S&P GSCI Iron Ore outperformed all other commodities, up 68.19% YTD. Chinese steel production and stockpiling played a big role in the demand for iron ore. With its higher industrial use, silver has outshined gold so far, with a 34.39% YTD return compared to 20.87% for the latter. The five LME-based commodities making up the S&P GSCI Industrial Metals are performing admirably, with the S&P GSCI Copper up 14.77% YTD. China’s demand for copper picked up considerably this year starting in June, and it remained elevated through the end of October. With two months of the year left, China has already imported a YTD record high 5.6 million tons of copper, outpacing 2015 by several thousand tons.

China’s increased appetite for feed grains pushed several major agriculture commodities to multi-year highs, as livestock populations rebounded impressively this year after last year’s decimation from African Swine Fever. In a previous blog, we highlighted the reasons behind the S&P GSCI Soybeans strong YTD performance. Its use as a source of feed appealed to Chinese buyers, especially as the commodity traded near five-year lows earlier this year and the U.S.-China trade war showed signs of a resolution; China committed to a record high level of purchases of U.S. soybeans this sowing season. China is on pace to shatter all previous grain purchasing records. More recently, local corn prices in China were pushed to record highs. A domestic shortfall of corn stocks led China to go on a buying spree over the last few months.

Despite attempts by the Communist People’s Party to become more self-sufficient in the grain markets, this year demonstrated how reliant they are on key commodity markets. China’s 14th Five-Year Plan clearly exposed which commodities they will focus on over the next five years. As China enters a new stage of development, this latest five-year plan shows the country’s determination to position itself as a world leader in emerging technologies, with more novel commodities like rare earth metals being a growing focus.

S&P DJI offers a suite of broad and single-commodity indices tracking commodity prices around the world. Explore our Commodities Indices to find out more about the strategies and insights we offer.

The posts on this blog are opinions, not advice. Please read our Disclaimers.

Motions of the Market

Contributor Image
Anu Ganti

U.S. Head of Index Investment Strategy

S&P Dow Jones Indices

The S&P 500® rose by 10% in the 12 months ending on Oct. 31, 2020, trouncing the S&P 500 Equal Weight Index by 9.1%, as seen in Exhibit 1. While such outperformance is not unprecedented, it does remind us of previous market peaks (especially in December 1999), and raises questions about whether a reversal may be in the cards.

While these periods may feel similar, they have notable differences. It is important to remember that by definition, the capitalization-weighted S&P 500 has no factor tilts. We can, however, look under the market’s figurative hood by analyzing the differences between the S&P 500 and its average constituent, represented by the S&P 500 Equal Weight Index. Exhibit 2, excerpted from our monthly factor dashboard, shows the factor tilts of the S&P 500 Equal Weight Index, relative to the (capitalization-weighted) S&P 500.

Currently, the equal weight version has a strong tilt away from low volatility and momentum, and a slight tilt away from quality. It also has exposures toward small size, dividend yield, high beta, and value. In other words, compared to the average stock in the index, the S&P 500 itself is less volatile, more momentum-oriented, more expensive, and much larger.

But when we go back further in history, we observe significant differences between today’s factor dynamics compared to those in December 1999. We observe in Exhibit 3 that like today, the equal weight version had a strong tilt away from momentum and toward small size, but that is where the similarities end. Twenty years ago, the S&P 500 Equal Weight Index barely had a tilt away from low volatility, deeper exposures to quality and dividend yield, along with a strong tilt away from high beta. Therefore, compared to the average constituent, the S&P 500 was much more volatile and not as durable from a quality perspective.

The fact that today’s market is less volatile and of higher quality compared to 1999 is not surprising, as the companies within Information Technology, the S&P 500’s largest sector then and now, are both more profitable and less volatile than they were 20 years ago. While we cannot predict whether the market’s upward trajectory is sustainable, history enables us to better understand the motions of the market from a factor lens.

The posts on this blog are opinions, not advice. Please read our Disclaimers.

India’s Contribution to the Global Economic Recovery

Contributor Image
Jim Wiederhold

Former Director, Commodities and Real Assets

S&P Dow Jones Indices

Discussions regarding a K-shaped recovery from COVID-19 highlight disparities across different commodity sectors. India seems to be experiencing its own version of this, with some areas improving faster and stronger than others. Decreased importation costs have served as a tailwind to help India. Energy accounts for about one-third of India’s total imports, and as crude oil prices collapsed around the world from the simultaneous demand and supply shock, India found that the cost of doing business dropped significantly. Most commodity prices dipped in the first half of the year, following moves in other asset classes. Exhibit 1 shows the YTD and October 2020 performance of the 24 constituents in the S&P GSCI. Grouped by sector, the negative YTD performance of the energy-related commodities clearly stands out; however, the other sectors seem to be rounding the turn.

Before dissecting the current situation, it is important to put India’s trade relationships and major commodity exports and imports in a global context. With China’s dominance in world trade, it would be intuitive to think it has an outsized trading relationship with India, but China only made up approximately 15% of total imports as of 2018. China is India’s largest trading partner, but after that, imports are more evenly distributed across many trading partners. The most prominent destination for Indian exports is the U.S. Approximately 20% of exports to the U.S. consist of diamonds, jewelry, and precious metals.

Crude petroleum and gasoline have traditionally made up 25% of India’s imports. Crude petroleum imports fell dramatically from April 2020 through July 2020, as the Indian government enacted one of the world’s most stringent lockdowns in response to COVID-19. While weaker global oil prices have been beneficial, the pickup in demand has been slow. Crude petroleum imports recovered notably in August but remain well below previous levels. On a positive note, gasoline demand hit a seven-month high in September.

Gold imports have also fallen sharply since March. According to the World Gold Council, gold demand in India fell by 30% during Q3 2020, compared with the same period last year, due to COVID-19-related disruptions and surging gold prices. While this was an improvement from demand in Q2 2020, which was down 70% year-over-year, it continues to reflect weak consumer sentiment, ongoing lockdown restrictions, and record gold prices.

From an export perspective, there may be some signs of improvement, especially for agricultural commodities. Global demand for rice and sugar is expected to grow, and both are commodities that have seen increased production in India in recent years. Bumper wheat crops over recent years also put India in a strong position to take advantage of surging global wheat prices.

When looking for clues to where an economy may be recovering or taking another turn for the worse, commodities tend to be good indicators of what is improving or deteriorating. The S&P GSCI provides market participants with a useful tool to reference when attempting to understand commodity markets, just as the S&P 500® is used to showcase U.S. equity market performance.

The posts on this blog are opinions, not advice. Please read our Disclaimers.

Performance of the New S&P Risk-Managed Target Date Indices

Contributor Image
Smita Chirputkar

Former Director, Global Research & Design

S&P Dow Jones Indices

In a previous blog, we explored the glide paths of the S&P Risk-Managed Target Date Indices. In this post, we will compare the index construction of the S&P Risk-Managed Target Date Indices with that of the S&P Target Date Indices and examine their performance.

Index Construction of the Baseline S&P Risk-Managed Target Date Indices

Each S&P Target Date Index and each S&P Risk-Managed Target Date Index is designed to measure the performance of a set of weighted return indices, each aligned with specific target date years, also referred to as vintages. Both series are based off the same underlying survey data, though there are differences in the way the indices are constructed (see Exhibit 1).

The construction of these baseline indices for the S&P Risk-Managed Target Date Indices is the first step of the process.

Exhibit 2 shows the respective equity allocations of the baseline S&P Risk-Managed Target Date Indices (conservative,moderate and aggressive)and S&P Target Date Indices. The allocations of the baseline S&P Risk-Managed Target Date (Moderate Glide Path) Indices were similar to those of the S&P Target Date Indices, but they were not identical due to differences in the construction explained in Exhibit 1.

Performance from June 2012 to September 2020

Exhibit 3 shows annualized returns and annualized volatilities of the baseline S&P Risk-Managed Target Date Indices and S&P Target Date Indices from June 2012 to September 2020. The annualized returns curve is upward sloping, indicating that far-dated vintages generated higher annualized returns than the near-dated vintages. This was due to higher equity allocated to far-dated vintages relative to near-dated vintages. The volatility curve is also upward sloping, indicating that the far-dated vintages exhibited higher annualized volatility than the near-dated vintages.The risk/return profile of the baseline S&P Risk-Managed Target Date (Moderate Glide Path) Indices was similar to that of the S&P Target Date Indices, though they exhibited differences in the underlying data (raw versus winsorized), which contributed to the slight variation in the performance and risk.

The Addition of the S&P 500® Managed Risk 2.0 Index and Its Performance

The last step in the construction of the S&P Risk-Managed Target Date Indices is to combine the respective baseline S&P Risk-Managed Target Date Indices (conservative, moderate, and aggressive) with the S&P 500 Managed Risk 2.0 Index. The S&P Target Date Indices do not have this additional component. The S&P 500 Managed Risk 2.0 Index generated similar risk-adjusted returns from June 2012 to September 2020, with a volatility reduction of 24.3% compared with the volatility of the S&P 500 (see Exhibit 4).

The annualized returns of the S&P Risk-Managed Target Date (Moderate Glide Path) Indices were consistently higher than those of the corresponding S&P Target Date Indices for each vintage during the analysis period (June 2012 to September 2020).The performance difference was attributed to the relative performances of the baseline indices and the allocation to the S&P 500 Managed Risk 2.0 Index and its performance during the analysis period.

Performance during Market Turmoil in Q1 2020

We examined the performance of both series during the period of market turmoil from Feb. 19, 2020, to March 23, 2020. Due to an additional built-in risk component, the S&P Risk-Managed Target Date Indices were able to provide greater downside protection than the S&P Target Date Indices by mitigating losses and generating higher returns on risk-adjusted and absolute basis for all the vintages except for the retirement index (see Exhibit 6).

Thus, we have seen that there is a difference in the design of the S&P Target Date Indices and the S&P Risk-Managed Target Date Indices. The difference in allocation to various asset classes and their performance contributed to the overall differences in the risk/return profile of the indices during the analyzed period. Please refer to the S&P Target Date Index Series Methodology for more details.

The posts on this blog are opinions, not advice. Please read our Disclaimers.

The Fed’s Corporate Bond Purchases and Their Impact on Corporate Bond Issuance

Contributor Image
Hong Xie

Former Senior Director, Global Research & Design

S&P Dow Jones Indices

In response to COVID-19 and its disruptive impact on the credit market, the U.S. Federal Reserve announced the creation of the Primary Market Corporate Credit Facility (PMCCF) and the Secondary Market Corporate Credit Facility (SMCCF) on March 23, 2020, to support the functioning of the credit market. The PMCCF provides a funding backstop for corporate debt to eligible issuers so that they are better able to maintain business operations and capacity during the period of dislocation related to COVID-19. The SMCCF supports market liquidity for corporate debt by purchasing individual corporate bonds of eligible issuers and exchange-traded funds (ETFs) in the secondary market. The combined size of both credit facilities is up to USD 750 billion.

As of the end of September, the SMCCF had purchased only about USD 13 billion of eligible securities out of its capacity of USD 250 billion, while the PMCCF has not yet closed any transactions. Exhibit 1 shows transactions in the SMCCF since it started purchasing corporate bond ETFs in May. The majority of ETF purchases were executed in May and June, while in August, September, and October the Fed stopped adding ETFs to the SMCCF. Individual bond purchases were more stable during this period of time, totaling a par amount of USD 4.5 billion as of Oct. 28, 2020.

The main objective of the Fed’s credit facilities is to provide a liquidity backstop for corporate bonds and improve credit market functioning. One important measure of orderly market functioning is issuers’ access to the primary market. Exhibits 2 and 3 show net issuance amounts in the S&P U.S. Investment Grade Corporate Bond Index and S&P U.S. High Yield Corporate Bond Index, respectively. For the S&P U.S. Investment-Grade Corporate Bond Index, there was barely any lasting disruption, as net issuance was up 26% in Q1 2020 and more than tripled in Q2 and Q3 2020 combined compared with the same quarters in 2019. For the S&P High Yield Corporate Bond Index, the impact of the Fed’s credit facilities on new bond issuance was more visible. In March, high-yield bond net issuance dropped 40% versus March 2019, when index credit spreads widened to 815 bps; then, issuance recovered and rose 80% and 52% in Q2 and Q3 2020 compared with Q2 and Q3 2019, respectively.

It is interesting to note that high-yield bond issuance rebounded, and investment-grade bonds further strengthened, as soon as the announcement of both credit facilities in March, but before the commencement of actual purchases by the SMCCF, which began only on May 12, 2020, for bond ETFs and on June 16, 2020, for individual bonds. The fact that the Fed has achieved a rapid rebound of market issuance with only USD 13 billion of corporate bond and ETF purchases demonstrated the effectiveness of both corporate credit facilities in providing a funding backstop, though their long-term impact on the health of the credit market remains to be seen.

The posts on this blog are opinions, not advice. Please read our Disclaimers.