Get Indexology® Blog updates via email.

In This List

Why Should You Diversify?

Q2 2020 Performance Review for the S&P Risk Parity Indices

As ETF Fund Flows Surge, Don’t Fight the Fed’s Passive Investing Philosophy

What Is in Store for S&P 500® Dividends? Only Time and the Pace of Recovery Will Tell

Global Islamic Indices Outperformed Benchmark by Nearly 10% in H1 2020: Examining the Key Drivers

Why Should You Diversify?

Contributor Image
Wes Crill

Vice President, Research

Dimensional Fund Advisors

When international stock returns lag, investors may feel tempted to double down on their home market. Historical data suggests the long-term benefits of diversifying globally.

With US stocks outperforming non-US stocks in recent years, some investors have again turned their attention toward the role that global diversification plays in their portfolios. In the five-year period ending March 31, 2020, the S&P 500 Index had an annualized return of 6.73%, while the S&P Developed Ex-US BMI (broad market index) lost 0.05% and the S&P Emerging BMI added 0.07%.

While there may be reasons why US-based investors would prefer a degree of home bias in their equity allocation, using return differences over a relatively short period as the sole input into this decision may result in missing opportunities that the global markets offer. It is important to remember that:

1) Non-US stocks help provide valuable diversification benefits.

2) Recent performance is not a reliable indicator of future returns.

There’s a World of Opportunity in Equities

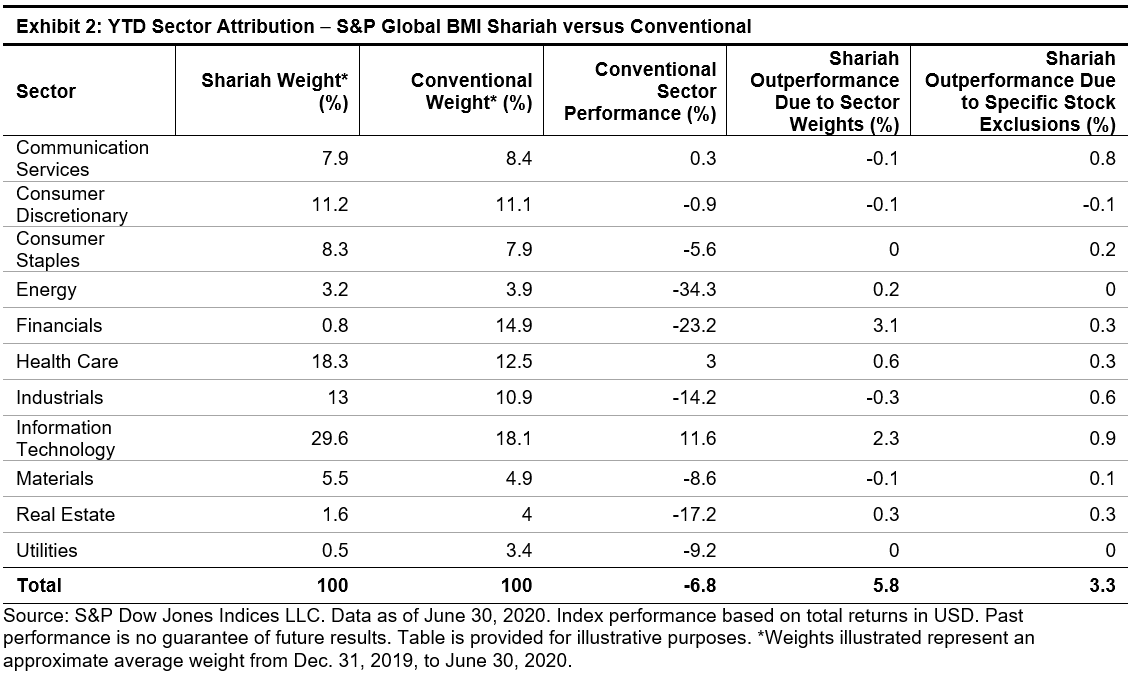
The global equity market is large and represents a world of investment opportunities. As shown in Exhibit 1, nearly half of the investment opportunities in global equity markets lie outside the US. Non-US stocks, including developed and emerging markets, account for 46% of world market capitalization1 and represent thousands of companies in countries all over the world. A portfolio investing solely within the US would not capture the performance of those markets.
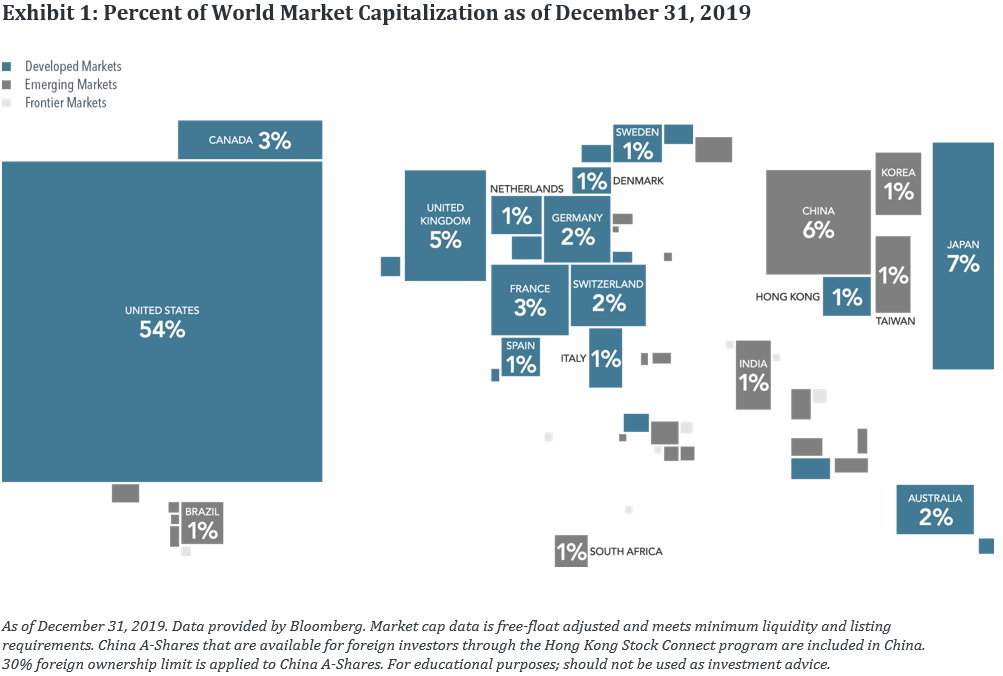
The Lost Decade

Recent history provides us with a valuable lesson on the importance of diversifying globally. The period from January 2000 to December 2009 is often called the “lost decade” by US investors, as the S&P 500 Index recorded one of its worst 10-year performances with a total cumulative return of    –9.1%. However, looking beyond US equities, conditions were more favorable for global equity investors as major indexes outside the US generated positive returns over the course of the decade (see Exhibit 2.)

Pick a Country?

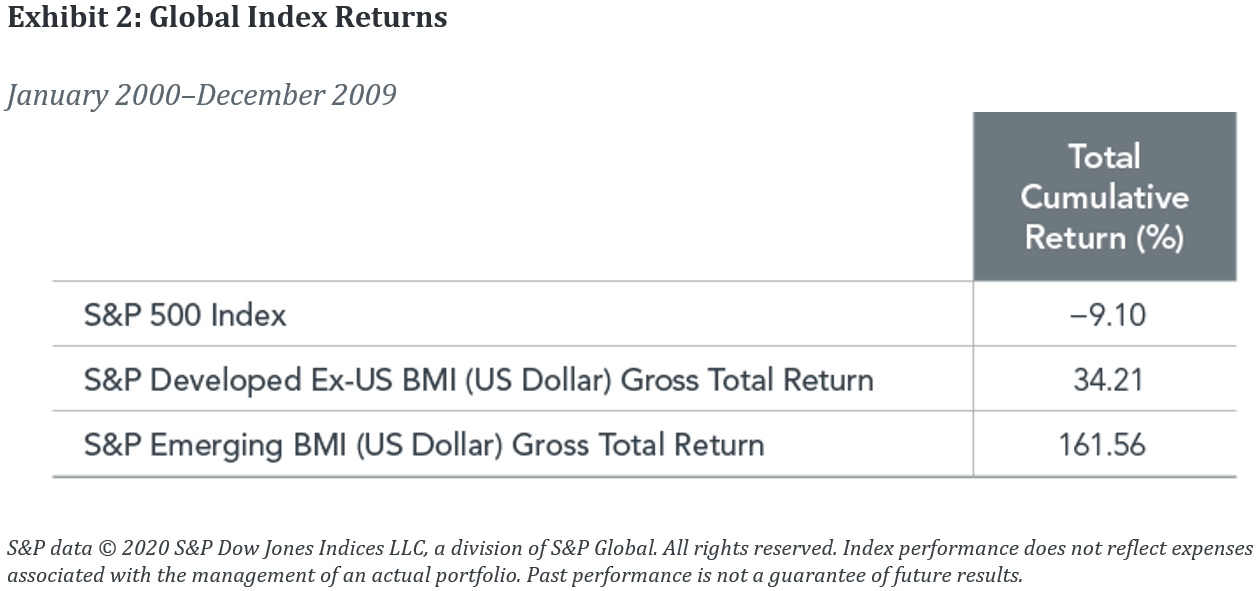
It only takes a cursory glance at the randomness of country stock market performance to understand the futility of using past performance as an input to asset allocation decisions. Exhibit 3 illustrates country equity market rankings (from highest to lowest) for 22 different developed market countries over the past 20 years. Notably, US stocks never once placed at the top over this period and finished in the bottom half in 10 of the 20 years.

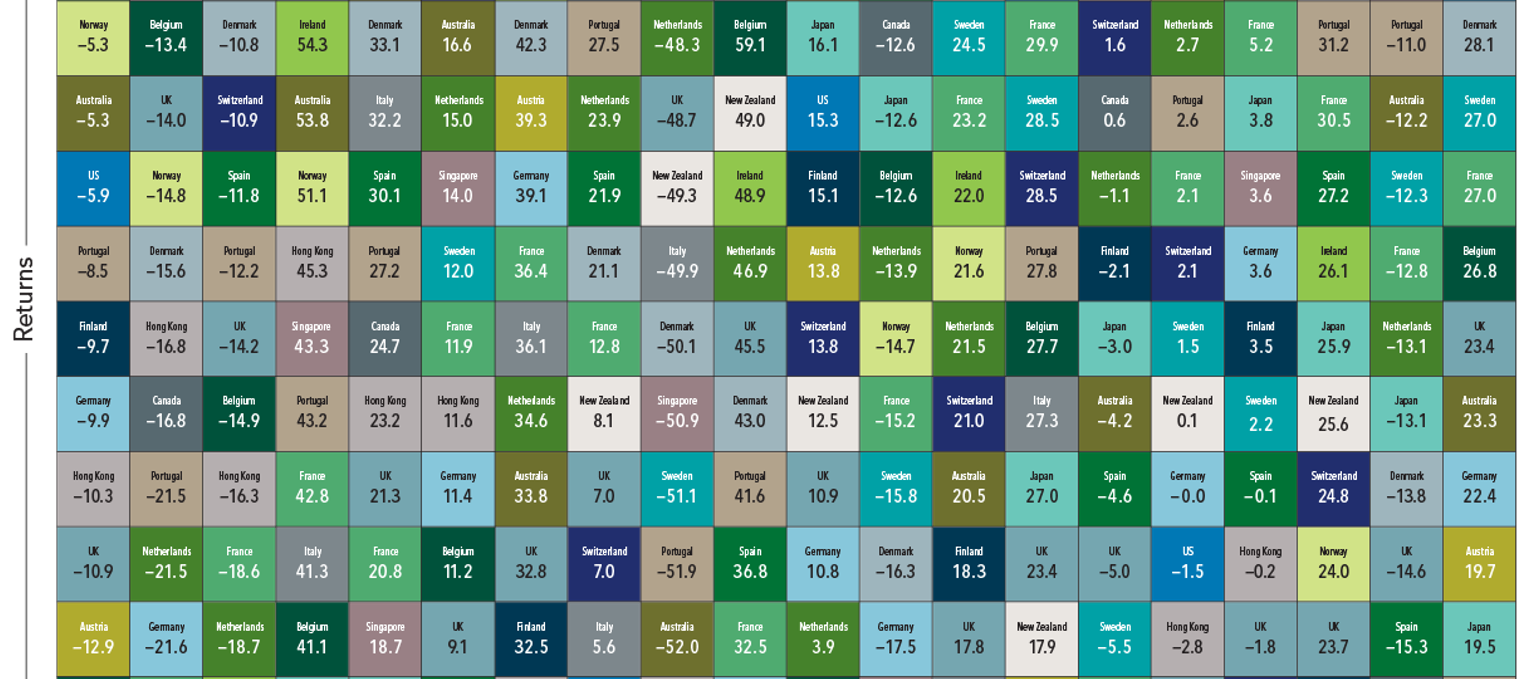
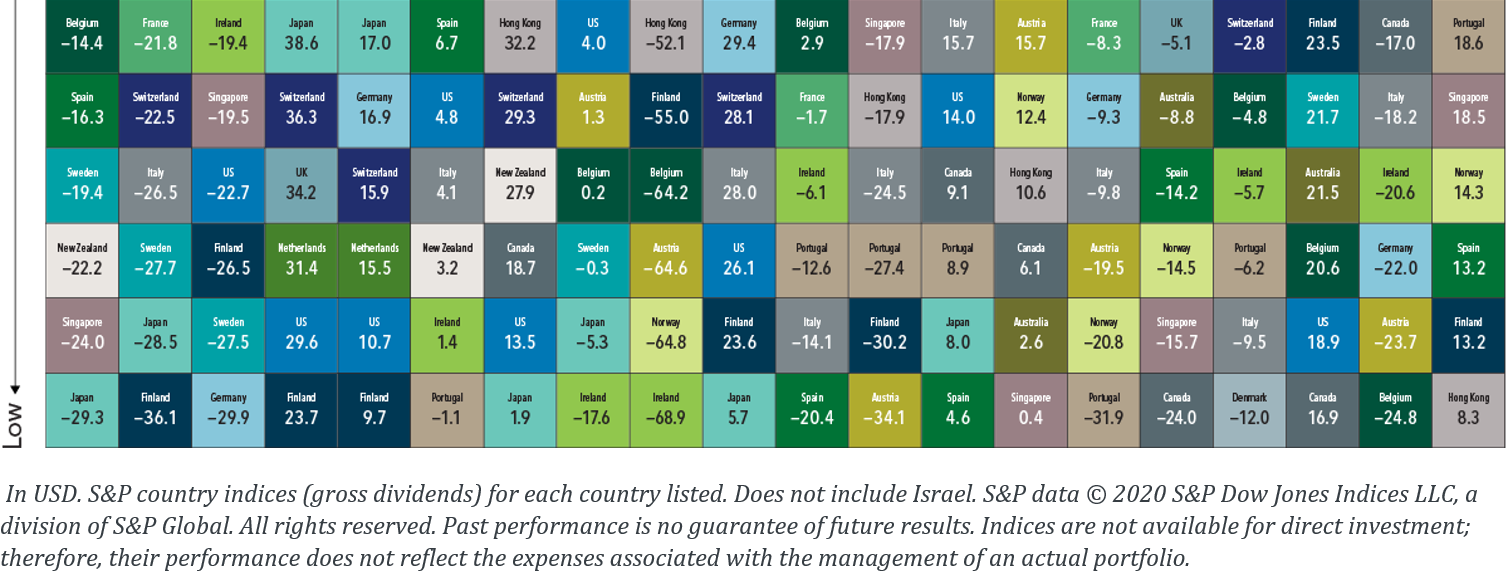
In addition, concentrating a portfolio in any one country can expose investors to large variations in returns. The difference between the best- and worst‑performing countries can be stark. For example, since 2000, the average return of the best‑performing developed market country was approximately 33% while the average return of the worst-performing country was approximately –13%. Diversification can spare investors the most extreme outcomes, helping provide more consistent returns.

A Diversified Approach

Over long periods, investors saving for retirement may benefit from consistent exposure in their portfolios to both US and non-US equities. While both asset classes offer the potential to earn positive expected returns in the long run, they may perform quite differently over short periods. While the performance of different countries and asset classes will vary over time, there is no reliable evidence that this performance can be predicted. An approach to equity investing that uses the global opportunity set available to investors can provide diversification benefits as well as potentially higher expected returns. 

  1. The total market value of a company’s outstanding shares, computed as price times shares outstanding.
Dimensional Fund Advisors LP is an investment advisor registered with the Securities and Exchange Commission.
Indices are not available for direct investment. Their performance does not reflect the expenses associated with the management of an actual portfolio. Past performance is not a guarantee of future results. Diversification does not eliminate the risk of market loss.
There is no guarantee investment strategies will be successful. Investing involves risks, including possible loss of principal. Investors should talk to their financial advisor prior to making any investment decision.
All expressions of opinion are subject to change. This article is distributed for informational purposes, and it is not to be construed as an offer, solicitation, recommendation, or endorsement of any particular security, products, or services.

The posts on this blog are opinions, not advice. Please read our Disclaimers.

Q2 2020 Performance Review for the S&P Risk Parity Indices

Contributor Image
Rupert Watts

Head of Factors and Dividends

S&P Dow Jones Indices

Risk appetite returned in the second quarter of 2020, spurred by the easing of COVID-19 lockdowns and aggressive economic stimulus measures. The S&P 500® rebounded, finishing the quarter up 20.5%, and yields on U.S. Treasuries saw little change. In commodities, the S&P GSCI rallied, with energy posting a sharp gain as oil-producing countries agreed on temporary production cuts.

During this time, the S&P Risk Parity Indices recovered most of the ground lost in the first quarter of 2020 (see Exhibit 1). The S&P Risk Parity Index – 10% Target Volatility posted a gain of 11.8% in the second quarter and was down 3.5% for the first half of the year.

Notably, the performance of the S&P Risk Parity Indices exceeded that of the manager composite, which is represented by the HFR Risk Parity Vol 10 Index. For reference, the HFR Risk Parity Indices represent the weighted average performance of the universe of active fund managers employing an equal risk-contribution approach in their portfolio construction.

While the S&P Risk Parity Index – 10% Target Volatility was on par with the HFR Risk Parity Vol 10 Index in the first quarter, it significantly outperformed in the second quarter by 4.9% (see Exhibit 2).

While it is hard to pinpoint the exact source of outperformance, the S&P Risk Parity Indices were well positioned to benefit from the rebound. Since they utilize a long look-back window (15 years) to determine asset class weights and leverage, their allocations remained fairly consistent throughout 2020.

As Exhibit 3 shows, the normalized asset class weights remained relatively unchanged YTD. Furthermore, the leverage decreased only slightly following the volatility spike in March 2020, meaning the S&P Risk Parity Indices did not miss out on the recovery in the second quarter.

It is also interesting to examine the asset class performance attribution of the S&P Risk Parity Index – 10% Target Volatility (using excess returns). The S&P Risk Parity Indices comprise three asset class sub-components: equities, fixed income, and commodities.

As Exhibit 4 shows, the positive performance in the second quarter of 2020 was driven by commodities and equities, up 3.6% and 7.3%, respectively. Year-to-date, the fixed income component posted meaningful positive performance, up 7.6%, but this was not enough to completely offset the other asset classes, particularly commodities, which was down 8.7% over the first half of the year.

Following the historic first two quarters for markets in 2020, it’s anyone’s guess as to what the rest of the year will bring. Investors will have to weigh reasons for optimism with reasons for caution. A well-diversified portfolio such as our S&P Risk Parity Indices may be appealing to those who don’t want to put all their eggs in one basket.

The posts on this blog are opinions, not advice. Please read our Disclaimers.

As ETF Fund Flows Surge, Don’t Fight the Fed’s Passive Investing Philosophy

Contributor Image
Brian Luke

Senior Director, Head of Commodities, Real & Digital Assets

S&P Dow Jones Indices

Investing legend Marty Zweig famously declared, “don’t fight the Fed.” With the Fed now buying fixed income ETFs and fund flows of index-based ETFs surging, Marty’s advice is proving timely. In this blog post, we review key index-based product performance leading up to the Fed’s intervention and detail the ETF fund flows that followed.

Back in March 2020, we discussed the liquidity impacts on fixed income ETFs.[1] We also recently looked at how the Fed’s intervention changed the structure of the secondary credit markets’ ETF assets and how trade volumes stepped in for declining broker-dealer balance sheets.[2] The Fed outlined several asset purchase schemes to stabilize the market; the fastest one put into action was direct purchases of fixed income ETFs that track major indices. Focusing on corporate bonds, the Fed committed to purchasing first investment-grade bonds, then high-yield bonds that comprised the ETFs. This drew a strong bid from the market, as investment-grade and high-yield bonds had their best quarter since 2009. This is precisely where many investors had taken the late Marty Zweig’s advice and simply followed the same passive approach by not fighting the Fed.

Asset flows surged in the markets where the Fed committed to buying, while other areas fared much more poorly. While the riskiest fixed income sectors saw steep outflows, only a few returned. Every core-plus sector saw steep outflows in March 2020. As the Fed committed to purchasing investment-grade bonds, enough demand was created to stop outflows and finish positive in March. Since then, investment-grade and high-yield bonds have subsequently attracted assets with the backing of the Fed, while emerging market debt experienced the deepest outflows.

In less credit-sensitive sectors, fund flows also highlighted contrasts as the asset recovery took shape. March 2020 showed investors flocking to short-term government bonds, while long-term bonds bore the brunt of the sell-off. That trend maintained through April. Not until May did we see investors looking to other safe havens like municipals, as conditions eased (with the Fed’s backing this time through the Municipal Liquidity Facility), and inflation concerns took hold as federal government deficits ballooned.

With the Fed stepping in, the performance of key market indices reflected the benefit of these extraordinary actions. However, fund flows have shown that the Fed’s rising tide did not lift all boats. Investor behavior has shifted toward short-term and high-yield bonds and away from long-term bonds and other riskier asset classes like emerging market debt. As market volatility has subsided from the depths of the March lows, investors have also increasingly looked at munis and TIPS (inflation-linked) bonds as alternative sources of security. As the fund flows bear out, the trend of index-based investing in fixed income seems to be here to stay. If Marty were alive today, perhaps he’d be following this trend instead of the ticker tape he so often cited.

[1] Brian Luke: Liquidity Impacts on Fixed Income ETFs and Passive Investing. March 18, 2020

[2] Evan Gunter, Brian Luke: Credit Trends: How ETFs Contributed To Liquidity And Price Discovery In The Recent Market Dislocation. July 8, 2020

The posts on this blog are opinions, not advice. Please read our Disclaimers.

What Is in Store for S&P 500® Dividends? Only Time and the Pace of Recovery Will Tell

Contributor Image
Howard Silverblatt

Senior Index Analyst, Product Management

S&P Dow Jones Indices

In the first half of 2020, the total amount of dividends paid out by S&P 500 companies rose 5.1% on a year-over-year basis (see A YTD History of S&P 500® Dividend Increases, Cuts, and Suspensions). However, the forward declarations for Q3 2020 show a decline. With 84% declared for July 2020, the month is poised to post a 4% payment decline (year over year). Based on the current public statements (and expected schedules), August is expected to post a 10% decline, with September showing a slight tick up (0.1%), leaving Q3 down 5% compared with Q3 2019.

The reality of Q3 2020 should start hitting market participants soon as companies declare their Q3 dividends (almost 70% of the issues are scheduled to report earnings in July 2020, with dividends typically around the release date). Big banks are expected to continue paying their rate (helped by the additional liquidity from suspending buybacks), with the exception of Wells Fargo, which decreased its rate, following the Federal Reserve’s stress test results.

The market is expecting much smaller increases for those increasing, with one penny now being the new wink. As for cuts, we expect few within the S&P 500 for the current Q3 period (but more than the historical average), as companies wade through the reopening and their cash flow (and cash burn). Of note, S&P 500 Industrials (Old)[1] issues had a record amount of cash reserves at the end of Q1 2020 (USD 1.68 trillion) and have been adding to those reserves via issuance (which has affected the divisor, especially with fewer buybacks) and debt, as liquidity remains a top priority.

For many market participants, the Q4 2020 payments remain more of a guessing game. If one takes a bullish approach toward the overall recovery and regions’ ability to limit the further spread of the virus, then the base estimate is for a 7%-8% year-over-year Q4 2020 decline in actual payments, assuming companies with a history of increasing payments would continue to do so, be it at a much lower rate.

In the near term, we do not anticipate dividend figures materially improving, as companies will likely remain careful with cash flows. Hence, after a record Q1 2020 payment, an impressive Q2 2020 payment, and calculating reduced Q3 and Q4 payments, the current working estimate for the S&P 500 2020 payment has improved to a modest 2% decline in the actual payment.

So, what is the picture for 2021 dividends? Before projecting for 2021, we must get through 2020 first, with the U.S. presidential election right around the corner. Politics, particularly tax policy, plays a significant role for dividends, similar to the economy. The August 2020 Democratic and Republican conventions and party policy platforms will give some insight, as the presidential and congressional election results will shore up the view (and market reaction). As for the economy, to some degree, the ability of regions to contain the current outbreak, as well as the depth and duration of the spread over the summer, and the development of drugs (to control or restrict the virus, or at least move the penalty for infection out of the death column) should dictate consumer behavior, which in turn drives the economy and the market.

[1]   The S&P 500 Industrials (Old) consists of the S&P 500 minus Financials, Real Estate (which was part of Financials), Utilities, and Transportation (which is now a subgroup of the GICS® Industrials sector. Note the S&P 500 Industrials (Old) dates back for decades, so when the GICS classifications were developed and one of the new sectors was Industrials, the former group was referred to as the S&P 500 Industrials (Old).

The posts on this blog are opinions, not advice. Please read our Disclaimers.

Global Islamic Indices Outperformed Benchmark by Nearly 10% in H1 2020: Examining the Key Drivers

Contributor Image
John Welling

Director, Global Equity Indices

S&P Dow Jones Indices

Global equities rallied during Q2 2020, gaining 20% as measured by the S&P Global BMI. Shariah-compliant benchmarks, meanwhile, including the S&P Global BMI Shariah and Dow Jones Islamic Market (DJIM) World Index, significantly outperformed—entering positive territory YTD—well ahead of the 6.8% decline of the S&P Global BMI (see Exhibit 1). The outperformance trend played out across all major regions, with the DJIM World Emerging Markets Index leading the pack, providing an additional 13.1% return above the conventional benchmark.

Sector Performance a Key Driver

Amid the Q2 equity market recovery, sector drivers continued to play an important role in Shariah outperformance, as Information Technology—which tends to be overweight in Islamic indices—outperformed among sectors, while Financials—which is underrepresented in Islamic indices—heavily underperformed the broader market. Exhibit 2 demonstrates the effect of returns of over- and underweight sector allocations of the S&P Global BMI Shariah compared with the conventional benchmark. A majority of outperformance—5.8% of the 9.1% total outperformance YTD—is explained by differing sector allocations, while 3.3% is explained by stock selection differences within sectors.

Shariah-Compliant Indices Reveal Momentum, Large Size, and Profitability Characteristics

 While sector preferences of Shariah-compliant indices explain a degree of outperformance, a review of the Axioma style factor characteristics YTD highlights the more dominant characteristics of included companies. The preference for companies oriented toward momentum, large size, and profitability—while avoiding companies whose performance is largely driven by factors including value, yield, and leverage—allowed Islamic indices to excel during the current market environment.

For more information on how Shariah-compliant benchmarks performed in Q2 2020, read our latest Shariah Scorecard.

This article was first published in Islamic Finance news Volume 17 Issue 28 dated the 15th July 2020.

The posts on this blog are opinions, not advice. Please read our Disclaimers.