Get Indexology® Blog updates via email.

In This List

Durability During Distress - Part 2

The New Purpose of a Corporation; or, What We’ve Known All Along

COVID-19 Revelations – Health (Care) Is Wealth

Exploring Low Volatility over the Long-Term in India

S&P 500 Dividend Futures: Divining Time To Recovery

Durability During Distress - Part 2

Contributor Image
Anu Ganti

U.S. Head of Index Investment Strategy

S&P Dow Jones Indices

Dividends play a vital role in many investors’ approach to the market, although there is more than one way to approach dividends. Some investors are most concerned with dividend yield per se, while others are more sensitive to the growth of dividends over time.  Both approaches, of course, can be readily indicized.  Within the U.S. large capitalization universe, the S&P 500 High Dividend Index comprises the highest-yielding companies in the S&P 500.  The S&P 500 Dividend Aristocrats, in contrast, consists of S&P 500 members that have increased their dividends annually for at least 25 years.   Exhibit 1 shows that both strategies have outperformed the S&P 500 over the long term.

In the short run, however, investor attention has turned increasingly to the sustainability of dividends, as more companies continue to cut or suspend their payouts. We previously discussed the tradeoff between the level versus the safety of dividend payments, and illustrated the durability of the S&P High Yield Dividend Aristocrats compared to an equivalent universe of high-payers.  Here we conduct a similar analysis for large-cap Aristocrats, comparing them to the S&P 500 High Dividend Index, and see similar results: The S&P 500 Dividend Aristocrats’ dividends are safer than their high yielding peers.

Source: S&P Dow Jones Indices LLC. Data from December 1991 to April 2020. Index performance based on total return in USD. Past performance is no guarantee of future results. Chart is provided for illustrative purposes.

Exhibit 2 compares the median values of the 500 Dividend Aristocrats and the High Dividend Index on a number of fundamental metrics that measure the strength of companies making dividend payouts.

The S&P 500 Dividend Aristocrats appear stronger across the board. For example:

  • Earnings were almost double last year’s dividend payouts for the Aristocrats, vs. only 1x dividends for the high payers. Cash on hand was also a higher multiple of last year’s dividends.
  • The Aristocrats’ buybacks were more than double those of the high payers, giving them more flexibility during a downturn like the present circumstances.
  • Within large-caps, the Aristocrats are 2 times larger (median capitalization $29 billion) and more profitable (median ROE 18.9%) than their higher-paying counterparts.
Source: S&P Dow Jones Indices LLC, FactSet and S&P Capital IQ. Market cap data as of April 2020, remaining data as of 2019 calendar year-end. Metrics listed include the median levels. Chart is provided for illustrative purposes.

We again caution that while we do not know how many more companies will cut or suspend their dividends or how severe the impact will be, we can conclude that the dividends of large-cap companies with consistent dividend growth are in healthier shape to withstand economic and market declines.


The posts on this blog are opinions, not advice. Please read our Disclaimers.

The New Purpose of a Corporation; or, What We’ve Known All Along

Contributor Image
Daniel Perrone

Former Director and Head of Operations, ESG Indices

S&P Dow Jones Indices

Late last summer, nearly 200 chief executives (S&P Global’s own CEO, Doug Peterson, included) put their signatures on a new statement of the purpose of a corporation,[1] one focused not only on shareholder value, but on value for all key stakeholders. The declaration emphasizes people—employees, customers, and communities—in which employers know they must invest to ensure long-term growth and success. This renewed focus on a company’s contributions to society as a whole is in line with the increased popularity in sustainable investing; one-quarter of all professionally managed assets now incorporate environmental, social, and governance (ESG) considerations.[2]

If this sounds familiar, it’s because Peter Drucker, the management guru whose principles underlie the constituent selection and weighting of the S&P/Drucker Institute Corporate Effectiveness Index, started leading this charge more than 50 years ago. Drucker, whom Businessweek famously called “the man who invented management,” codified the practice of effectiveness: not only doing well, but doing the right things well.

The Drucker Institute has developed a rigorous system to measure how well companies do these right things, including customer satisfaction, employee engagement and development, innovation, and social responsibility. The S&P/Drucker Institute Corporate Effectiveness Index combines these measures with S&P DJI’s quality score—an important piece to the puzzle, because even though the bottom line isn’t the only thing, it is something.

The result is a single holistic measure of a company’s overall management that aims to create value while also managing risk—vital in today’s markets.

Over the one-, three-, and five-year periods ending May 1, 2020, the S&P/Drucker Institute Corporate Effectiveness Index outperformed its benchmark, the S&P 500, by more than 200 bps annually. In fact, the strongest outperformance was over the past 12 months, highlighting the crucial importance of a holistic view of companies and their management. Even more telling are the risk numbers that showcase lower index volatility and higher risk-adjusted returns compared with the S&P 500 over these same periods.

It’s not often that an index matches this kind of outperformance with holistic ESG principles—and a public endorsement of those principles by the companies that the index tracks. The S&P/Drucker Institute Corporate Effectiveness Index could offer relevance for investors who want to do good, performance for investors who want to do well, and effectiveness for investors who want the best of both.

[1]   https://www.businessroundtable.org/business-roundtable-redefines-the-purpose-of-a-corporation-to-promote-an-economy-that-serves-all-americans

[2]   Kell, Georg. “The Remarkable Rise of ESG.” Forbes. July 11, 2018.

The posts on this blog are opinions, not advice. Please read our Disclaimers.

COVID-19 Revelations – Health (Care) Is Wealth

Contributor Image
Koel Ghosh

Former Head of South Asia

S&P Dow Jones Indices

In the battle against the COVID-19 pandemic, the importance of healthcare has gained significance. Markets are witnessing new trends across asset classes, while meeting new challenges. Asset-allocation strategies are being reviewed to adjust to the new conditions. Equity sectors are facing the heat of these unprecedented times, but some trends are similar for both global and Indian markets.

The Health Care sector has been one such case. Not only has it outperformed over these past few months of uncertainty, but it also has had a good historical track record. Comparing the Health Care sectors of the Indian and U.S. markets, similar trends of outperformance versus their benchmarks were visible over different time periods. In the U.S. market, the Health Care Select Sector, which consists of all components of the S&P 500® that are classified in the Health Care sector, had a 10-year annualized return of 14.63%, as compared with an 11.69% return from the S&P 500. In Indian markets, the S&P BSE Healthcare had a 10-year annualized return of 11.11%, as compared with a 6.74% return from the S&P BSE SENSEX (as of April 30, 2020). A study on the Australian market and its Health Care sector performance relative to its benchmark showed similar trends (read more here).

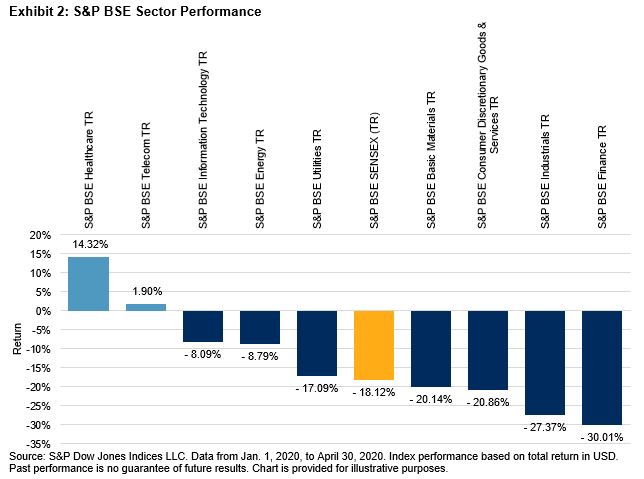
A comparison of the Health Care sector performance since January 2020 revealed that the majority of the sectors in the S&P BSE SENSEX, other than Health Care and Telecommunications, underperformed, including the S&P BSE SENSEX itself. The S&P BSE Finance, at -30.01%, and S&P BSE Industrials, at -27.27%, reflected the top sector laggards. The S&P BSE SENSEX, at -18.12%, was well below the S&P BSE Healthcare, which returned 14.32% for the period from Jan. 1, 2020, to April 30, 2020.

Taking an overview of this sector relative to other Indian benchmarks, such as the S&P BSE 100 and S&P BSE 500, further reflected the consistent outperformance of the S&P BSE Healthcare.

Of the 69 constituents in the S&P BSE Healthcare, the top 10 constituents were 65.53% of the total index weight as of April 30, 2020. Sun Pharmaceutical Industries Ltd and Dr. Reddy Laboratories, with index weights of 13.33% and 12.65%, respectively, constituted the top weights in the index.

The posts on this blog are opinions, not advice. Please read our Disclaimers.

Exploring Low Volatility over the Long-Term in India

How does the low volatility factor respond to periods of crisis and do the results tend to hold over the long term in India? S&P DJI’s Koel Ghosh takes a closer look at the low volatility anomaly in India.

Read more here: https://www.indexologyblog.com/2020/03/24/low-volatility-strategies-in-times-of-high-volatility/.

The posts on this blog are opinions, not advice. Please read our Disclaimers.

S&P 500 Dividend Futures: Divining Time To Recovery

Contributor Image
Tim Edwards

Managing Director, Index Investment Strategy

S&P Dow Jones Indices

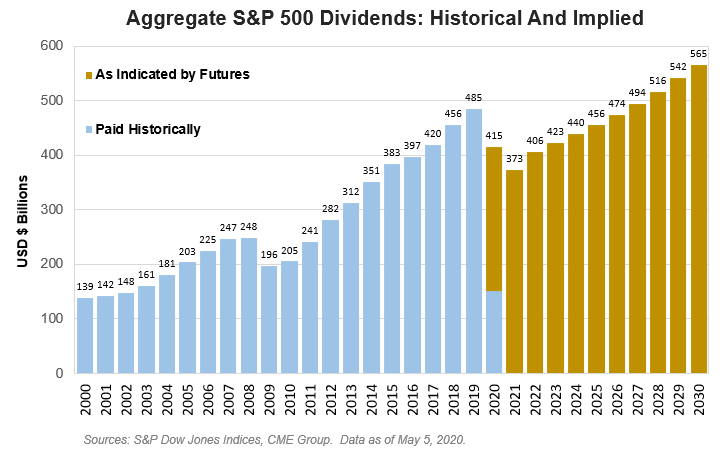
In 2019, the S&P 500® companies in aggregate paid a record $485 billion in dividends.  This year, the figure could be closer to $415 billion, and it could be another seven years before they recover to 2019 levels, according to futures prices.  Dividend futures, that is.

Index futures based on the level of the S&P 500 may be more familiar than those based on its dividends, but there is a simple connection between the two.  An arbitrage mechanism connects index futures prices to current (“spot”) values of the S&P 500; the difference between spot and futures prices depends on the difference between interest rates and dividend yields until expiry of the future.  Interest rates are knowable in advance; dividend payments are not.  Dividend futures are designed to hedge this uncertainty.

In 2015, the CME launched a futures contract based on the annual dividends paid by a portfolio tracking the S&P 500.  Today one can trade any of 11 contracts stretching out to the year 2030, with pricing based on “index points”; in 2019, for example, S&P 500 dividends amounted to 52.2 index points (versus an average S&P 500 index level of 2,913).   Each year’s contract is settled at the total dividend points paid during that calendar year.

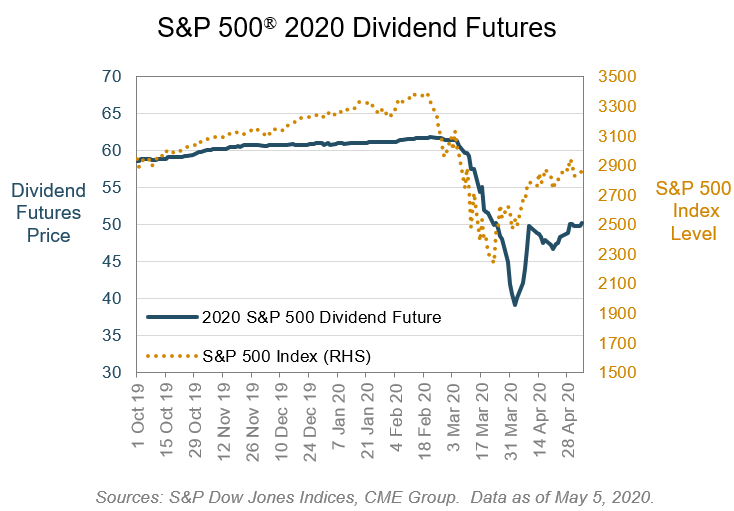
Stock prices usually move faster than fundamentals, and dividend futures are typically more stable than stock index futures.  Not this year, however: the peak-to-trough decline in the 2020 S&P 500 dividend future in 2020 was 37%, compared to only 34% for the S&P 500.  Having fallen further, the dividend future then lagged the recovery afterwards.  The S&P 500 closed yesterday around the same level it began last October; the 2020 dividend future is still 15% lower.

The collapse in 2020 dividend expectations is more extreme considering that some dividends have already been paid this year: in the first quarter, aggregate S&P 500 dividends were still breaking payout recordsLooking at the next contract out, the 2021 futures contract is currently priced at 44 – another 12% below this year’s future – and is perhaps a better guide as to what dividend run rate to expect in the medium term. 

The existence of dividend futures ranging out several years allow us to make comparisons with total dividends paid historically and anticipated in coming years.  To put the information expressed by futures prices in a tangible context, using the same mathematics that converts an index level to the aggregate capitalization of all the index constituents, we can express the prices of dividend futures in terms of the total dollar amounts of dividends paid out by the companies in the S&P 500.  Exhibit 2 illustrates the conversion from annual futures prices into total aggregate dividends, in comparison to historical payments to shareholders.

Of course, futures prices are not perfect predictions. The dividend futures markets may be overly pessimistic – they have tended to underestimate payouts historically.  But there are plenty of reasons to suppose that prices should recover faster than dividends.  Declining U.S. Treasury yields offer a justification for valuations to increase faster than fundamentals (as discount rates fall), while dividends themselves may prove less popular with some shareholders and CEOs during a time of economic uncertainty.  Time will tell, but if we take futures prices as imperfect guides, it seems fair to conclude that S&P 500 dividend payments could slow considerably in the short term and take quite a few years more to recover.

The posts on this blog are opinions, not advice. Please read our Disclaimers.